
本指南說明如何使用 Google Colab,快速開始透過 Python 向 Earth Engine REST API 發出查詢。從其他語言和環境存取 API 時,也適用相同的概念。
注意: REST API 包含新功能和進階功能,可能不適合所有使用者。如果您是第一次使用 Earth Engine,請先參閱 JavaScript 指南。
 在 Google Colab 中執行
 前往 GitHub 查看原始碼
事前準備
請按照這些說明操作:
設定 Colab 筆記本
如果您是從頭開始進行這項快速入門導覽課程,可以按一下 Colab 起始頁面中的「NEW NOTEBOOK」建立新的 Colab 筆記本,然後在新的程式碼儲存格中輸入下方的程式碼範例。Colab 已安裝 Cloud SDK。包括可用於管理 Cloud 服務的 gcloud 指令列工具。或者,您也可以點選本頁開頭的按鈕,執行示範筆記本。
向 Google Cloud 驗證
首先,請登入帳戶,以便向 Google Cloud 提出經過驗證的要求。
在 Colab 中,您可以執行以下程式碼:
PROJECT = 'my-project'
!gcloud auth login --project {PROJECT}
(如果是在本機執行,請從指令列執行,前提是您已安裝 Cloud SDK):
PROJECT='my-project'
gcloud auth login --project $PROJECT
接受使用 Google 使用者帳戶登入的選項,並完成登入程序。
取得服務帳戶的私密金鑰檔案
您必須先下載私密金鑰檔案,才能使用服務帳戶進行驗證。如要在 Colab 中執行這項操作,請將資料集下載到筆記本 VM:
SERVICE_ACCOUNT='foo-name@project-name.iam.gserviceaccount.com'
KEY = 'my-secret-key.json'
!gcloud iam service-accounts keys create {KEY} --iam-account {SERVICE_ACCOUNT}
或透過指令列:
SERVICE_ACCOUNT='foo-name@project-name.iam.gserviceaccount.com'
KEY='my-secret-key.json'
gcloud iam service-accounts keys create $KEY --iam-account $SERVICE_ACCOUNT
存取及測試憑證
現在可以將第一個查詢傳送至 Earth Engine API。使用私密金鑰取得憑證。使用憑證建立授權工作階段,以便提出 HTTP 要求。您可以將這段程式碼輸入 Colab 筆記本的新程式碼儲存格。(如果使用指令列,請務必確認已安裝必要程式庫)。
from google.auth.transport.requests import AuthorizedSession
from google.oauth2 import service_account

credentials = service_account.Credentials.from_service_account_file(KEY)
scoped_credentials = credentials.with_scopes(
    ['https://www.googleapis.com/auth/cloud-platform'])

session = AuthorizedSession(scoped_credentials)

url = 'https://earthengine.googleapis.com/v1alpha/projects/earthengine-public/assets/LANDSAT'

response = session.get(url)

from pprint import pprint
import json
pprint(json.loads(response.content))
如果所有設定都正確無誤,執行這項指令後會產生類似以下的輸出內容:
{'id': 'LANDSAT',
 'name': 'projects/earthengine-public/assets/LANDSAT',
 'type': 'FOLDER'}
選取資料集
您可以使用 Earth Engine 程式碼編輯器 (code.earthengine.google.com) 搜尋及探索可用的資料集。現在來搜尋 Sentinel 2 資料。(如果是第一次使用程式碼編輯器,登入時系統會提示您授權,允許程式碼編輯器代表您存取 Earth Engine)。在程式碼編輯器頂端的搜尋框中,搜尋「sentinel」。畫面上會顯示多個光柵資料集:
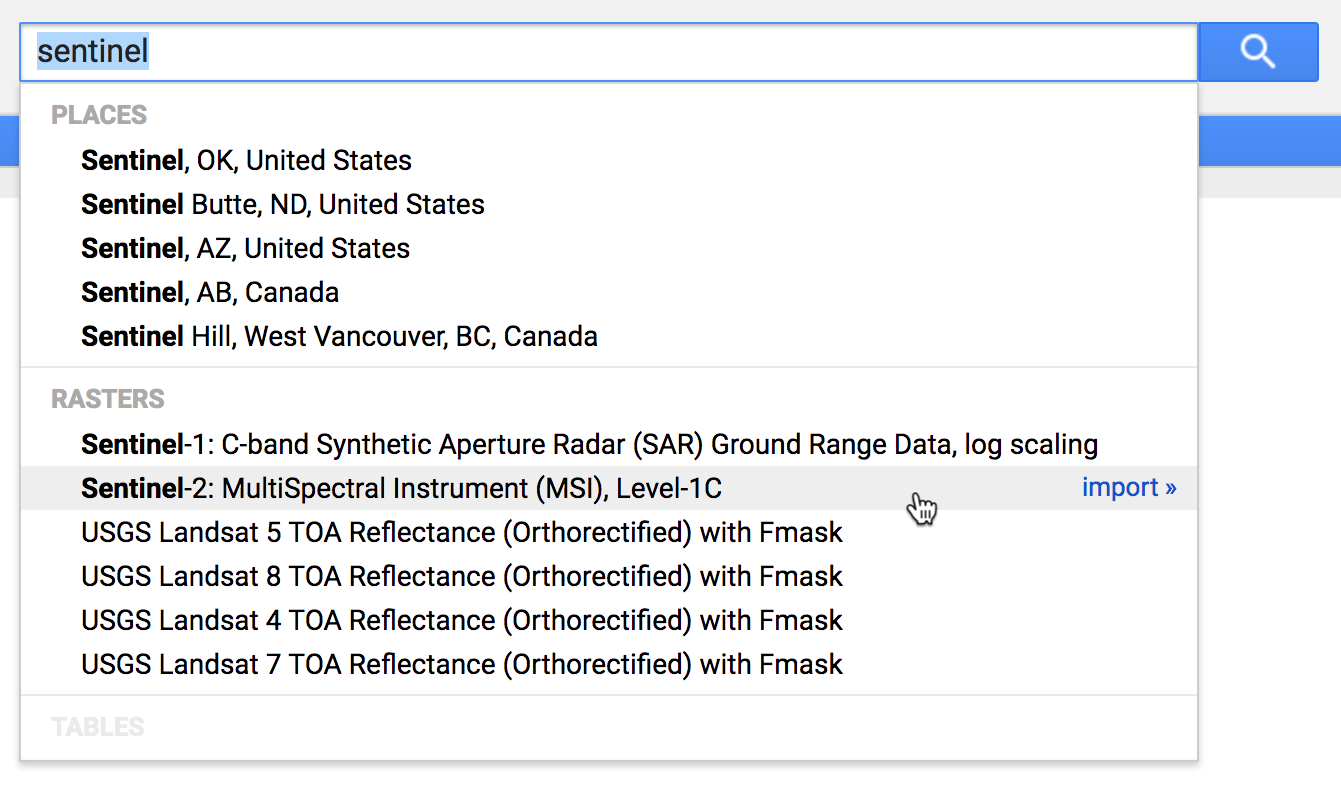
按一下「Sentinel-2: MultiSpectral Instrument (MSI), Level-1C」:
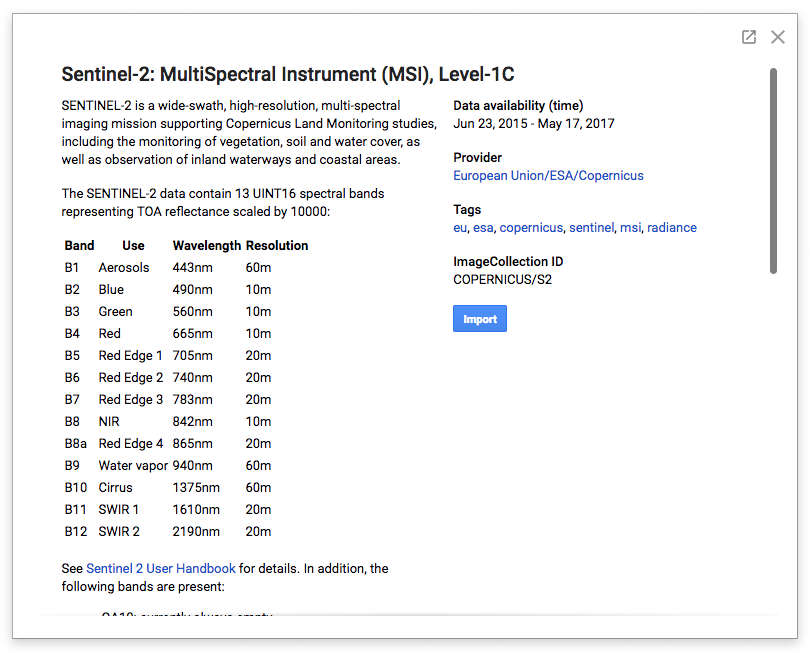
這類資料集說明頁面包含使用 Earth Engine 公開資料目錄中任何資料集所需的重要資訊,包括資料集的簡短說明、資料提供者的連結 (可取得其他詳細資料)、可能適用於資料集的任何使用限制資訊,以及資料集的 Earth Engine 資產 ID。
在這個例子中,我們可以在視窗右側看到這是一個圖片集合素材資源,路徑為 COPERNICUS/S2_HARMONIZED。
查詢特定圖片
這個 Sentinel-2 資料集包含超過兩百萬張圖片,涵蓋 2015 年至今的全球資料。我們對圖片集合發出 projects.assets.listImages 查詢,找出 2017 年 4 月雲量較低、包含加州山景城特定地點的資料。
import urllib

coords = [-122.085, 37.422]

project = 'projects/earthengine-public'
asset_id = 'COPERNICUS/S2_HARMONIZED'
name = '{}/assets/{}'.format(project, asset_id)
url = 'https://earthengine.googleapis.com/v1alpha/{}:listImages?{}'.format(
  name, urllib.parse.urlencode({
    'startTime': '2017-04-01T00:00:00.000Z',
    'endTime': '2017-05-01T00:00:00.000Z',
    'region': '{"type":"Point", "coordinates":' + str(coords) + '}',
    'filter': 'CLOUDY_PIXEL_PERCENTAGE < 10',
}))

response = session.get(url)
content = response.content

for asset in json.loads(content)['images']:
    id = asset['id']
    cloud_cover = asset['properties']['CLOUDY_PIXEL_PERCENTAGE']
    print('%s : %s' % (id, cloud_cover))
這個指令碼會查詢集合中相符的圖片,解碼產生的 JSON 回應,並列印每個相符圖片素材資源的資產 ID 和雲層覆蓋率。輸出內容應如下所示:
COPERNICUS/S2_HARMONIZED/20170420T184921_20170420T190203_T10SEG : 4.3166
COPERNICUS/S2_HARMONIZED/20170430T190351_20170430T190351_T10SEG : 0
顯然,這個月在這個點上有兩張雲層覆蓋率低的圖片。
檢查特定映像檔
其中一張相符圖片基本上沒有雲層覆蓋。我們來仔細看看這個 ID 為 COPERNICUS/S2_HARMONIZED/20170430T190351_20170430T190351_T10SEG 的資產。請注意,所有公開目錄資產都屬於 earthengine-public 專案。以下 Python 程式碼片段會發出 projects.assets.get 查詢,依 ID 擷取特定資產的詳細資料、列印可用的資料波段,並列印第一個波段的詳細資訊:
asset_id = 'COPERNICUS/S2_HARMONIZED/20170430T190351_20170430T190351_T10SEG'
name = '{}/assets/{}'.format(project, asset_id)
url = 'https://earthengine.googleapis.com/v1alpha/{}'.format(name)

response = session.get(url)
content = response.content

asset = json.loads(content)
print('Band Names: %s' % ','.join(band['id'] for band in asset['bands']))
print('First Band: %s' % json.dumps(asset['bands'][0], indent=2, sort_keys=True))
輸出內容大致如下:
Band Names: B1,B2,B3,B4,B5,B6,B7,B8,B8A,B9,B10,B11,B12,QA10,QA20,QA60
First Band: {
  "dataType": {
    "precision": "INTEGER",
    "range": {
      "max": 65535
    }
  },
  "grid": {
    "affineTransform": {
      "scaleX": 60,
      "scaleY": -60,
      "translateX": 499980,
      "translateY": 4200000
    },
    "crsCode": "EPSG:32610",
    "dimensions": {
      "height": 1830,
      "width": 1830
    }
  },
  "id": "B1",
  "pyramidingPolicy": "MEAN"
}
資料頻帶清單與先前在資料集說明中看到的內容相對應。我們可以看到這個資料集在 EPSG:32610 座標系統 (或 UTM Zone 10N) 中有 16 位元整數資料。第一個波段的 ID 為 B1,解析度為每像素 60 公尺。在這個座標系統中,圖片的原點位於 (499980,4200000) 位置。
affineTransform.scaleY 的負值表示原點位於圖片的西北角,通常情況下:增加 y 像素索引對應於減少 y 空間座標 (向南)。
擷取像素值
接著,我們發出 projects.assets.getPixels 查詢,從這張圖片的高解析度波段擷取一些資料。資料集說明頁面指出,B2、B3、B4 和 B8 波段的解析度為每像素 10 公尺。這個指令碼會從這四個波段擷取左上角 256x256 像素的資料圖塊。以 numpy NPY 格式載入資料,即可輕鬆將回應解碼為 Python 資料陣列。
import numpy
import io

name = '{}/assets/{}'.format(project, asset_id)
url = 'https://earthengine.googleapis.com/v1alpha/{}:getPixels'.format(name)
body = json.dumps({
    'fileFormat': 'NPY',
    'bandIds': ['B2', 'B3', 'B4', 'B8'],
    'grid': {
        'affineTransform': {
            'scaleX': 10,
            'scaleY': -10,
            'translateX': 499980,
            'translateY': 4200000,
        },
        'dimensions': {'width': 256, 'height': 256},
    },
})

pixels_response = session.post(url, body)
pixels_content = pixels_response.content

array = numpy.load(io.BytesIO(pixels_content))
print('Shape: %s' % (array.shape,))
print('Data:')
print(array)
輸出內容應如下所示:
Shape: (256, 256)
Data:
[[( 899, 586, 351, 189) ( 918, 630, 501, 248) (1013, 773, 654, 378) ...,
  (1014, 690, 419, 323) ( 942, 657, 424, 260) ( 987, 691, 431, 315)]
 [( 902, 630, 541, 227) (1059, 866, 719, 429) (1195, 922, 626, 539) ...,
  ( 978, 659, 404, 287) ( 954, 672, 426, 279) ( 990, 678, 397, 304)]
 [(1050, 855, 721, 419) (1257, 977, 635, 569) (1137, 770, 400, 435) ...,
  ( 972, 674, 421, 312) (1001, 688, 431, 311) (1004, 659, 378, 284)]
 ...,
 [( 969, 672, 375, 275) ( 927, 680, 478, 294) (1018, 724, 455, 353) ...,
  ( 924, 659, 375, 232) ( 921, 664, 438, 273) ( 966, 737, 521, 306)]
 [( 920, 645, 391, 248) ( 979, 728, 481, 327) ( 997, 708, 425, 324) ...,
  ( 927, 673, 387, 243) ( 927, 688, 459, 284) ( 962, 732, 509, 331)]
 [( 978, 723, 449, 330) (1005, 712, 446, 314) ( 946, 667, 393, 269) ...,
  ( 949, 692, 413, 271) ( 927, 689, 472, 285) ( 966, 742, 516, 331)]]
如要從這張圖片中選取另一組像素,只要據此指定 affineTransform 即可。請注意,affineTransform 是在圖片的空間座標參照系統中指定;如果您想改用「像素」座標調整原點位置,請使用以下簡單公式:
request_origin = image_origin + pixel_scale * offset_in_pixels
生成縮圖圖片
我們可以使用類似的機制,生成這張圖片的 RGB 縮圖。我們不會要求原始解析度的資料,而是會明確指定區域和圖片尺寸。如要取得整張圖片的縮圖,可以使用圖片的足跡幾何圖形做為要求區域。最後,指定紅、綠、藍色影像波段和適當的資料值範圍,即可取得精美的 RGB 縮圖。
總而言之,Python 程式碼片段看起來會像這樣 (使用 Colab IPython 圖片顯示小工具):
url = 'https://earthengine.googleapis.com/v1alpha/{}:getPixels'.format(name)
body = json.dumps({
    'fileFormat': 'PNG',
    'bandIds': ['B4', 'B3', 'B2'],
    'region': asset['geometry'],
    'grid': {
        'dimensions': {'width': 256, 'height': 256},
    },
    'visualizationOptions': {
        'ranges': [{'min': 0, 'max': 3000}],
    },
})

image_response = session.post(url, body)
image_content = image_response.content

from IPython.display import Image
Image(image_content)
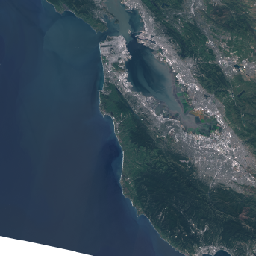
產生的縮圖如下: