我們希望這項新檢視畫面和改善的資料更新頻率能協助您以更完善、清晰的方式監控近期發布的內容並及時採取適當行動。歡迎提供您對這項新檢視畫面的想法和使用體驗,並提供任何建議,協助讓這項功能更臻完美。如有任何意見回饋、問題或評論,歡迎前往 LinkedIn 與我們交流,或是在 Google 搜尋中心社群發文提問。
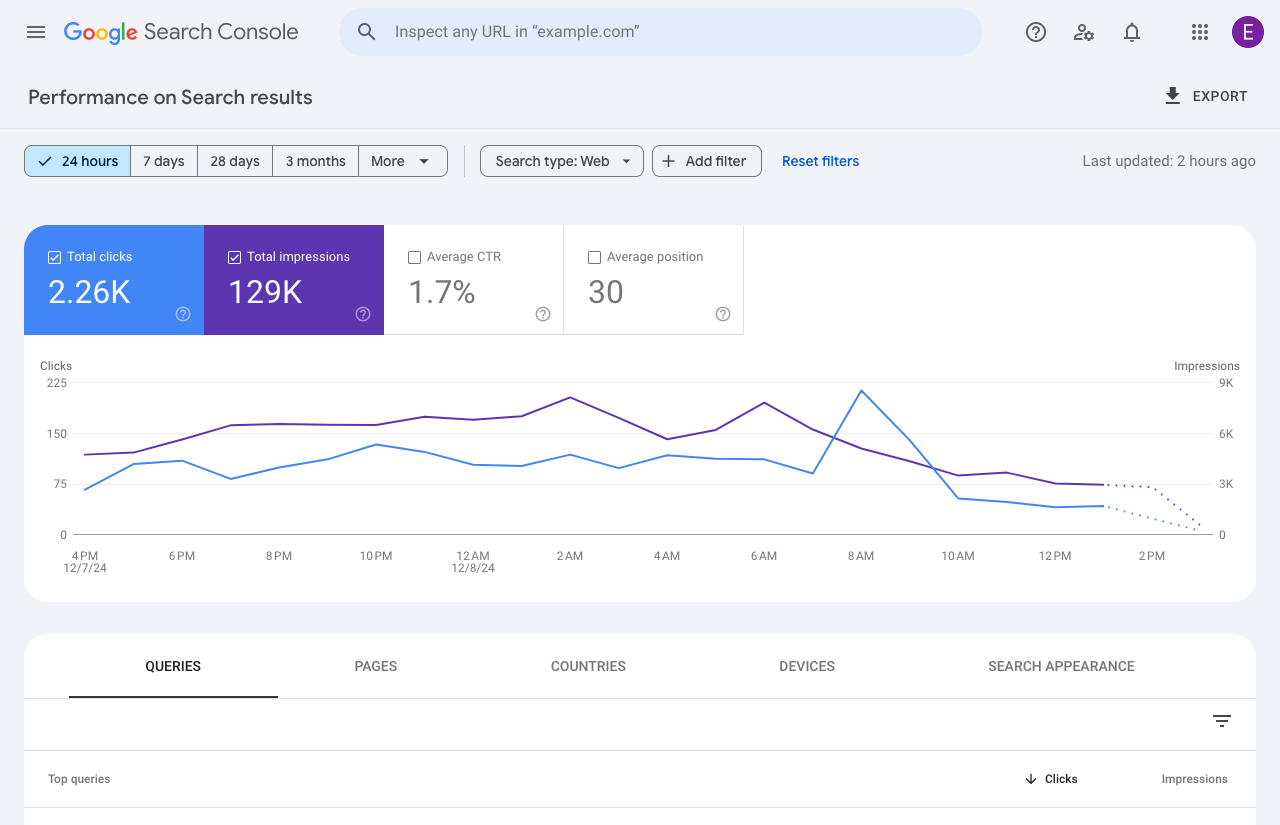
[[["容易理解","easyToUnderstand","thumb-up"],["確實解決了我的問題","solvedMyProblem","thumb-up"],["其他","otherUp","thumb-up"]],[["缺少我需要的資訊","missingTheInformationINeed","thumb-down"],["過於複雜/步驟過多","tooComplicatedTooManySteps","thumb-down"],["過時","outOfDate","thumb-down"],["翻譯問題","translationIssue","thumb-down"],["示例/程式碼問題","samplesCodeIssue","thumb-down"],["其他","otherDown","thumb-down"]],[],[],["Search Console is launching a '24 hours' view for performance reports, accessible via the \"24 hours\" tab. This view displays data with only a few hours' delay, showing recent performance of pages, queries, and published content. It provides hourly granularity in overtime graphs, includes clicks, impressions, CTR, and position, and breaks data down by dimensions. Data is displayed in the user's local time zone and is part of an effort to improve data freshness, decreasing the delay by almost half.\n"]]