Wednesday, March 22, 2023
Search Console provides data about your website performance on Google Search. This data can be accessed on Looker Studio (previously known as Data Studio), where you can build dashboards to monitor and explore your performance.
One advantage of analyzing your performance data outside Search Console is that it allows you to add more context to your reports, you can enrich the data with any sources, like technical and business information you have about your site. When analyzing your performance, the more data sources you combine, the better you can understand what helps you achieve your results; this will help you make better decisions using your data.
Looker Studio provides data blending functionality, which allows you to create charts, tables, and controls based on multiple data sources, including Search Console. In monitoring Search Console data in Looker Studio, embedded here, I show an example on how to enrich your data (see minute 4:42).
Check the Looker Studio help center for a complete step-by-step guide on creating data blends. Here's a summary of the main steps:
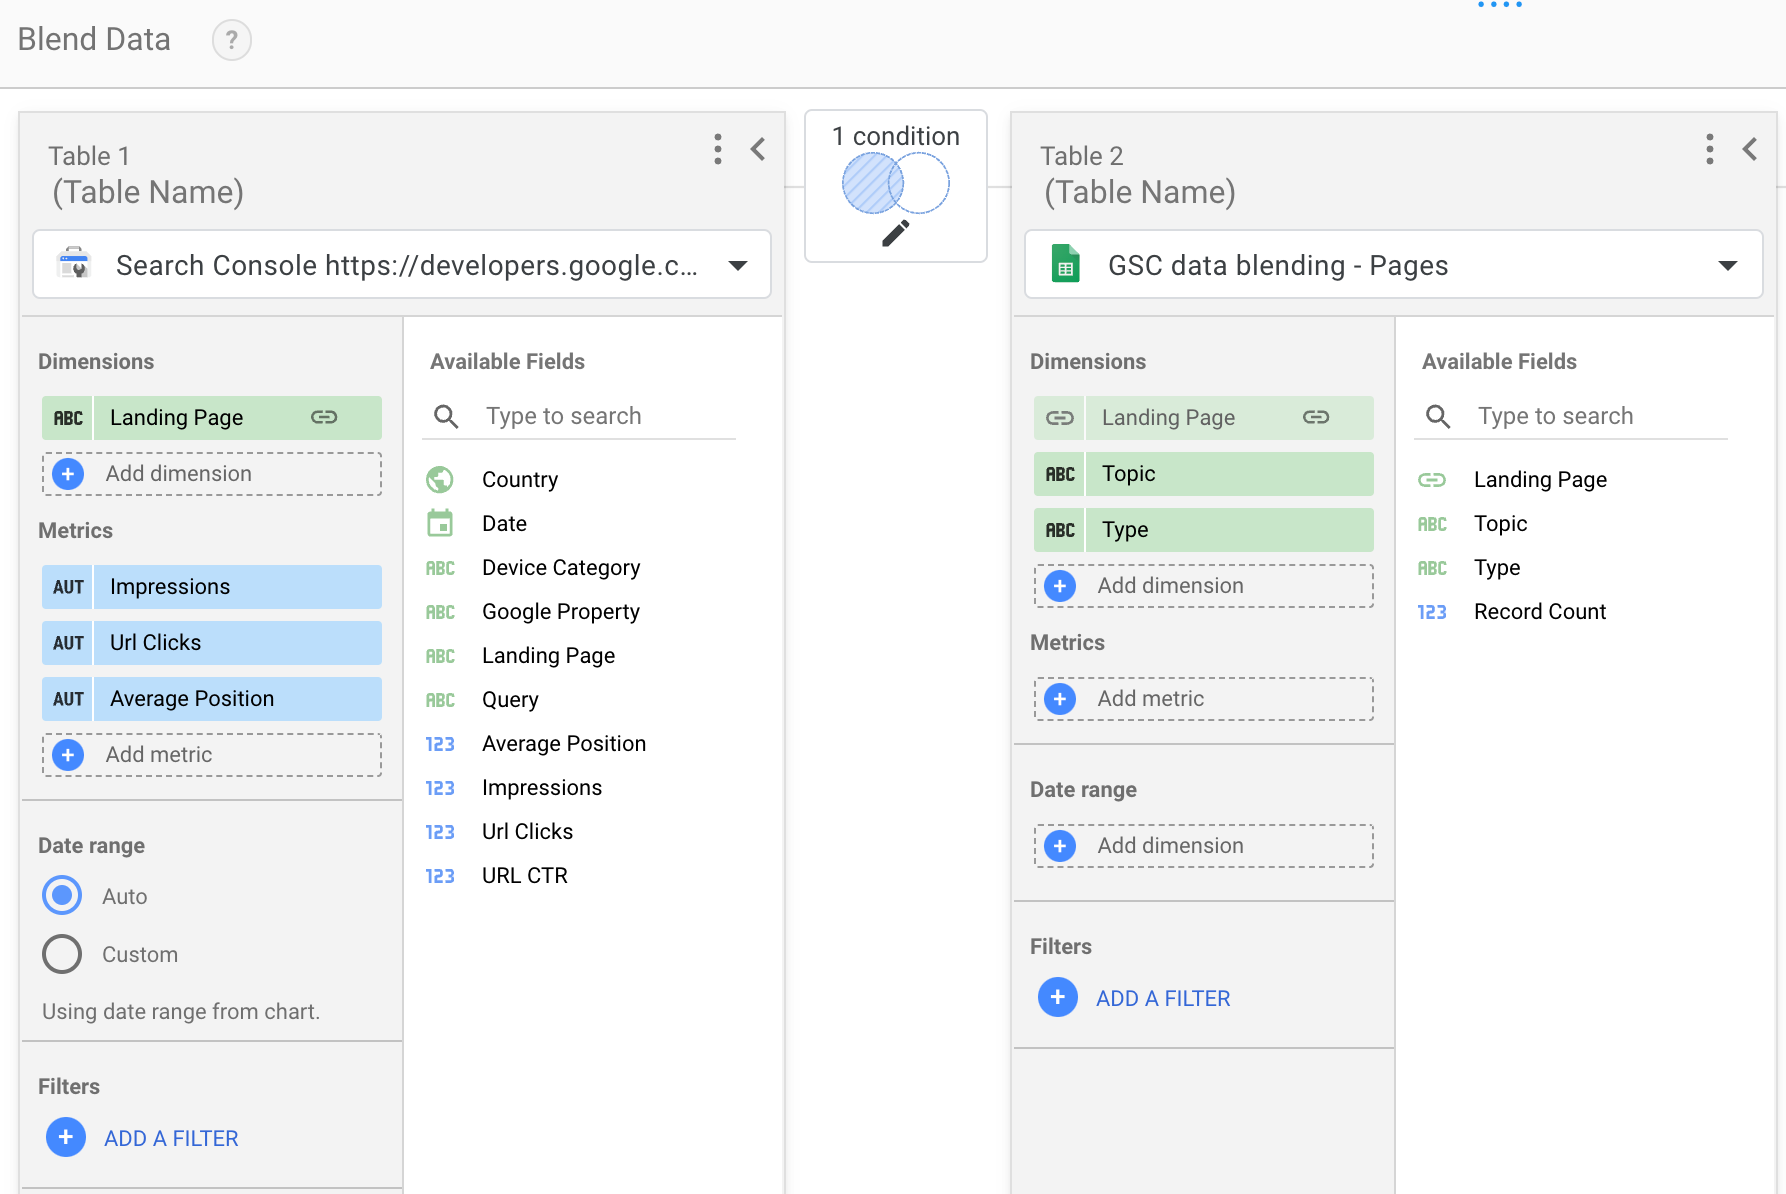
- Create data sources for both your Search Console property and the data you'd like to blend on Looker Studio.
- Navigate to a report including one of the data sources created and select a table or chart. In the setup menu you'll find an option to blend data. When you click it, you'll find an interface where you can join a table to the existing data source.
- Click to join a table and choose the data source you just created. Then click to configure the join. You'll see several join operator options, you can learn more about them in the BigQuery documentation.
- Choose matching fields to join the tables.
You can do the same for multiple tables to enrich your dashboards with information not available via Search Console, your imagination is the limit!
Here are some ideas you could use to enrich different dimensions:
- Add more information about a URL. Bring data about URLs such as page category, structured data implemented, page template, type of content, author, and more.
- Create query clusters. If you monitor queries by subject, you can join a table where you define which query belongs to which group; this will help you monitor queries based on your internal definitions.
- Track budget across countries. If you have a global audience and different budget per country, you might want to monitor your budget alongside your performance results.
As always, let us know if you have questions via the Google Search Central Community or the Looker Studio Community.