Wednesday, October 19, 2022
Google Search performance data is the most widely used data in Search Console, both through the Performance report and the Search Analytics API. This post explains in detail the data available and how Google processes it, including privacy filtering and other limitations related to serving latency, storage, and processing resources. Ever wonder how these systems work? Let's do a deep dive into them.
If you're new to Search Console, check out the introduction to Performance reports.
Search performance basics
The Performance report contains four metrics that show how your search traffic changes over time. We have an article describing how each metric is calculated, and here's a summary:
- Clicks: Count of user clicks from Google Search results to your property.
- Impressions: Count of times users saw your property on Google search results.
- CTR (Click-through rate): The click count divided by the impression count.
- Position: The average position in search results for the URL, query, or for the website in general.
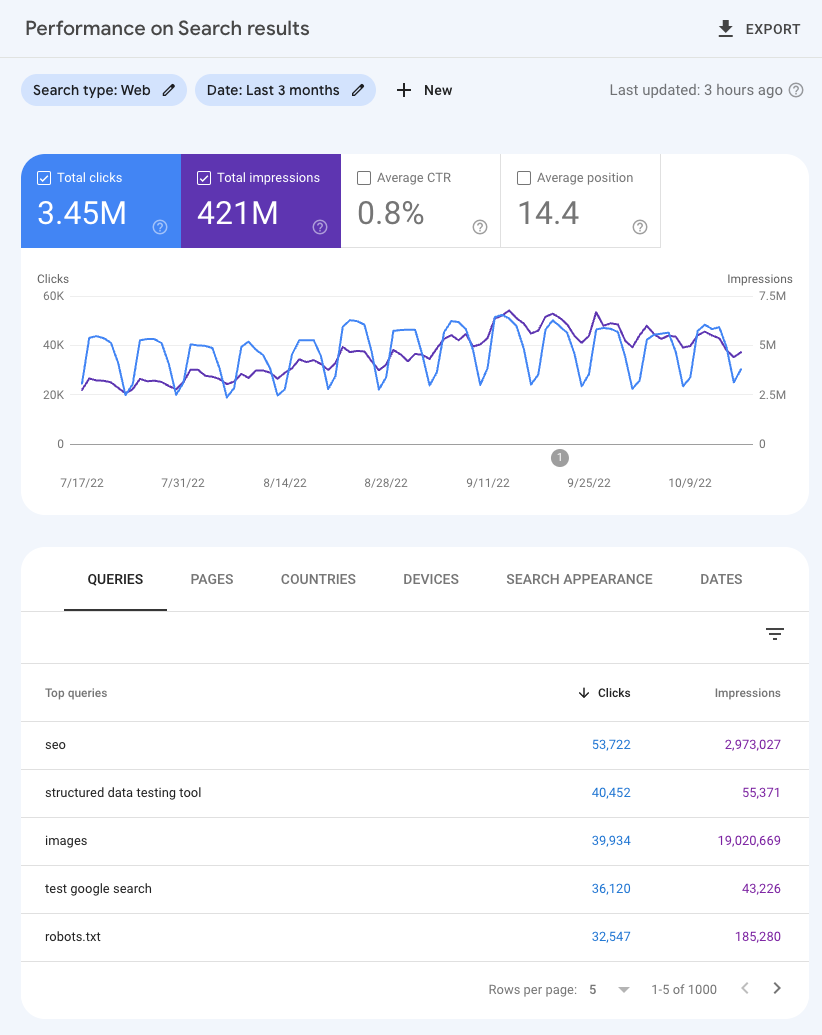
Each of those metrics can be analyzed for different dimensions. You can check how each of the queries, pages, countries, devices, or search appearances driving traffic to your website is performing.
There are many ways to access the Search performance data, including the product interface, the Search Analytics API, the Looker Studio connector, and spreadsheets (requires manual download from the interface).
If you're using the product interface, the dimensions are available through the filters or through the dimensions tables following the chart, as shown in the image below.
This data can be used to find ways to make your website more visible and ultimately get more traffic out of Google. For a sample of what type of analysis you can perform, check this sample optimization chart.
Data filtering and limits
Both the data in the report interface and the data exported are aggregated and filtered in different ways. Below are the two main limitations to the data: privacy filtering and daily data row limit.
Privacy filtering
Some queries (called anonymized queries) are not included in Search Console data to protect the privacy of the user making the query.
Anonymized queries are those that aren't issued by more than a few dozen users over a two-to-three month period. To protect privacy, the actual queries won't be shown in the Search performance data. This is why we refer to them as anonymized queries. While the actual anonymized queries are always omitted from the tables, they are included in chart totals, unless you filter by query.
Let's look at an example to make it clearer - note that this is an illustration that takes into account only privacy filtering, but daily data row limits, discussed in the next section, may also play a role, read on to learn more. Let's say the table below shows all the traffic for queries to your website, itemizing the traffic from non-anonymized queries. A typical website will generally have more than four itemized non-anonymized queries, of course, but for purposes of this example, we'll say it's just four that are itemized.
| Queries | Clicks |
| classic literature | 150 |
| poetry | 125 |
| science fiction | 100 |
| non fiction | 75 |
| Total for itemized queries | 450 |
| Total overall | 550 |
If you add up all the itemized queries, as the chart shows, there were 450 clicks. There are also 550 overall clicks to the site. That number is higher because it includes all the itemized clicks plus the clicks from anonymized queries, which aren't listed.
In practice, when using Search Console reporting, you may notice this type of discrepancy in two main ways.
- There is no row for anonymized queries in the report table or API (added here for illustration purposes), so if you sum up clicks for all the rows, you'll not find the same number of clicks as the chart totals. For example in this case you'd see 450 when you sum up the rows, but you'd see 550 in the chart totals.
- The anonymized queries are omitted whenever a filter is applied, so there will be a discrepancy
if you compare the sum of clicks in the chart totals to the sum of clicks containing
some_stringand not containingsome_string. In this case, if you use filters to include only queries that contain the word "fiction", you'll see 175 clicks, and if you exclude queries that contain the word "fiction", you'll see 275 clicks, summing up to 450 clicks, while in the chart total you'll see 550 clicks.
Daily data row limit
Due to limitations related to serving latency, storage, processing resources, and others, Search Console has a limit on the amount of data that can be displayed or exported. These limits won't affect the majority of properties in Search Console. A few very large websites can be affected by this, but even for those we believe the remaining data will be large enough to create a representative sample of data.
The maximum you can export through the Search Console user interface is 1,000 rows of data.
Currently, the upper limit for the data exported through the Search Analytics API
(and through the Looker Studio connector)
is 50,000 rows per day per site per search type, which may not be reached in all cases. The default
returned by the API will be 1,000 rows, but you can use rowLimit to increase it to 25,000
and startRow to pull the rows 25,001 to 50,000 using pagination. Check this guide to
learn how to get the available data.
For requests that don't involve query or URL dimensions, such as countries, devices, and Search Appearances, Search Console will display and export all the data.
Resources and feedback
If you'd like to learn more about the subject, read the Performance documentation. You'll find in-depth explanations about the available data, how to use the Performance report, and more details about discrepancies you may find in the charts.
If you have any questions or concerns, please reach out to us via the Google Search Central Community or on Twitter.