Stay organized with collections
Save and categorize content based on your preferences.
Thursday, October 19, 2006
The Webmaster Tools
team has a very exciting mission: we dig into our logs, find as much useful information as
possible, and pass it on to you, the webmasters. Our reward is that you more easily understand
what Google sees, and why some pages don't make it to the index.
The latest batch of information that we've put together for you is the amount of traffic between
Google and a given site. We show you the number of requests, number of kilobytes (yes, yes, I
know that tech-savvy webmasters can usually dig this out, but our new charts make it really easy
to see at a glance), and the average document download time. You can see this information in chart
form, as well as in hard numbers (the maximum, minimum, and average).
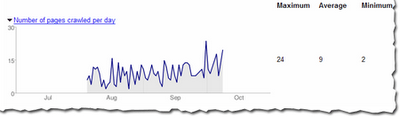
For instance, here's the number of pages Googlebot has crawled in the Webmaster Central blog over
the last 90 days. The maximum number of pages Googlebot has crawled in one day is 24 and the
minimum is 2. That makes sense, because the blog was launched less than 90 days ago, and the chart
shows that the number of pages crawled per day has increased over time. The number of pages
crawled is sometimes more than the total number of pages in the site—especially if the same
page can be accessed via several URLs. So
/search/blog/2006/10/learn-more-about-googlebots-crawl-of
and
/search/blog/2006/10/learn-more-about-googlebots-crawl-of#enhanced-image-search
are different, but point to the same page (the second points to an anchor within the page).
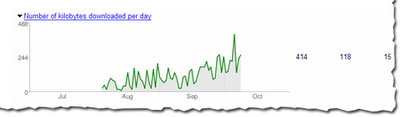
And here's the average number of kilobytes downloaded from this blog each day. As you can see, as
the site has grown over the last two and a half months, the number of average kilobytes downloaded
has increased as well.
The first two reports can help you diagnose the impact that changes in your site may have on its
coverage. If you overhaul your site and dramatically reduce the number of pages, you'll likely
notice a drop in the number of pages that Googlebot accesses.
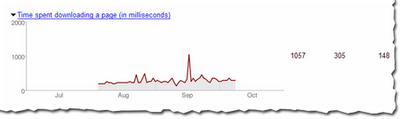
The average document download time can help pinpoint subtle networking problems. If the average
time spikes, you might have network slowdowns or bottlenecks that you should investigate. Here's
the report for this blog that shows that we did have a short spike in early September (the
maximum time was 1057 ms), but it quickly went back to a normal level, so things now look OK.
In general, the load time of a page doesn't affect its ranking, but we wanted to give this info
because it can help you spot problems. We hope you will find this data as useful as we do!
[[["Easy to understand","easyToUnderstand","thumb-up"],["Solved my problem","solvedMyProblem","thumb-up"],["Other","otherUp","thumb-up"]],[["Missing the information I need","missingTheInformationINeed","thumb-down"],["Too complicated / too many steps","tooComplicatedTooManySteps","thumb-down"],["Out of date","outOfDate","thumb-down"],["Samples / code issue","samplesCodeIssue","thumb-down"],["Other","otherDown","thumb-down"]],[],[[["\u003cp\u003eGoogle Webmaster Tools provides insights into Googlebot's interaction with your website, including traffic data and crawl statistics.\u003c/p\u003e\n"],["\u003cp\u003eThe tool displays metrics like the number of pages crawled, kilobytes downloaded, and average download time, which can help identify potential issues.\u003c/p\u003e\n"],["\u003cp\u003eSignificant changes to a website's structure, such as reducing page count, can impact Googlebot's crawl frequency.\u003c/p\u003e\n"],["\u003cp\u003eMonitoring average document download time can reveal network problems, although it doesn't directly affect search ranking.\u003c/p\u003e\n"],["\u003cp\u003eThis data aims to assist webmasters in understanding and optimizing their site's visibility on Google.\u003c/p\u003e\n"]]],["The Webmaster Tools team provides data on Google's interaction with websites. This includes the number of requests, kilobytes downloaded, and average document download time, displayed in charts and numerical form. These reports help webmasters understand Google's access patterns. The data shows the number of pages crawled by Googlebot daily, and the average kilobytes downloaded daily, reflecting site growth. Spikes in average download time can indicate networking issues. These metrics, while not directly affecting rankings, assist in troubleshooting.\n"],null,["# Googlebot activity reports\n\nThursday, October 19, 2006\n\n\nThe [Webmaster Tools](https://search.google.com/search-console)\nteam has a very exciting mission: we dig into our logs, find as much useful information as\npossible, and pass it on to you, the webmasters. Our reward is that you more easily understand\nwhat Google sees, and why some pages don't make it to the index.\n\n\nThe latest batch of information that we've put together for you is the amount of traffic between\nGoogle and a given site. We show you the number of requests, number of kilobytes (yes, yes, I\nknow that tech-savvy webmasters can usually dig this out, but our new charts make it really easy\nto see at a glance), and the average document download time. You can see this information in chart\nform, as well as in hard numbers (the maximum, minimum, and average).\n\n\nFor instance, here's the number of pages Googlebot has crawled in the Webmaster Central blog over\nthe last 90 days. The maximum number of pages Googlebot has crawled in one day is 24 and the\nminimum is 2. That makes sense, because the blog was launched less than 90 days ago, and the chart\nshows that the number of pages crawled per day has increased over time. The number of pages\ncrawled is sometimes more than the total number of pages in the site---especially if the same\npage can be accessed via several URLs. So\n\u003c/search/blog/2006/10/learn-more-about-googlebots-crawl-of\u003e\nand\n\u003c/search/blog/2006/10/learn-more-about-googlebots-crawl-of#enhanced-image-search\u003e\nare different, but point to the same page (the second points to an anchor within the page).\n\n\nAnd here's the average number of kilobytes downloaded from this blog each day. As you can see, as\nthe site has grown over the last two and a half months, the number of average kilobytes downloaded\nhas increased as well.\n\n\nThe first two reports can help you diagnose the impact that changes in your site may have on its\ncoverage. If you overhaul your site and dramatically reduce the number of pages, you'll likely\nnotice a drop in the number of pages that Googlebot accesses.\n\n\nThe average document download time can help pinpoint subtle networking problems. If the average\ntime spikes, you might have network slowdowns or bottlenecks that you should investigate. Here's\nthe report for this blog that shows that we did have a short spike in early September (the\nmaximum time was 1057 ms), but it quickly went back to a normal level, so things now look OK.\n\n\nIn general, the load time of a page doesn't affect its ranking, but we wanted to give this info\nbecause it can help you spot problems. We hope you will find this data as useful as we do!"]]