Optimiza el rendimiento del sitio web con un diagrama de burbujas de Search Console
Organiza tus páginas con colecciones
Guarda y categoriza el contenido según tus preferencias.
Miércoles 6 de abril de 2022
El análisis de datos de rendimiento de la Búsqueda siempre es un desafío, pero más aún cuando tienes muchas búsquedas de cola larga, que son más difíciles de visualizar y entender. En esta entrada, te brindamos sugerencias para ayudarte a descubrir oportunidades a fin de optimizar el rendimiento de tu sitio en la Búsqueda de Google.
Hoy analizaremos un diagrama de burbujas que te ayudará a comprender las búsquedas que tienen un buen rendimiento en tu sitio y cuáles se podrían mejorar. Primero, explicaremos los elementos principales del gráfico. También describiremos las configuraciones específicas y cómo influyen en los datos. Luego, brindaremos algunas sugerencias sobre lo que se debe buscar cuando se analizan los datos.
Comencemos con las buenas noticias: no necesitas crear el gráfico desde cero, sino que puedes usar esta plantilla, conectarte a tus datos y ajustar la configuración que desees.
Sin más preámbulos…
Comprende el gráfico
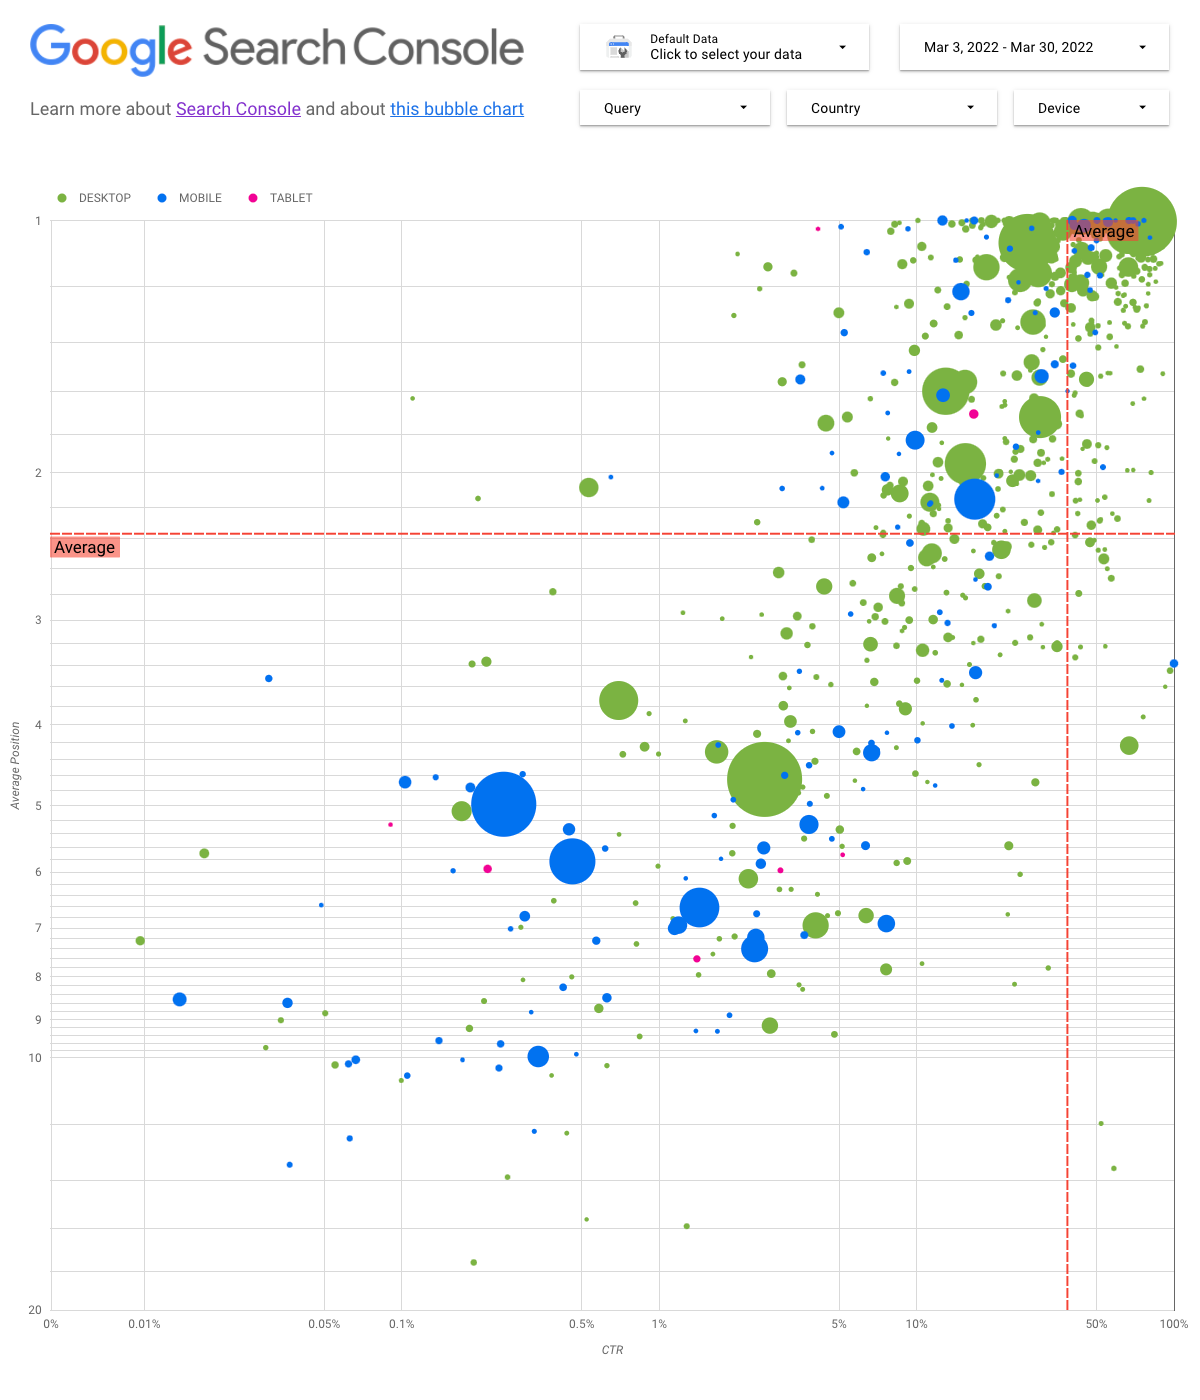
Un diagrama de burbujas es una excelente manera de visualizar datos cuando tienes varias métricas y dimensiones, ya que te permite ver las relaciones y los patrones en tus datos de manera más efectiva. En el ejemplo que se muestra aquí, puedes ver los atributos de tráfico (tasa de clics (CTR), posición promedio) y volumen (clics totales) de diferentes dimensiones (búsqueda, dispositivo) al mismo tiempo.
Analizaremos algunos de los elementos del gráfico para aclarar lo que muestra y lo que no.
Incluimos cinco opciones de personalización en el gráfico para facilitar el control efectivo de tus datos:
Control de datos: Elige la propiedad de Search Console que deseas analizar.
Período: Elige el período que deseas ver en el informe. De forma predeterminada, verás los últimos 28 días.
Búsqueda: Incluye o excluye búsquedas en las que deseas enfocarte. Puedes usar expresiones regulares de manera similar a como las usas en Search Console.
País: Incluye o excluye países.
Dispositivo: Incluye o excluye categorías de dispositivos.
Ejes
Los ejes del gráfico son Posición promedio (eje Y) y CTR del sitio (eje X), pero realizamos tres cambios significativos para hacer que el gráfico brinde información todavía más valiosa:
Invertir la dirección del eje Y: Como el eje Y muestra la posición promedio, si lo invertimos, el valor "1" queda en la parte superior.
En la mayoría de los gráficos de negocios, la mejor posición está en la esquina superior derecha, por lo que es más intuitivo invertir el eje Y cuando se usa para mostrar la posición promedio.
Escala de registro: Una escala logarítmica es una "forma de mostrar datos numéricos con un rango muy amplio de valores de manera compacta (…) mover una unidad de distancia en la escala significa que el número se multiplica por 10". El uso de la escala de registro para ambos ejes te permite comprender mejor las búsquedas que se encuentran en los extremos del gráfico (CTR muy baja, posición promedio muy baja o ambas).
Líneas de referencia: La línea de referencia es muy útil para destacar valores que están por encima o por debajo de un umbral determinado. Observa el promedio, la media o un percentil determinado a fin de identificar las desviaciones del patrón.
Burbujas
Cada burbuja del gráfico representa una única búsqueda y, para que el gráfico sea más útil, utilizamos dos propiedades de estilo:
Tamaño: Si usas la cantidad de clics como el tamaño de burbuja, podrás ver de un vistazo qué búsquedas generan la mayor parte del tráfico. Cuanto más grande sea la burbuja, mayor será el tráfico que genere la búsqueda.
Color: El uso de la categoría de dispositivo como el color de burbuja te ayuda a comprender las diferencias entre el rendimiento de la Búsqueda en dispositivos móviles y computadoras de escritorio. Puedes usar cualquier dimensión como el color, pero a medida que aumenta la cantidad de valores, se hace más difícil reconocer los patrones.
Analiza los datos
El objetivo de esta visualización es mostrar las oportunidades de optimización de búsquedas. En el gráfico, se muestra el rendimiento de la búsqueda, donde el eje Y representa la posición promedio, el eje X representa la CTR, el tamaño de la burbuja representa la cantidad total de clics y el color de burbuja representa la categoría de dispositivo.
Las líneas de referencia rojas muestran el promedio de cada eje, que divide el gráfico en cuadrantes y muestra cuatro tipos de rendimiento de la búsqueda. Es probable que tus cuadrantes se vean diferentes al que se compartió en esta entrada, ya que dependerán del modo en que se distribuyan las búsquedas del sitio.
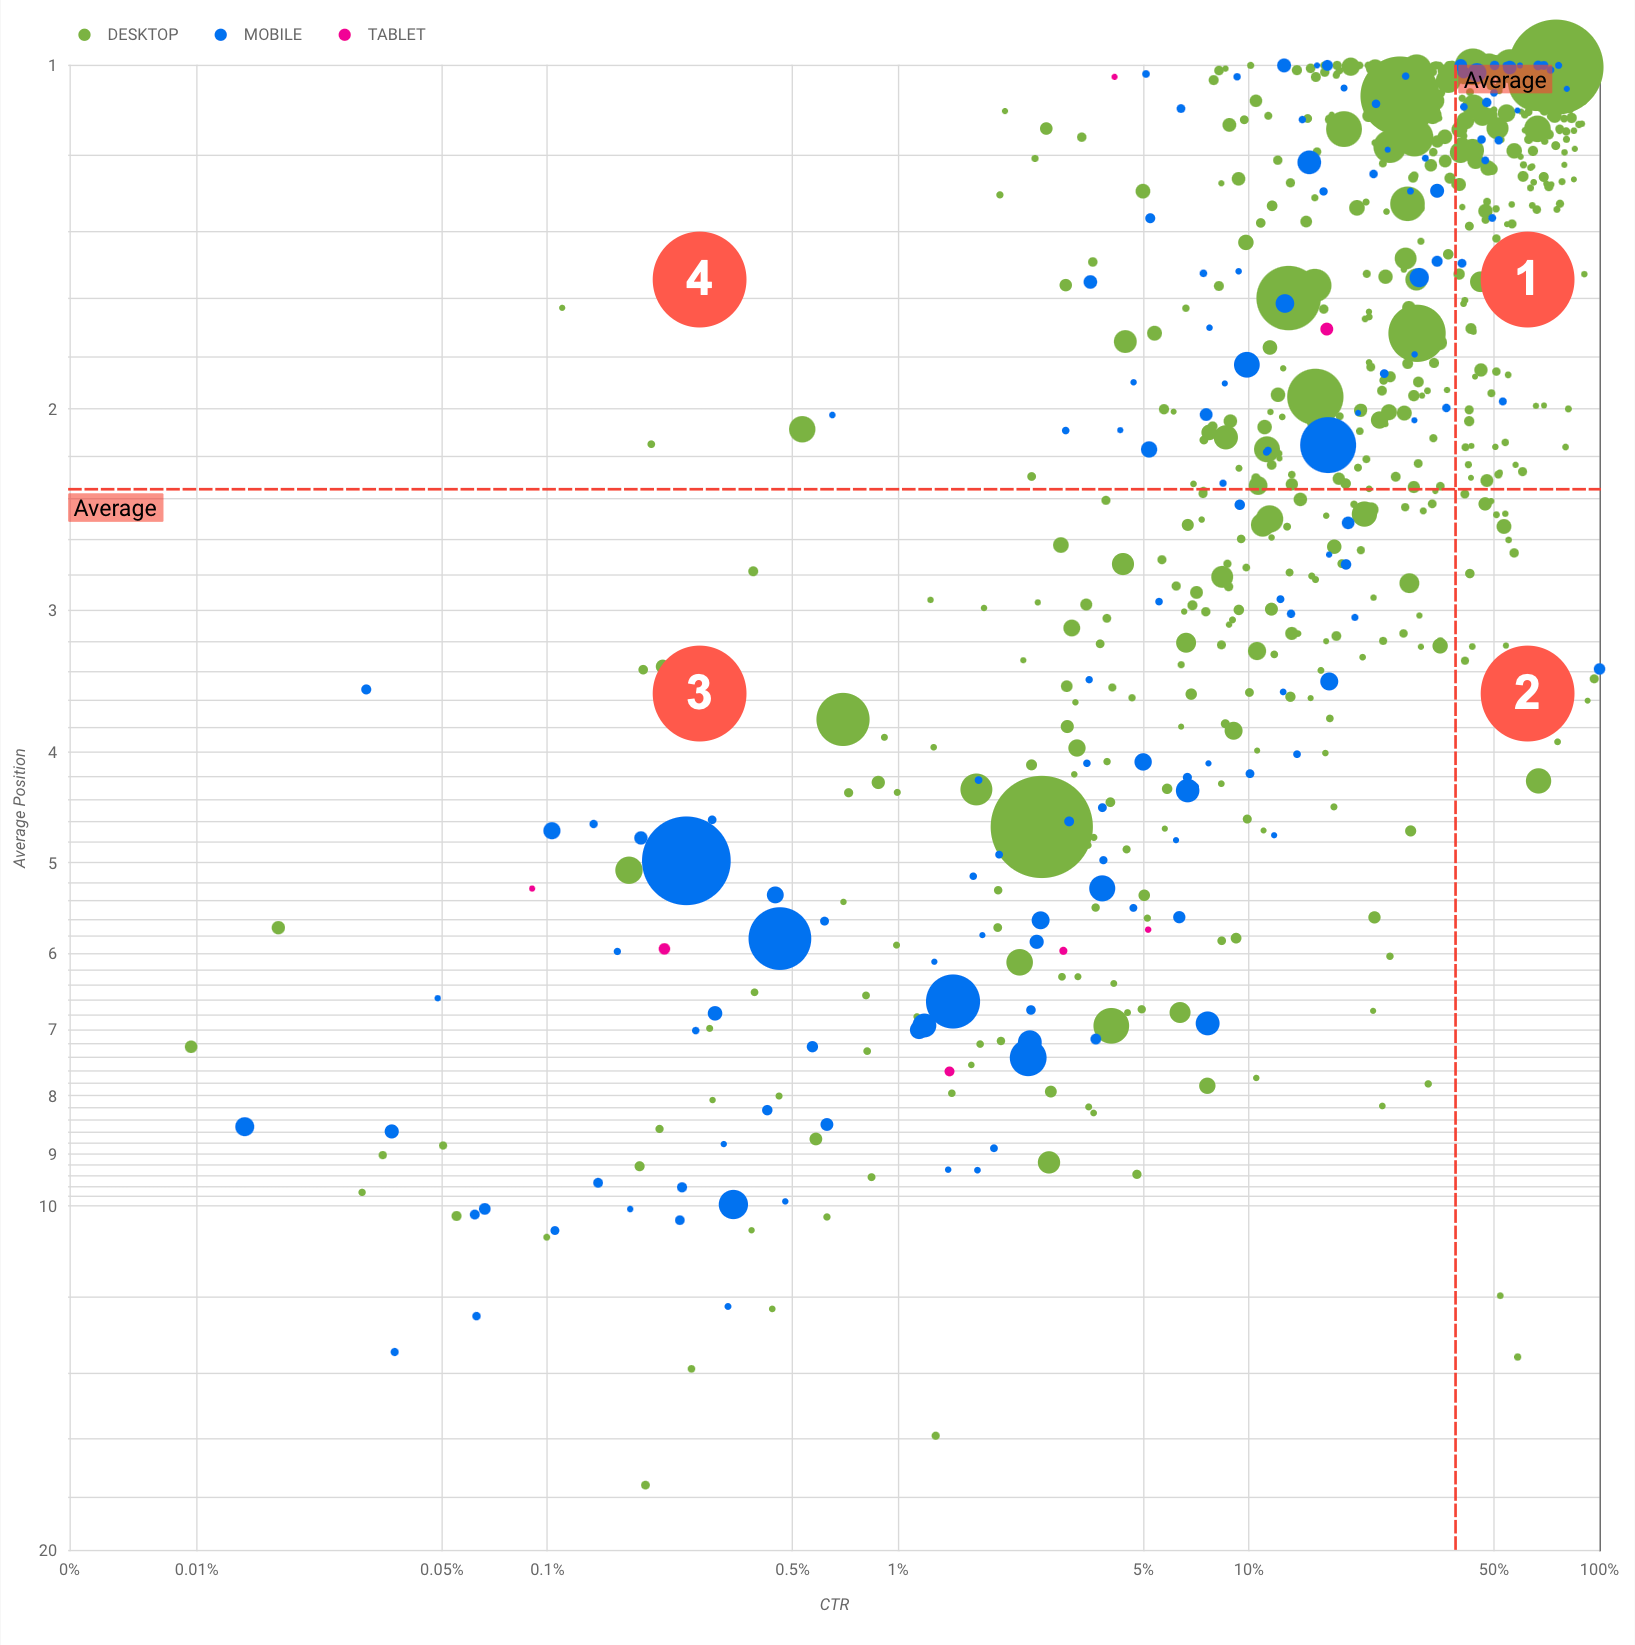
En general, en el gráfico se mostrarán cuatro grupos que puedes analizar para ayudarte a decidir dónde invertir tu tiempo cuando optimizas el rendimiento de la búsqueda.
Posición alta, CTR alta: No hay mucho para hacer, ya estás haciendo un excelente trabajo.
Posición baja, CTR alta: Las búsquedas parecen relevantes para los usuarios. Obtienen una CTR alta incluso cuando la clasificación es inferior a la de la búsqueda promedio en el sitio web. Pueden representar una contribución significativa si su posición aumenta. Invierte en optimizarlas.
Posición baja, CTR baja: Cuando observas búsquedas con una CTR baja (esta y la siguiente viñeta), es particularmente interesante observar los tamaños de burbuja para comprender aquellas que tienen una CTR baja, pero siguen generando tráfico significativo. Si bien puede parecer que las búsquedas en este cuadrante no merecen tu esfuerzo, se pueden dividir en dos grupos principales:
Consultas relacionadas: Si la búsqueda en cuestión es importante para ti, es un buen comienzo que ya aparezca en la Búsqueda.
Prioriza estas búsquedas por sobre las que no aparecen en los resultados de la Búsqueda, ya que serán más fáciles de optimizar.
Consultas no relacionadas: Si la búsqueda no está relacionada con tu sitio, tal vez sea una buena oportunidad para ajustar tu contenido a fin de enfocarte en las búsquedas que generarán tráfico relevante.
Posición alta, CTR baja: Las búsquedas podrían tener una CTR baja por varios motivos. Revisa las burbujas más grandes para encontrar indicios de lo siguiente:
Es posible que la competencia tenga lenguaje de marcado de datos estructurados y se muestre con resultados enriquecidos, lo que podría atraer a los usuarios a hacer clic en sus resultados en lugar de los tuyos. Procura habilitar las funciones de resultados de la Búsqueda de tu sitio.
Es posible que hayas optimizado o calificado "por accidente" para una búsqueda que los usuarios no buscan en relación con tu sitio.
Quizás los usuarios ya hayan encontrado la información que necesitaban, como el horario de atención, la dirección o el número de teléfono de tu empresa.
Optimiza el rendimiento de tu sitio web
Una vez que encuentres búsquedas que merezcan tu tiempo y esfuerzo, asegúrate de optimizarlas con la ayuda de la Guía de inicio de SEO. A continuación, se incluyen algunas sugerencias:
Usa elementos de encabezado para enfatizar el texto importante y ayudar a crear una estructura jerárquica para tu contenido, lo cual permitirá que los usuarios y los motores de búsqueda puedan navegar por tu documento con mayor facilidad.
Agrega lenguaje de marcado de datos estructurados para describir tu contenido a los motores de búsqueda y calificar para mostrarlo de formas útiles y atractivas en los resultados de la búsqueda.
Piensa en las palabras que los usuarios pueden usar para encontrar un fragmento de tu contenido. Puedes usar el Planificador de palabras clave de Google Ads para descubrir nuevas variantes de palabras clave y ver el volumen de búsqueda aproximado de cada una de ellas. También puedes usar Google Trends para encontrar ideas sobre temas y búsquedas en aumento relacionadas con tu sitio web.
[[["Fácil de comprender","easyToUnderstand","thumb-up"],["Resolvió mi problema","solvedMyProblem","thumb-up"],["Otro","otherUp","thumb-up"]],[["Falta la información que necesito","missingTheInformationINeed","thumb-down"],["Muy complicado o demasiados pasos","tooComplicatedTooManySteps","thumb-down"],["Desactualizado","outOfDate","thumb-down"],["Problema de traducción","translationIssue","thumb-down"],["Problema con las muestras o los códigos","samplesCodeIssue","thumb-down"],["Otro","otherDown","thumb-down"]],[],[[["\u003cp\u003eThis blog post provides tips and techniques using a bubble chart in Data Studio to analyze website search performance and identify optimization opportunities.\u003c/p\u003e\n"],["\u003cp\u003eThe bubble chart visualizes query performance by showing average position, click-through rate, total clicks (bubble size), and device category (bubble color).\u003c/p\u003e\n"],["\u003cp\u003eThe chart helps identify four types of queries: top-performing, high-CTR but low-ranking, low-CTR and low-ranking, and high-ranking but low-CTR, offering optimization strategies for each.\u003c/p\u003e\n"],["\u003cp\u003eOptimization tips include improving title tags, meta descriptions, headings, structured data, and keyword research using tools like Keyword Planner and Google Trends.\u003c/p\u003e\n"],["\u003cp\u003eUsers can leverage a provided Data Studio template to connect to their Search Console data and customize the analysis according to their needs.\u003c/p\u003e\n"]]],["This blog post explains how to use a bubble chart to analyze Google Search performance data. The chart visualizes query performance, with average position on the y-axis, CTR on the x-axis, click volume as bubble size, and device category as bubble color. Users can customize the data with filters like date range, query, country, and device. The chart identifies four query performance groups to target for optimization: high or low position and CTR. Optimization tips include improving titles, descriptions, structured data, and keyword research.\n"],null,["# Optimizing website performance with a Search Console bubble chart\n\nWednesday, April 06, 2022\n| It's been a while since we published this blog post. Some of the information may be outdated (for example, some images may be missing, and some links may not work anymore). Check out the new documentation on [improving SEO with a Search Console bubble chart](/search/docs/monitor-debug/bubble-chart-analysis).\n\n\nAnalyzing Search performance data is always a challenge, but even more so when you have plenty of long-tail queries,\nwhich are harder to visualize and understand. In this post, we'll provide tips to help you uncover opportunities to\noptimize your site's Google Search performance.\n\n\nIf you haven't read our recent posts on [connecting Search Console to Data Studio](/search/blog/2022/03/connecting-data-studio)\nand [monitoring Search traffic with Data Studio](/search/blog/2022/03/monitoring-dashboard),\nconsider checking them out to understand more about what you can do with Search Console in Data Studio.\n\n\nToday we'll discuss a [bubble chart](https://support.google.com/datastudio/answer/7207785)\nthat can help you understand which queries are performing well for your site, and which could be improved. We'll first\nexplain the main elements in the chart, describing specific settings and how they influence the data. Then we'll provide\nsome pointers on what to look for when analyzing the data.\n\n\nStarting with the good news: you don't need to build the chart from scratch, you can use\n[this template](https://datastudio.google.com/reporting/1e5b5f6a-38d7-4547-a54b-69594681a09b/page/xFbeC/preview), connect to your data,\nand tweak any settings you want.\n\n\n*Without further ado...*\n\nUnderstanding the chart\n-----------------------\n\n\nA **bubble chart** is a great visualization when you have multiple metrics and dimensions because it enables you to see\nrelationships and patterns in your data more effectively. In the example shown here, you can see traffic attributes\n(click-through rate (CTR), [average position](https://support.google.com/webmasters/answer/7042828#position))\nand volume (total [clicks](https://support.google.com/webmasters/answer/7042828#click)) for different dimensions (query, device) at the same time.\n\n\nWe'll go through some of the chart elements to clarify what it shows, and what it doesn't.\n\n### Data source\n\n\nFor this chart, we're using the **Site Impression** table available through the [Search Console data source](https://support.google.com/datastudio/answer/7314895), which includes [Search\nperformance data](https://support.google.com/webmasters/answer/7576553) aggregated by site and queries.\n\n### Filters and data controls\n\n\nIn order to make it easy for you to control your data effectively, we included five customization options in the chart:\n\n1. **[Data control](https://support.google.com/datastudio/answer/7415591)**: Choose the Search Console property you'd like to analyze.\n2. **Date range**: Choose the date range you'd like to see in the report; by default you'll see the last 28 days.\n3. **Query** : Include or exclude queries to focus on. You can [use regular\n expressions](/search/blog/2021/06/regex-negative-match) similar to the way you use them in Search Console.\n4. **Country**: Include or exclude countries.\n5. **Device**: Include or exclude device categories.\n\n### Axes\n\n\nThe axes in the chart are **Average position** (y-axis) and **Site CTR** (x-axis), but we made three significant transformations\nto make the chart more insightful:\n\n- **Reverse y-axis direction**: Since the y-axis shows average position, inverting it means that 1 is at the top. For most business charts, the best position is in the top right corner, so it is more intuitive to invert the y-axis when using it to display average position.\n- **Log scale** : A [logarithmic scale](https://en.wikipedia.org/wiki/Logarithmic_scale) is \"a way of displaying numerical data over a very wide range of values in a compact way (...) moving a unit of distance along the scale means the number has been multiplied by 10\". Using log scale for both axes enables you to have a better understanding of queries that are in the extremities of the chart (very low CTR, average position, or both).\n- **[Reference lines](https://support.google.com/datastudio/answer/9921462)**: The reference line is very helpful to highlight values that are above or below a certain threshold. Looking at the average, median, or a certain percentile can call attention to deviations from the pattern.\n\n### Bubbles\n\n\nEach bubble in the chart represents a single query, and in order to make the chart more useful, we used two\n[style properties](https://support.google.com/datastudio/answer/7207785#style-properties):\n\n- **Size**: Using the number of clicks as the bubble size helps you see in a glance which queries are driving the bulk of the traffic --- the larger the bubble the more traffic the query generates.\n- **Color**: Using the device category as the bubble color helps you understand the differences between mobile and desktop Search performance. You can use any dimension as the color, but as the number of values increases, the harder it is to recognize patterns.\n\nAnalyzing the data\n------------------\n\n\nThe goal of this visualization is to help surface query optimization opportunities. The chart shows query performance, where\nthe y-axis represents **average position** , the x-axis represents **CTR** , the bubble size represents total number of\n**clicks** , and the bubble color represents **device category**.\n\n\nThe red reference lines show the average for each of the axes, which split the chart into quadrants, showing four types of\nquery performance. Your quadrants are likely to look different than the one shared in this post; they'll depend on how your\nsite queries are distributed.\n\n\nIn general, the chart will show four groups you can analyze to help you decide where to invest your time when optimizing your query performance.\n\n1. **Top position, high CTR**: There's not much you need to do for those; you're doing a great job already.\n2. **Low position, high CTR** : Those queries seem relevant to users; they get a high CTR even when ranking lower than the average query on your website. They could represent a significant contribution if their position goes up --- *invest in optimizing them!*\n3. **Low position, low CTR** : When looking at queries with low CTR (this and the next bullet), it's especially interesting to look at the bubble sizes to understand which queries have a low CTR but are still driving significant traffic. While the queries in this quadrant might seem unworthy of your effort, they can be divided into two main groups:\n - *Related queries*: If the query in question is important to you, it's a good start to have it appearing in Search already. Prioritize these queries over queries that are not appearing in Search results at all, as they'll be easier to optimize.\n - *Unrelated queries*: If the query is unrelated to your site, maybe it's a good opportunity to fine-tune your content to focus on queries that will bring relevant traffic.\n4. **Top position, low CTR** : Those queries might have a low CTR for various reasons. You should check the largest bubbles to find signs of the following:\n - Your competitors may have structured data markup and are showing up with rich results, which might attract users to click their results instead of yours. Consider [enabling Search result\n features for your site](/search/docs/appearance/search-result-features).\n - You may have optimized, or be \"accidentally\" ranking, for a query that users are not interested in relation to your site.\n - Users may have already found the information they needed, for example your company's opening hours, address, or phone number.\n\nOptimizing your website performance\n-----------------------------------\n\n\nOnce you find queries that are worth the time and effort, make sure to optimize for them with the help of the\n[SEO starter guide](/search/docs/fundamentals/seo-starter-guide). Here are some tips:\n\n- Ensure that your [`title`](/search/docs/appearance/title-link#page-titles) elements, [description `meta` tags](/search/docs/appearance/snippet#meta-descriptions), and `alt` attributes are descriptive, specific, and accurate.\n- Use heading elements to emphasize important text and help create a hierarchical structure for your content, making it easier for users and search engines to navigate through your document.\n- Add [structured data markup](/search/docs/appearance/structured-data/intro-structured-data) to describe your content to search engines and be eligible to display your content in useful (and eye-catching) ways in search results.\n- Think about the words that a user might search for to find a piece of your content. You can use the [Keyword Planner](https://ads.google.com/home/tools/keyword-planner/) provided by Google Ads to help you discover new keyword variations and see the approximate search volume for each keyword. You can also use [Google Trends](https://trends.google.com/trends/) to find ideas from rising topics and queries related to your website.\n\nFeedback\n--------\n\n\nAs always, let us know if you have any questions through the [Google\nSearch Central Community](https://support.google.com/webmasters/threads?thread_filter=(category:search_console)) or the [Data Studio Community](https://support.google.com/datastudio/threads?thread_filter=(category:connect_to_data)).\nAlso, if you're on Twitter, make sure to [follow us](https://twitter.com/googlesearchc), as we'll announce future posts over there.\n\nPosted by [Daniel Waisberg](https://www.danielwaisberg.com), Search Advocate"]]