Datasets tagged publisher-dataset in Earth Engine
Оптимизируйте свои подборки
Сохраняйте и классифицируйте контент в соответствии со своими настройками.
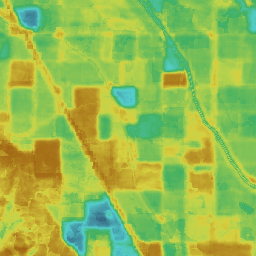
Модель вероятности какао 2025a
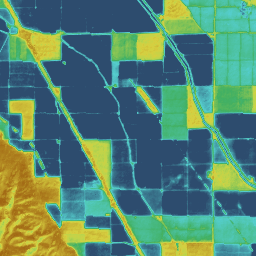
Данная коллекция изображений предоставляет приблизительную вероятность того, что рассматриваемая область занята данным товаром, для каждого пикселя. Оценки вероятности представлены с разрешением 10 метров и были получены с помощью модели машинного обучения. Подробности см. в технической документации по программе Forest Data Partnership…
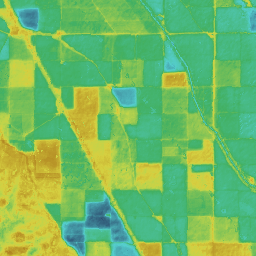
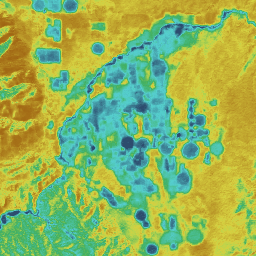
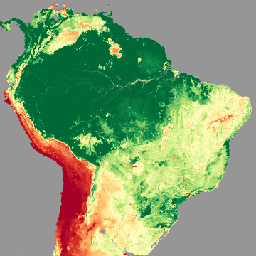
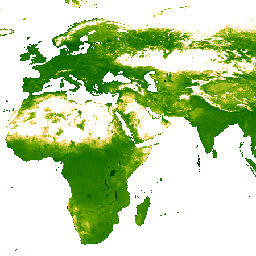
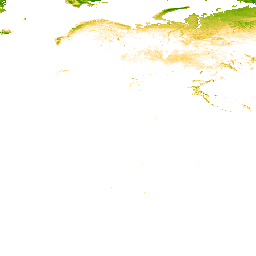
EVI: Расширенный индекс растительности, заполненный в рамках проекта «Атлас малярии» (8 ежедневных измерений на расстоянии 1 км).
Исходным набором данных для этого продукта «Улучшенный индекс растительности» (EVI) являются скорректированные по BRDF изображения MODIS (MCD43B4), в которых были заполнены пропуски с использованием подхода, описанного в работе Weiss et al. (2014), для устранения отсутствующих данных, вызванных такими факторами, как облачность. После заполнения пропусков данные были обрезаны до…
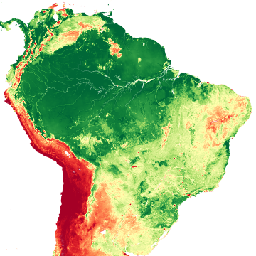
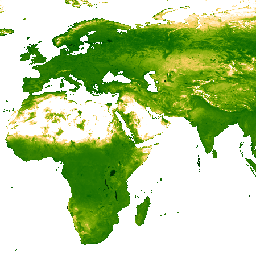
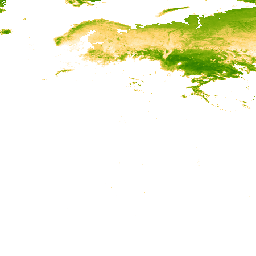
EVI: Расширенный индекс растительности, заполненный в рамках проекта «Атлас малярии» (ежегодно, 1 км²)
Исходным набором данных для этого продукта «Улучшенный индекс растительности» (EVI) являются скорректированные по BRDF изображения MODIS (MCD43B4), в которых были заполнены пропуски с использованием подхода, описанного в работе Weiss et al. (2014), для устранения отсутствующих данных, вызванных такими факторами, как облачность. После заполнения пропусков данные были обрезаны до…
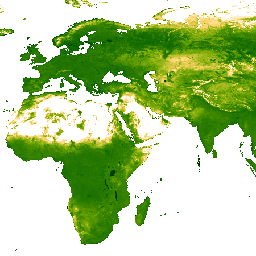
EVI: Расширенный индекс растительности, заполненный в рамках проекта «Атлас малярии» (ежемесячно, 1 км²)
Исходным набором данных для этого продукта «Улучшенный индекс растительности» (EVI) являются скорректированные по BRDF изображения MODIS (MCD43B4), в которых были заполнены пропуски с использованием подхода, описанного в работе Weiss et al. (2014), для устранения отсутствующих данных, вызванных такими факторами, как облачность. После заполнения пропусков данные были обрезаны до…
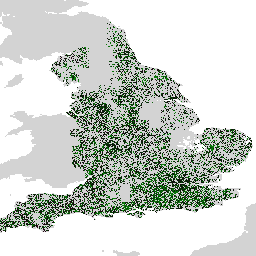
Набор данных Farmscapes 2020 предоставляет карты вероятности высокого разрешения (25 см) для трех ключевых полуприродных объектов сельскохозяйственных ландшафтов Англии: живых изгородей, лесных массивов и каменных стен. Этот набор данных был разработан в сотрудничестве с Центром восстановления природы Леверхулма в Оксфорде и служит базовым для применения…
Векторизованные изображения фермерских пейзажей 2020 года
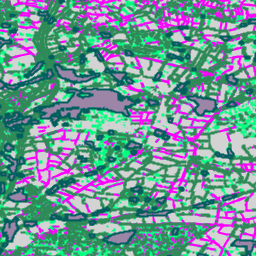
Это векторизованная версия растрового набора данных Farmscapes 2020. Она содержит полигональные геометрии, представляющие собой мелкомасштабные полуестественные элементы ландшафта (в частности, живые изгороди, лесные массивы и каменные стены) на сельскохозяйственных угодьях Англии. Этот набор данных был разработан в сотрудничестве с Оксфордским центром восстановления природы имени Леверхулма…
Это изображение содержит оценку для каждого пикселя (в диапазоне [0, 1]), указывающую, занята ли область пикселя нетронутым лесом в 2020 году. Эти оценки представлены с разрешением 30 метров и были получены с помощью метода конвергенции данных, объединяющего несколько лесных массивов…
Набор данных Forest Typology (ForTy) v1 представляет собой глобальную карту вероятности для каждого класса с разрешением 10 м, охватывающую все территории суши между 65° южной широты и 84° северной широты за 2020 год. Шестиклассовая типология соответствует определениям ФАО и Регламента ЕС о вырубке лесов (EUDR): Класс 1…
Этот набор данных содержит глобальные ежегодные карты преобладающих классов пастбищных угодий (возделываемых и естественных/полуестественных) за период с 2000 по 2022 год с пространственным разрешением 30 м. Созданный в рамках инициативы Land & Carbon Lab Global Pasture Watch, набор данных охватывает все типы землепользования, содержащие не менее…
GPW Ежегодные вероятности развития культивируемых пастбищ v1
Этот набор данных содержит глобальные ежегодные карты вероятности площади обрабатываемых пастбищ с 2000 по 2022 год с пространственным разрешением 30 м. Созданный в рамках инициативы Land & Carbon Lab Global Pasture Watch, набор данных охватывает все типы землепользования, содержащие не менее 30% засушливых земель…
GPW Ежегодные вероятности существования естественных/полуестественных лугов, версия 1
Этот набор данных содержит глобальные ежегодные карты вероятности наличия естественных/полуестественных пастбищ с 2000 по 2022 год с пространственным разрешением 30 м. Созданный в рамках инициативы Land & Carbon Lab Global Pasture Watch, набор данных охватывает любые типы землепользования, содержащие не менее 30% засушливых земель…
GPW Ежегодная численность поголовья скота, скорректированная по FAOSTAT, версия 1
Этот набор данных содержит информацию о численности поголовья скота в мире за период с 2000 по 2022 год с пространственным разрешением 1 км. Созданный в рамках инициативы Global Pasture Watch лаборатории Land & Carbon Lab, текущий набор данных содержит глобальные прогнозы численности поголовья, скорректированные на основе национальной статистики FAOSTAT. Набор данных основан на крупнейшем известном…
Этот набор данных содержит глобальные медианные значения высоты растительности с 2000 года с пространственным разрешением 30 м. Созданный в рамках инициативы Global Pasture Watch лаборатории Land & Carbon Lab, этот набор данных предоставляет медианные значения высоты растительности (50-й процентиль) в глобальном масштабе с пространственным разрешением 30 м, начиная с 2000 года. Набор данных основан на…
Этот набор данных содержит глобальные некалиброванные данные о валовой первичной продуктивности (ВПП) на основе дистанционного зондирования Земли с 2000 года с пространственным разрешением 30 м. Созданный в рамках инициативы Land & Carbon Lab Global Pasture Watch, текущий набор данных предоставляет значения ВПП (валовой первичной продуктивности) в глобальном масштабе с пространственным разрешением 30 м, начиная с 2000 года. Значения ВПП…
Ежегодная площадь мангровых лесов в мире (1984-2023 гг.)
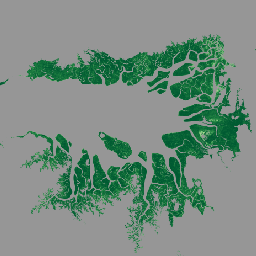
Набор данных CGMD-Extent30 (Continuous Global Mangrove Dynamics-Annual Mangrove Extent at 30-m resolution) предоставляет данные о ежегодной площади мангровых зарослей в мире с 1984 по 2023 год. Набор данных распространяется в виде единой коллекции объектов Earth Engine FeatureCollection, где каждый объект представляет собой отображенный полигон мангровых зарослей за конкретный год. Набор данных…
Глобальная годовая доля площади, покрывающей мангровые заросли (1984-2023 гг.)
Этот набор данных предоставляет глобальные ежегодные данные о доле растительного покрова мангровых лесов (FCC) с пространственным разрешением 30 м за период с 1984 по 2023 год для поддержки крупномасштабного анализа долгосрочной динамики мангровых лесов, включая деградацию и восстановление растительного покрова, оценку «голубого углерода» и мониторинг прибрежных экосистем. FCC количественно определяет долю каждого спутника Landsat…
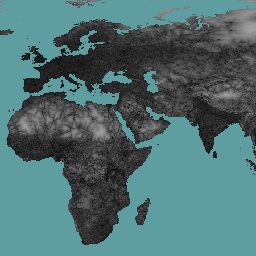
Дневная температура поверхности земли (LST Day): данные проекта «Атлас малярии» (8 ежедневных измерений на расстоянии 1 км).
Дневная температура поверхности земли (LST) получена из продуктов MODIS MOD11A2 v6.1 с разрешением около 1 км. 8-дневные композиты переводятся в градусы Цельсия, а затем заполняются пропуски с использованием подхода, описанного в работе Weiss et al (2014), для устранения недостающих данных, вызванных такими факторами, как облачность. …
Дневная температура поверхности земли (по данным проекта «Атлас малярии»): заполненные пробелы в данных о дневной температуре поверхности земли (годовые значения на 1 км)
Дневная температура поверхности земли (LST) получена из продуктов MODIS MOD11A2 v6.1 с разрешением около 1 км. 8-дневные композиты переводятся в градусы Цельсия, а затем заполняются пропуски с использованием подхода, описанного в работе Weiss et al (2014), для устранения недостающих данных, вызванных такими факторами, как облачность. …
Дневная температура поверхности земли (LST Day): данные проекта «Атлас малярии» (Malaria Atlas Project), заполненные пробелами в данных о дневной температуре поверхности земли (по 1 км в месяц).
Дневная температура поверхности земли (LST) получена из продуктов MODIS MOD11A2 v6.1 с разрешением около 1 км. 8-дневные композиты переводятся в градусы Цельсия, а затем заполняются пропуски с использованием подхода, описанного в работе Weiss et al (2014), для устранения недостающих данных, вызванных такими факторами, как облачность. …
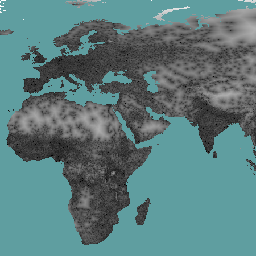
Ночное время по местному времени: данные проекта «Атлас малярии» о ночной температуре поверхности земли (8 ежедневных измерений на расстоянии 1 км).
Ночные значения температуры поверхности земли (LST) получены из продуктов MODIS MOD11A2 v6.1 с разрешением около 1 км. 8-дневные композиты преобразуются в градусы Цельсия, а затем заполняются пробелы с использованием подхода, описанного в работе Weiss et al (2014), для устранения недостающих данных, вызванных такими факторами, как облачность. …
Ночное время по LST: Проект «Атлас малярии». Заполненные пробелы данными о ночной температуре поверхности земли (годовые значения на 1 км).
Ночные значения температуры поверхности земли (LST) получены из продуктов MODIS MOD11A2 v6.1 с разрешением около 1 км. 8-дневные композиты преобразуются в градусы Цельсия, а затем заполняются пробелы с использованием подхода, описанного в работе Weiss et al (2014), для устранения недостающих данных, вызванных такими факторами, как облачность. …
Ночное время по LST: Проект «Атлас малярии». Заполненные пробелы данными о ночной температуре поверхности земли (по 1 км в месяц).
Ночные значения температуры поверхности земли (LST) получены из продуктов MODIS MOD11A2 v6.1 с разрешением около 1 км. 8-дневные композиты преобразуются в градусы Цельсия, а затем заполняются пробелы с использованием подхода, описанного в работе Weiss et al (2014), для устранения недостающих данных, вызванных такими факторами, как облачность. …
MAPL-EMIT: Моделирование увеличения концентрации метана и вероятности образования шлейфа выбросов
Набор данных MAPL-EMIT (Methane Analysis and Plume Localization with EMIT) предоставляет карты высокого разрешения (60 м) концентрации метана (CH₄) и вероятности образования шлейфов, полученные на основе данных об излучении, зарегистрированных прибором EMIT (Earth Surface Mineral Dust Source Investigation), которые были созданы и опубликованы в рамках…
Набор данных Methane Analysis and Plume Localization with EMIT (MAPL-EMIT) предоставляет карты комплексов метановых (CH₄) шлейфов с высоким разрешением (60 м) и местоположения источников шлейфов, полученные на основе данных об излучении, зарегистрированных прибором Earth Surface Mineral Dust Source Investigation (EMIT). Точечные источники выбросов метана являются основным фактором…
Проект «Атлас малярии»: Доступность городов, 2015 год.
На этой глобальной карте доступности указано время в пути по суше до ближайшего густонаселенного района для всех территорий, расположенных между 85 градусами северной широты и 60 градусами южной широты, за условный 2015 год. Густонаселенными районами считаются смежные территории с плотностью населения 1500 и более жителей на квадратный километр или…
Проект «Атлас малярии»: Доступность медицинской помощи, 2019 год.
Эта глобальная карта доступности показывает время в пути по суше (в минутах) до ближайшей больницы или клиники для всех районов между 85 градусами северной широты и 60 градусами южной широты за 2019 год. Масштабные работы по сбору данных ведутся OpenStreetMap, Google Maps и академическими исследователями…
Проект «Атлас малярии»: Доступность медицинской помощи 2019 (только пешком)
На этой глобальной карте доступности указано время в пути по суше (в минутах) до ближайшей больницы или клиники для всех районов между 85 градусами северной широты и 60 градусами южной широты за условный 2019 год. Данные основаны на времени в пути "только пешком", с использованием немоторизованных видов транспорта…
Проект «Атлас малярии»: Глобальная поверхность трения 2015
«Поверхность трения 2019». Эта глобальная поверхность трения отображает скорость передвижения по суше для всех пикселей суши между 85 градусами северной широты и 60 градусами южной широты за номинальный 2015 год. Эта карта была создана в результате сотрудничества между проектом «Атлас малярии» Оксфордского университета (MAP), Google и другими организациями.
Проект «Атлас малярии»: Глобальная поверхность трения 2019
Эта глобальная поверхность трения отображает скорость передвижения по суше для всех пикселей суши между 85 градусами северной широты и 60 градусами южной широты за номинальный 2019 год. Эта карта была создана в результате сотрудничества между MAP (Оксфордский университет), Telethon Kids Institute (Перт, Австралия), Google и…
Проект «Атлас малярии»: Глобальная поверхность трения 2019 (только ходьба)
Эта глобальная поверхность трения отображает скорость передвижения по суше для всех пикселей суши между 85 градусами северной широты и 60 градусами южной широты за номинальный 2019 год. Эта поверхность основана на скорости передвижения «только пешком», используя только немоторизованные виды транспорта. Эта карта была создана в результате…
MapBiomas: Землепользование и земельный покров - Боливия, версия 1.0
Набор данных MapBiomas о землепользовании и земельном покрове (LULC) для Боливии ежегодно создается проектом MapBiomas с использованием спутниковых снимков Landsat и методов классификации на основе машинного обучения. Набор данных предоставляет согласованные ежегодные карты земельного покрова с разрешением 30 метров, охватывающие период с 1985 по 2024 год. Боливия…
MapBiomas Землепользование и земельный покров - Бразилия V1.0
Ежегодно проект MapBiomas выпускает набор данных о землепользовании и земельном покрове (LULC) для Бразилии, используя спутниковые снимки Landsat и методы классификации на основе машинного обучения. Набор данных предоставляет согласованные, тематически детализированные карты с разрешением 30 метров, охватывающие несколько десятилетий и обновляемые каждый год. Каждое изображение…
MapBiomas Землепользование и земельный покров - Эквадор V1.0
Набор данных MapBiomas о землепользовании и земельном покрове (LULC) для Эквадора ежегодно создается проектом MapBiomas с использованием спутниковых снимков Landsat и методов классификации на основе машинного обучения. Набор данных предоставляет согласованные ежегодные карты земельного покрова с разрешением 30 метров, охватывающие период с 1985 по 2024 год. Эквадор…
Этот набор данных содержит геопространственные данные о суммарной молярной доле метана в атмосфере сухого воздуха, "XCH4", измеренной с помощью спектрометра MethaneAIR. XCH4 определяется как общее количество метана в атмосфере (число молекул), деленное на общее количество...
Этот набор данных содержит информацию об обнаружении источников выбросов метана с высокой интенсивностью (кг/час) в 13 районах добычи нефти, газа и угля от Колорадо, Нью-Мексико и Техаса на западе до Пенсильвании, Огайо и Западной Вирджинии на востоке, а также в трех городских районах (Нью-Йорк, …).
Предварительная версия MethaneSAT L3 Concentration Public Preview V1.0.0
Этот предварительный набор данных «Public Preview» предоставляет геопространственные данные об усредненной по столбу атмосферы мольной доле метана в сухом воздухе, «XCH4», полученные на основе измерений с помощью спектрометра MethaneSAT. XCH4 определяется как общее количество молекул в столбе атмосферы (число молекул над единицей площади поверхности)…
Предварительная версия MethaneSAT L4 Area Sources V1.0.0
Модель выбросов из рассредоточенных районов все еще находится в разработке и не является окончательным вариантом. Этот предварительный набор данных «Public Preview» предоставляет высокоточные данные о выбросах метана из рассредоточенных источников. Эти данные о выбросах получены из Аппалачского, Пермского и Уинтского бассейнов…
Предварительная версия 2.0.0 площадных источников метана MethaneSAT L4
Модель выбросов из рассредоточенных районов все еще находится в разработке и не является окончательным вариантом. Этот предварительный набор данных «Public Preview» предоставляет высокоточные данные о выбросах метана из рассредоточенных источников. Эти новые измерения демонстрируют важность количественной оценки общих выбросов метана с высокой точностью…
Предварительная версия MethaneSAT L4 Point Sources Public Preview V1.0.0
Этот предварительный набор данных, доступный для публичного просмотра, предоставляет высокоточные данные о выбросах метана из дискретных точечных источников. Эти потоки выбросов метана были получены с использованием системы обнаружения точечных источников и количественной оценки выбросов, специально разработанной для использования высокого пространственного разрешения, широкого пространственного охвата и высокой точности…
Высота верхней части растительного покрова над голой землей (модель высоты растительного покрова; CHM). Модель CHM получается из облака точек NEON LiDAR и генерируется путем создания непрерывной поверхности оценок высоты растительного покрова по всей пространственной области съемки LiDAR. …
Смоделированная концентрация азота в кроне откалибрована с использованием данных о химическом составе листьев растений, полученных с помощью прибора NEON, и спрогнозирована с использованием направленного отражения поверхности L1, полученного с помощью спектрометра NEON Imaging Spectrometer (NIS). Диапазоны включают: 1) процентное содержание азота в кроне, 2) неопределенность модели содержания азота в кроне, 3) результат классификации модели хвои и нехвои и…
Цифровые модели поверхности (ЦМП) и рельефа (ЦМР), полученные на основе данных лидара NEON. ЦМП: Характеристики поверхности (топографическая информация с учетом растительности и искусственных сооружений). ЦМР: Высота над уровнем моря (топографическая информация без учета растительности и искусственных сооружений). Изображения представлены в метрах над уровнем моря…
Изображения, полученные с помощью камеры NEON RGB.
Изображения с камеры высокого разрешения в формате RGB (красный-зеленый-синий), ортофотоснимки которой объединяются в мозаику и выводятся на фиксированную равномерную пространственную сетку с использованием метода ближайшего соседа; пространственное разрешение составляет 0,1 м. Цифровая камера является частью комплекса приборов на борту бортовой наблюдательной платформы NEON (AOP), который также включает в себя…
Данные NEON AOP Surface Bidirectional Reflectance представляют собой гиперспектральный продукт VSWIR (видимый и коротковолновый инфракрасный диапазон), содержащий 426 полос, охватывающих длины волн от ~380 нм до 2510 нм. Коэффициент отражения масштабирован в 10000 раз. Длины волн в диапазонах 1340-1445 нм и 1790-1955 нм установлены на…
Данные NEON AOP Surface Directional Reflectance представляют собой гиперспектральный продукт VSWIR (видимый и коротковолновый инфракрасный диапазон), содержащий 426 полос, охватывающих длины волн от ~380 нм до 2510 нм. Коэффициент отражения масштабирован в 10000 раз. Длины волн в диапазонах 1340-1445 нм и 1790-1955 нм установлены на…
Базовые карты программы спутниковых данных NICFI для мониторинга тропических лесов – Африка
Эта коллекция изображений предоставляет доступ к спутниковым данным высокого разрешения, полученным в ходе мониторинга тропиков, с основной целью сокращения и обращения вспять утраты тропических лесов, содействия борьбе с изменением климата, сохранения биоразнообразия, содействия восстановлению и улучшению лесных массивов, а также содействия устойчивому развитию…
Базовые карты программы спутниковых данных NICFI для мониторинга тропических лесов — Северная и Южная Америка
Эта коллекция изображений предоставляет доступ к спутниковым данным высокого разрешения, полученным в ходе мониторинга тропиков, с основной целью сокращения и обращения вспять утраты тропических лесов, содействия борьбе с изменением климата, сохранения биоразнообразия, содействия восстановлению и улучшению лесных массивов, а также содействия устойчивому развитию…
Базовые карты программы спутниковых данных NICFI для мониторинга тропических лесов — Азия
Эта коллекция изображений предоставляет доступ к спутниковым данным высокого разрешения, полученным в ходе мониторинга тропиков, с основной целью сокращения и обращения вспять утраты тропических лесов, содействия борьбе с изменением климата, сохранения биоразнообразия, содействия восстановлению и улучшению лесных массивов, а также содействия устойчивому развитию…
Карта «Естественные леса мира 2020» представляет собой глобальную карту вероятности наличия естественных лесов в 2020 году с разрешением 10 метров. Она была разработана для поддержки таких инициатив, как Регламент Европейского союза о борьбе с обезлесением (EUDR) и других усилий по сохранению и мониторингу лесов. Карта…
Обратная модель обмена между атмосферой и сушей / Дезагрегация обратной модели обмена между атмосферой и сушей (ALEXI/DisALEXI). Модель DisALEXI была портирована в Google Earth Engine как часть фреймворка OpenET. Базовая структура модели ALEXI/DisALEXI описана Андерсоном и др. (2012, 2018). Модель эвапотранспирации (ET) ALEXI использует временные параметры…
Ежемесячный отчет OpenET Ensemble об эвапотранспирации, версия 2.0
Набор данных OpenET включает спутниковые данные об общем количестве воды, переносимой с поверхности земли в атмосферу в процессе эвапотранспирации (ЭТ). OpenET предоставляет данные об ЭТ из множества моделей, основанных на спутниковых данных, а также вычисляет единое «ансамблевое значение» на основе…
Лаборатория реактивного движения Пристли-Тейлора (PT-JPL). Основная формулировка модели PT-JPL в рамках OpenET не изменилась по сравнению с первоначальной формулировкой, подробно описанной в работе Фишера и др. (2008). Однако были внесены улучшения и обновления в входные данные модели и интеграцию по времени для PT-JPL, чтобы учесть…
Спутниковая система поддержки управления орошением (SIMS). Модель спутниковой поддержки управления орошением (SIMS) НАСА изначально была разработана для поддержки спутникового картирования коэффициентов урожайности и эвапотранспирации (ET) на орошаемых землях, а также для расширения доступа к этим данным для использования в планировании орошения и региональной оценке…
Оперативная упрощенная модель баланса поверхностной энергии (SSEBop). Модель оперативной упрощенной модели баланса поверхностной энергии (SSEBop), разработанная Сенаем и др. (2013, 2017), представляет собой упрощенную модель поверхностной энергии, основанную на тепловом эффекте, для оценки фактического испарения на основе принципов спутниковой психрометрии (Сенай, 2018). В реализации OpenET SSEBop используется…
Оперативная упрощенная модель баланса поверхностной энергии (SSEBop). Модель оперативного упрощенного баланса поверхностной энергии (SSEBop) (Senay et al., 2013; 2023) представляет собой термический подход к оценке фактического испарения (ET) с использованием принципов спутниковой психрометрии (Senay, 2018). Как одна из основных моделей в…
Реализация в Google Earth Engine модели картирования испарения с высоким разрешением с внутренней калибровкой (eeMETRIC). eeMETRIC использует усовершенствованные алгоритмы и процесс METRIC, описанные Алленом и др. (2007; 2015) и Алленом и др. (2013b), где наблюдается особая взаимосвязь между температурой воздуха у поверхности земли…
Реализация модели алгоритма баланса поверхностной энергии для суши (SEBAL) в Google Earth Engine. Обзор текущей версии geeSEBAL можно найти в работе Laipelt et al. (2021), которая основана на оригинальных алгоритмах, разработанных Bastiaanssen et al. (1998). OpenET geeSEBAL…
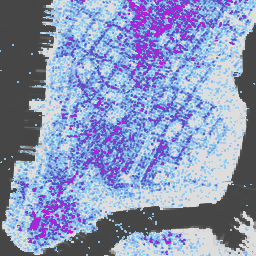
Тема Overture Maps Places содержит более 64 миллионов точечных изображений реальных объектов: предприятий, школ, больниц, религиозных организаций, достопримечательностей, горных вершин и многого другого. Каждая запись о месте включает координаты местоположения, названия, категории, контактную информацию (веб-сайты, социальные сети, электронная почта, телефоны), информацию о бренде, адреса и…
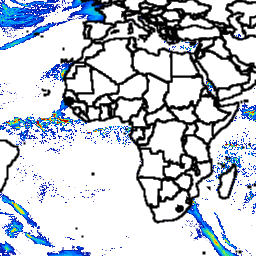
Ойя: квазиглобальные оценки количества осадков на расстоянии 5 км
Oya — это квазиглобальный набор данных для оценки количества осадков с высоким разрешением, полученный на основе наблюдений с геостационарных (GEO) спутников. Модель Oya использует весь спектр видимых и инфракрасных (VIS-IR) каналов созвездия геостационарных спутников, включая GOES-16/18, Meteosat-9/10 и Himawari-8/9, для генерации оценок количества осадков, охватывающих…
PML_V2.2a: Совмещенное моделирование эвапотранспирации и валового первичного продукта (версия MODIS)
Данный набор данных создан Лабораторией крупномасштабной гидрологии, которая специализируется на развитии глобальных и региональных исследований круговорота воды путем синтеза данных наблюдений Земли из различных источников с моделированием на основе процессов. Продукт PML-V2.2a (версия MODIS) предоставляет данные о глобальном наземном испарении (ET) и валовой первичной продуктивности (GPP) на…
PML_V2.2a: Совмещенное моделирование эвапотранспирации и валового первичного продукта (версия VIIRS)
Данный набор данных создан Лабораторией крупномасштабной гидрологии, которая специализируется на развитии глобальных и региональных исследований круговорота воды путем синтеза многоисточниковых наблюдений Земли с моделированием на основе процессов. Продукт PML-V2.2a (VIIRS Edition) предоставляет данные о глобальном наземном испарении (ET) и валовой первичной продуктивности (GPP) на…
Данная коллекция изображений предоставляет приблизительную вероятность того, что рассматриваемая область занята данным товаром, для каждого пикселя. Оценки вероятности представлены с разрешением 10 метров и были получены с помощью модели машинного обучения. Подробности см. в технической документации по программе Forest Data Partnership…
This image collection provides estimated per-pixel probability that the underlying area is occupied by the commodity. The probability estimates are provided at 10 meter resolution, and have been generated by a machine learning model. For details, see the technical documentation on the Forest Data Partnership …
SCANFI: the Spatialized CAnadian National Forest Inventory data product1.2
This data publication contains a set of 30m resolution raster files representing 2020 Canadian wall-to-wall maps of broad land cover type, forest canopy height, degree of crown closure and aboveground tree biomass, along with species composition of several major tree species. The Spatialized CAnadian National …
These species distribution model outputs, developed by Google in collaboration with QCIF and EcoCommons, represent estimates of species' relative occurrence likelihoods (ie, higher values indicate a higher likelihood that the species would be detected at a location, for a given survey methodology and given survey …
TCB: Malaria Atlas Project Gap-Filled Tasseled Cap Brightness (8-Daily 1km)
This gap-filled Tasseled Cap Brightness (TCB) dataset was created by applying the tasseled-cap equations defined in Lobser and Cohen (2007) to MODIS BRDF-corrected imagery (MCD43B4). The resulting data were gap-filled using the approach outlined in Weiss et al. (2014) to eliminate missing data caused by …
TCB: Malaria Atlas Project Gap-Filled Tasseled Cap Brightness (Annual 1km)
This gap-filled Tasseled Cap Brightness (TCB) dataset was created by applying the tasseled-cap equations defined in Lobser and Cohen (2007) to MODIS BRDF-corrected imagery (MCD43B4). The resulting data were gap-filled using the approach outlined in Weiss et al. (2014) to eliminate missing data caused by …
TCB: Malaria Atlas Project Gap-Filled Tasseled Cap Brightness (Monthly 1km)
This gap-filled Tasseled Cap Brightness (TCB) dataset was created by applying the tasseled-cap equations defined in Lobser and Cohen (2007) to MODIS BRDF-corrected imagery (MCD43B4). The resulting data were gap-filled using the approach outlined in Weiss et al. (2014) to eliminate missing data caused by …
TCW: Malaria Atlas Project Gap-Filled Tasseled Cap Wetness (8-Daily 1km)
This gap-filled Tasseled Cap Wetness (TCW) dataset was created by applying the tasseled-cap equations defined in Lobser and Cohen (2007) to MODIS BRDF-corrected imagery (MCD43B4). The resulting data were gap-filled using the approach outlined in Weiss et al. (2014) to eliminate missing data caused by …
TCW: Malaria Atlas Project Gap-Filled Tasseled Cap Wetness (Annual 1km)
This gap-filled Tasseled Cap Wetness (TCW) dataset was created by applying the tasseled-cap equations defined in Lobser and Cohen (2007) to MODIS BRDF-corrected imagery (MCD43B4). The resulting data were gap-filled using the approach outlined in Weiss et al. (2014) to eliminate missing data caused by …
TCW: Malaria Atlas Project Gap-Filled Tasseled Cap Wetness (Monthly 1km)
This gap-filled Tasseled Cap Wetness (TCW) dataset was created by applying the tasseled-cap equations defined in Lobser and Cohen (2007) to MODIS BRDF-corrected imagery (MCD43B4). The resulting data were gap-filled using the approach outlined in Weiss et al. (2014) to eliminate missing data caused by …
USFS Landscape Change Monitoring System v2025-11 (CONUS and OCONUS)
This product is part of the Landscape Change Monitoring System (LCMS) data suite. It shows LCMS-modeled change, land cover, and/or land use classes for each year and covers the Conterminous United States (CONUS) as well as areas outside the CONUS (OCONUS) including Alaska (AK), Puerto …
The Tree Canopy Cover (TCC) data suite, produced by the United States Department of Agriculture, Forest Service (USFS), are annual remote sensing-based map outputs spanning from 1985-2025. These data support the National Land Cover Database (NLCD) project, which is managed by the US Geological Survey …
WDKBA: World Database of Key Biodiversity Areas (KBAs) - March 2026
If you are interested in accessing the KBA dataset please complete the KBA data request form which will allow access directly in GEE once approved. Key Biodiversity Areas (KBAs) are 'sites contributing significantly to the global persistence of biodiversity', in terrestrial, freshwater and marine ecosystems. …
WRI/Google DeepMind Global Drivers of Forest Loss 2001-2022 v1.0
This dataset maps the dominant driver of tree cover loss from 2001-2022 globally at 1 km resolution. Produced by the World Resources Institute (WRI) and Google DeepMind, the data were developed using a global neural network model (ResNet) trained on a set of samples collected …
WRI/Google DeepMind Global Drivers of Forest Loss 2001-2023 v1.1
This dataset maps the dominant driver of tree cover loss from 2001-2023 globally at 1 km resolution. Produced by the World Resources Institute (WRI) and Google DeepMind, the data were developed using a global neural network model (ResNet) trained on a set of samples collected …
WRI/Google DeepMind Global Drivers of Forest Loss 2001-2024 v1.2
This dataset maps the dominant driver of tree cover loss from 2001-2024 globally at 1 km resolution. Produced by the World Resources Institute (WRI) and Google DeepMind, the data were developed using a global neural network model (ResNet) trained on a set of samples collected …
WRI/Google DeepMind Global Drivers of Forest Loss 2001-2025 v1.3
This dataset maps the dominant driver of tree cover loss from 2001-2025 globally at 1 km resolution. Produced by the World Resources Institute (WRI) and Google DeepMind, the data were developed using a global neural network model (ResNet) trained on a set of samples collected …
WeatherNext 2 — это экспериментальный набор данных глобальных среднесрочных ансамблевых прогнозов погоды, созданный рабочей версией генеративной модели погоды на основе функциональной сети Google DeepMind. Экспериментальный набор данных включает данные в реальном времени и исторические данные. Данные в реальном времени — это любые данные, относящиеся ко времени, которое…
WeatherNext 2 Mean — это среднее значение 64 ансамблей экспериментального набора данных глобальных среднесрочных ансамблевых прогнозов погоды, созданных рабочей версией генеративной модели погоды на основе функциональной сети Google DeepMind. Для получения набора данных, содержащего все члены ансамбля, см. (не среднее) значение WeatherNext 2…
Набор данных WeatherNext 3 (0,05°) — это экспериментальный набор данных глобальных среднесрочных ансамблевых прогнозов погоды от Google DeepMind и Google Research, созданный на основе рабочей версии модели, описанной в статье: WeatherNext 3: Повышение разрешения и производительности глобальных моделей погоды с использованием необработанных данных наблюдений. Доступ к данным…
Набор данных WeatherNext 3 (0,1°) — это экспериментальный набор данных глобальных среднесрочных ансамблевых прогнозов погоды от Google DeepMind и Google Research, созданный на основе рабочей версии модели, описанной в статье: WeatherNext 3: Повышение разрешения и производительности глобальных моделей погоды с использованием необработанных данных наблюдений. Доступ к данным…
This image collection provides estimated per-pixel probability that the underlying area is occupied by the commodity. The probability estimates are provided at 10 meter resolution, and have been generated by a machine learning model. For details, see the technical documentation on the Forest Data Partnership …
EVI: Malaria Atlas Project Gap-Filled Enhanced Vegetation Index (8-Daily 1km)
The underlying dataset for this Enhanced Vegetation Index (EVI) product is MODIS BRDF-corrected imagery (MCD43B4), which was gap-filled using the approach outlined in Weiss et al. (2014) to eliminate missing data caused by factors such as cloud cover. After gap-filling the data was clipped to …
EVI: Malaria Atlas Project Gap-Filled Enhanced Vegetation Index (Annual 1km)
The underlying dataset for this Enhanced Vegetation Index (EVI) product is MODIS BRDF-corrected imagery (MCD43B4), which was gap-filled using the approach outlined in Weiss et al. (2014) to eliminate missing data caused by factors such as cloud cover. After gap-filling the data was clipped to …
EVI: Malaria Atlas Project Gap-Filled Enhanced Vegetation Index (Monthly 1km)
The underlying dataset for this Enhanced Vegetation Index (EVI) product is MODIS BRDF-corrected imagery (MCD43B4), which was gap-filled using the approach outlined in Weiss et al. (2014) to eliminate missing data caused by factors such as cloud cover. After gap-filling the data was clipped to …
The Farmscapes 2020 dataset provides high-resolution (25cm) probability maps for three key semi-natural features within England's agricultural landscapes: hedgerows, woodland, and stone walls. This dataset was developed in collaboration with the Leverhulme Centre for Nature Recovery at Oxford to serve as a baseline for applications …
This is the vectorised version of the Farmscapes 2020 raster dataset. It provides polygon geometries representing fine-scale semi-natural landscape features (specifically hedgerows, woodland, and stone walls) across England's agricultural landscapes. This dataset was developed in collaboration with the Oxford Leverhulme Centre for Nature Recovery to …
This image provides a per-pixel score (in [0, 1]) that indicates whether the pixel area is occupied by undisturbed forest in year 2020. These scores are provided at 30 meter resolution, and have been generated by a convergence of evidence approach to combining multiple forest …
The Forest Typology (ForTy) v1 dataset consists of a global per-class probability map at 10 m resolution covering all land areas between 65°S and 84°N latitude for the year 2020. The six-class typology is aligned with FAO and EU Deforestation Regulation (EUDR) definitions: Class 1 …
This dataset provides global annual dominant class maps of grasslands (cultivated and natural/semi-natural) from 2000 to 2022 at 30-m spatial resolution. Produced by the Land & Carbon Lab Global Pasture Watch initiative, the mapped grassland extent includes any land cover type, which contains at least …
GPW Annual Probabilities of Cultivated Grasslands v1
This dataset provides global annual probability maps of cultivated grassland from 2000 to 2022 at 30-m spatial resolution. Produced by the Land & Carbon Lab Global Pasture Watch initiative, the mapped grassland extent includes any land cover type, which contains at least 30% of dry …
GPW Annual Probabilities of Natural/Semi-natural Grasslands v1
This dataset provides global annual probability maps of natural/semi-natural grassland from 2000 to 2022 at 30-m spatial resolution. Produced by the Land & Carbon Lab Global Pasture Watch initiative, the mapped grassland extent includes any land cover type, which contains at least 30% of dry …
This dataset provides global livestock headcount from 2000 to 2022 at 1-km spatial resolution. Produced by the Land & Carbon Lab's Global Pasture Watch initiative, the current dataset provides global headcount predictions adjusted to FAOSTAT national statistics. The dataset is based on the largest known …
This dataset provides global median vegetation height from 2000 at 30-m spatial resolution. Produced by the Land & Carbon Lab's Global Pasture Watch initiative, this dataset provides median vegetation height values (50th percentile) globally at 30-m spatial resolution from 2000 onwards. The dataset is based …
This dataset provides global uncalibrated EO-based Gross Primary Productivity from 2000 at 30-m spatial resolution. Produced by the Land & Carbon Lab Global Pasture Watch initiative, the current dataset provides Gross Primary Productivity (GPP) values globally at 30-m spatial resolution from 2000 onwards. GPP values …
The CGMD-Extent30 (Continuous Global Mangrove Dynamics-Annual Mangrove Extent at 30-m resolution) dataset provides global annual mangrove extent from 1984 to 2023. The dataset is distributed as a single Earth Engine FeatureCollection, with each feature representing a mapped mangrove polygon for a specific year. The dataset …
Global Annual Mangrove Fractional Canopy Cover (1984-2023)
This dataset provides global annual mangrove fractional canopy cover (FCC) at 30-m spatial resolution from 1984 to 2023 to support large-scale analyses of long-term mangrove dynamics, including canopy degradation and recovery, blue carbon assessment, and coastal ecosystem monitoring. FCC quantifies the proportion of each Landsat …
LST Day: Malaria Atlas Project Gap-Filled Daytime Land Surface Temperature (8-Daily 1km)
Daytime Land Surface Temperature (LST) are derived from the ~1km MODIS MOD11A2 v6.1 products. The 8-daily composites are converted to degrees Celsius and then gap-filled using the approach outlined in Weiss et al (2014) to eliminate missing data caused by factors such as cloud cover. …
LST Day: Malaria Atlas Project Gap-Filled Daytime Land Surface Temperature (Annual 1km)
Daytime Land Surface Temperature (LST) are derived from the ~1km MODIS MOD11A2 v6.1 products. The 8-daily composites are converted to degrees Celsius and then gap-filled using the approach outlined in Weiss et al (2014) to eliminate missing data caused by factors such as cloud cover. …
LST Day: Malaria Atlas Project Gap-Filled Daytime Land Surface Temperature (Monthly 1km)
Daytime Land Surface Temperature (LST) are derived from the ~1km MODIS MOD11A2 v6.1 products. The 8-daily composites are converted to degrees Celsius and then gap-filled using the approach outlined in Weiss et al (2014) to eliminate missing data caused by factors such as cloud cover. …
LST Night: Malaria Atlas Project Gap-Filled Nighttime Land Surface Temperature (8-Daily 1km)
Nighttime Land Surface Temperature (LST) are derived from the ~1km MODIS MOD11A2 v6.1 products. The 8-daily composites are converted to degrees Celsius and then gap-filled using the approach outlined in Weiss et al (2014) to eliminate missing data caused by factors such as cloud cover. …
LST Night: Malaria Atlas Project Gap-Filled Nighttime Land Surface Temperature (Annual 1km)
Nighttime Land Surface Temperature (LST) are derived from the ~1km MODIS MOD11A2 v6.1 products. The 8-daily composites are converted to degrees Celsius and then gap-filled using the approach outlined in Weiss et al (2014) to eliminate missing data caused by factors such as cloud cover. …
LST Night: Malaria Atlas Project Gap-Filled Nighttime Land Surface Temperature (Monthly 1km)
Nighttime Land Surface Temperature (LST) are derived from the ~1km MODIS MOD11A2 v6.1 products. The 8-daily composites are converted to degrees Celsius and then gap-filled using the approach outlined in Weiss et al (2014) to eliminate missing data caused by factors such as cloud cover. …
MAPL-EMIT: Modeled Methane Enhancement and Plume Probability
The Methane Analysis and Plume Localization with EMIT (MAPL-EMIT) enhancements dataset provides high-resolution (60m) methane (CH₄) enhancement maps and plume probabilities derived from radiance data captured by the Earth Surface Mineral Dust Source Investigation (EMIT) instrument which were generated and released as part of the …
The Methane Analysis and Plume Localization with EMIT (MAPL-EMIT) dataset provides high-resolution (60m) methane (CH₄) plume complex maps and plume source locations derived from radiance data captured by the Earth Surface Mineral Dust Source Investigation (EMIT) instrument. Methane point-source emissions are a major driver of …
Malaria Atlas Project Accessibility to Cities 2015
This global accessibility map enumerates land-based travel time to the nearest densely-populated area for all areas between 85 degrees north and 60 degrees south for a nominal year 2015. Densely-populated areas are defined as contiguous areas with 1,500 or more inhabitants per square kilometer or …
Malaria Atlas Project Accessibility to Healthcare 2019
This global accessibility map enumerates land-based travel time (in minutes) to the nearest hospital or clinic for all areas between 85 degrees north and 60 degrees south for a nominal year 2019. Major data collection efforts underway by OpenStreetMap, Google Maps, and academic researchers have …
Malaria Atlas Project Accessibility to Healthcare 2019 (Walking Only)
This global accessibility map enumerates land-based travel time (in minutes) to the nearest hospital or clinic for all areas between 85 degrees north and 60 degrees south for a nominal year 2019. This surface is based on "walking-only" travel time, using non-motorized means of transportation …
Malaria Atlas Project Global Friction Surface 2015
Friction Surface 2019". This global friction surface enumerates land-based travel speed for all land pixels between 85 degrees north and 60 degrees south for a nominal year 2015. This map was produced through a collaboration between the University of Oxford Malaria Atlas Project (MAP), Google, …
Malaria Atlas Project Global Friction Surface 2019
This global friction surface enumerates land-based travel speed for all land pixels between 85 degrees north and 60 degrees south for a nominal year 2019. This map was produced through a collaboration between MAP (University of Oxford), Telethon Kids Institute (Perth, Australia), Google, and the …
Malaria Atlas Project Global Friction Surface 2019 (Walking Only)
This global friction surface enumerates land-based travel speed for all land pixels between 85 degrees north and 60 degrees south for a nominal year 2019. This surface is based on "walking-only" travel speed, using non-motorized means of transportation only. This map was produced through a …
MapBiomas Land Use and Land Cover (LULC) dataset for Bolivia is produced annually by the MapBiomas Project using Landsat satellite imagery and machine learning classification techniques. The dataset provides consistent annual land cover maps at 30-meter resolution covering the period from 1985 to 2024. Bolivia's …
MapBiomas Land Use and Land Cover (LULC) dataset for Brazil is produced annually by the MapBiomas Project using Landsat satellite imagery and machine learning classification techniques. The dataset provides consistent, thematically detailed maps at 30-meter resolution, covering multiple decades and updated each year. Each image …
MapBiomas Land Use and Land Cover (LULC) dataset for Ecuador is produced annually by the MapBiomas Project using Landsat satellite imagery and machine learning classification techniques. The dataset provides consistent annual land cover maps at 30-meter resolution covering the period from 1985 to 2024. Ecuador's …
This dataset provides geospatial data for the total column dry air mole fraction of methane in the atmosphere, "XCH4", as observed by the MethaneAIR imaging spectrometer. XCH4 is defined as the total column amount (number of molecules) of methane ("CH4") divided by the total amount …
This dataset provides data for high-emitting methane point source detections (kg/hr) over 13 oil and gas or coal extraction areas from Colorado, New Mexico, and Texas in the west to Pennsylvania, Ohio, and West Virginia in the east, plus three urban areas (New York City, …
This early "Public Preview" dataset provides geospatial data for the column-averaged dry-air mole fraction of methane in the atmosphere, "XCH4", retrieved from measurements by the MethaneSAT imaging spectrometer. XCH4 is defined as the total column amount (number of molecules above a unit surface area) of …
The dispersed area emissions model is still in development and not representative of a final product. This early "Public Preview" dataset provides high precision data for methane emissions from dispersed area sources. These emissions data come from the Appalachian, Permian, and Uinta basins in the …
The dispersed area emissions model is still in development and not representative of a final product. This early "Public Preview" dataset provides high precision data for methane emissions from dispersed area sources. These novel measurements demonstrate the importance of quantifying total methane emissions with high …
This early "Public Preview" dataset provides high precision data for methane emissions from discrete point sources. These methane emission fluxes were produced using a point source detection and emissions quantification framework specialized to exploit the high spatial resolution, wide spatial coverage, and high precision of …
Height of the top of canopy above bare earth (Canopy Height Model; CHM). The CHM is derived from the NEON LiDAR point cloud and is generated by creating a continuous surface of canopy height estimates across the entire spatial domain of the LiDAR survey. The …
Modelled canopy nitrogen concentration calibrated with NEON plant foliar chemistry observations and predicted with L1 surface directional reflectance, derived from the NEON Imaging Spectrometer (NIS). Bands include 1) canopy nitrogen percent, 2) canopy nitrogen model uncertainty, 3) classification result for needle vs. non-needle model and …
Digital models of the surface (DSM) and terrain (DTM) derived from NEON LiDAR data. DSM: Surface features (topographic information with vegetation and man-made structures present). DTM: Bare earth elevation (topographic information with vegetation and man-made structures removed). Images are given in meters above mean sea …
High resolution Red-Green-Blue (RGB) orthorectified camera images mosaicked and output onto a fixed, uniform spatial grid using nearest-neighbor resampling; spatial resolution is 0.1 m. The digital camera is part of a suite of instruments on the NEON Airborne Observation Platform (AOP) that also includes a …
The NEON AOP Surface Bidirectional Reflectance is a hyperspectral VSWIR (visible to shortwave infrared) data product, containing 426 bands spanning wavelengths from ~380 nm to 2510 nm. Reflectance is scaled by a factor of 10000. Wavelengths between 1340-1445 nm and 1790-1955 nm are set to …
The NEON AOP Surface Directional Reflectance is a hyperspectral VSWIR (visible to shortwave infrared) data product, containing 426 bands spanning wavelengths from ~380 nm to 2510 nm. Reflectance is scaled by a factor of 10000. Wavelengths between 1340-1445 nm and 1790-1955 nm are set to …
NICFI Satellite Data Program Basemaps for Tropical Forest Monitoring - Africa
This image collection provides access to high-resolution satellite monitoring of the tropics for the primary purpose of reducing and reversing the loss of tropical forests, contributing to combating climate change, conserving biodiversity, contributing to forest regrowth, restoration and enhancement, and facilitating sustainable development, all of …
NICFI Satellite Data Program Basemaps for Tropical Forest Monitoring - Americas
This image collection provides access to high-resolution satellite monitoring of the tropics for the primary purpose of reducing and reversing the loss of tropical forests, contributing to combating climate change, conserving biodiversity, contributing to forest regrowth, restoration and enhancement, and facilitating sustainable development, all of …
NICFI Satellite Data Program Basemaps for Tropical Forest Monitoring - Asia
This image collection provides access to high-resolution satellite monitoring of the tropics for the primary purpose of reducing and reversing the loss of tropical forests, contributing to combating climate change, conserving biodiversity, contributing to forest regrowth, restoration and enhancement, and facilitating sustainable development, all of …
Natural Forests of the World 2020, provides a global map of natural forest probability for the year 2020 at a 10-meter resolution. It was developed to support initiatives like the European Union's Deforestation Regulation (EUDR) and other efforts for forest conservation and monitoring. The map …
Atmosphere-Land Exchange Inverse / Disaggregation of the Atmosphere-Land Exchange Inverse (ALEXI/DisALEXI). DisALEXI was ported to Google Earth Engine as part of the OpenET framework. The baseline ALEXI/DisALEXI model structure is described by Anderson et al. (2012, 2018). The ALEXI evapotranspiration (ET) model specifically uses time …
The OpenET dataset includes satellite-based data on the total amount of water that is transferred from the land surface to the atmosphere through the process of evapotranspiration (ET). OpenET provides ET data from multiple satellite-driven models, and also calculates a single "ensemble value" from the …
Priestley-Taylor Jet Propulsion Laboratory (PT-JPL). The core formulation of the PT-JPL model within the OpenET framework has not changed from the original formulation detailed in Fisher et al. (2008). However, enhancements and updates to model inputs and time integration for PT-JPL were made to take …
Satellite Irrigation Management Support (SIMS). The NASA Satellite Irrigation Management Support (SIMS) model was originally developed to support satellite mapping of crop coefficients and evapotranspiration (ET) from irrigated lands and to increase access to this data to support use in irrigation scheduling and regional assessment …
Operational Simplified Surface Energy Balance (SSEBop). The Operational Simplified Surface Energy Balance (SSEBop) model by Senay et al. (2013, 2017) is a thermal-based simplified surface energy model for estimating actual ET based on the principles of satellite psychrometry (Senay 2018). The OpenET SSEBop implementation uses …
Operational Simplified Surface Energy Balance (SSEBop). The Operational Simplified Surface Energy Balance (SSEBop) model (Senay et al., 2013; 2023) is a thermal based approach for estimating actual evapotranspiration (ET) using the principles of satellite psychrometry (Senay, 2018). As one of the core models in the …
Google Earth Engine implementation of the Mapping Evapotranspiration at high Resolution with Internalized Calibration model (eeMETRIC). eeMETRIC applies the advanced METRIC algorithms and process of Allen et al. (2007; 2015) and Allen et al. (2013b), where a singular relationship between the near surface air temperature …
Google Earth Engine implementation of the Surface Energy Balance Algorithm for Land (SEBAL) model. An overview of the current geeSEBAL version can be found in Laipelt et al. (2021), which is based on the original algorithms developed by Bastiaanssen et al. (1998). The OpenET geeSEBAL …
The Overture Maps Places theme contains more than 64 million point representations of real-world entities: businesses, schools, hospitals, religious organizations, landmarks, mountain peaks, and much more. Each place record includes location coordinates, names, categories, contact information (websites, social media, emails, phones), brand information, addresses, and …
Ойя: квазиглобальные оценки количества осадков на расстоянии 5 км
Oya — это квазиглобальный набор данных для оценки количества осадков с высоким разрешением, полученный на основе наблюдений с геостационарных (GEO) спутников. Модель Oya использует весь спектр видимых и инфракрасных (VIS-IR) каналов созвездия геостационарных спутников, включая GOES-16/18, Meteosat-9/10 и Himawari-8/9, для генерации оценок количества осадков, охватывающих…
PML_V2.2a: Coupled Evapotranspiration and Gross Primary Product (MODIS Edition)
The dataset is produced by the Large Scale Hydrology Lab, which specializes in advancing global and regional water cycle research by synthesizing multi-source Earth observations with process-based modeling. The PML-V2.2a (MODIS Edition) product provides global terrestrial evapotranspiration (ET) and gross primary production (GPP) at a …
PML_V2.2a: Coupled Evapotranspiration and Gross Primary Product (VIIRS Edition)
The dataset is produced by the Large Scale Hydrology Lab, which specializes in advancing global and regional water cycle research by synthesizing multi-source Earth observations with process-based modeling. The PML-V2.2a (VIIRS Edition) product provides global terrestrial evapotranspiration (ET) and gross primary production (GPP) at a …
This image collection provides estimated per-pixel probability that the underlying area is occupied by the commodity. The probability estimates are provided at 10 meter resolution, and have been generated by a machine learning model. For details, see the technical documentation on the Forest Data Partnership …
SCANFI: the Spatialized CAnadian National Forest Inventory data product1.2
This data publication contains a set of 30m resolution raster files representing 2020 Canadian wall-to-wall maps of broad land cover type, forest canopy height, degree of crown closure and aboveground tree biomass, along with species composition of several major tree species. The Spatialized CAnadian National …
These species distribution model outputs, developed by Google in collaboration with QCIF and EcoCommons, represent estimates of species' relative occurrence likelihoods (ie, higher values indicate a higher likelihood that the species would be detected at a location, for a given survey methodology and given survey …
TCB: Malaria Atlas Project Gap-Filled Tasseled Cap Brightness (8-Daily 1km)
This gap-filled Tasseled Cap Brightness (TCB) dataset was created by applying the tasseled-cap equations defined in Lobser and Cohen (2007) to MODIS BRDF-corrected imagery (MCD43B4). The resulting data were gap-filled using the approach outlined in Weiss et al. (2014) to eliminate missing data caused by …
TCB: Malaria Atlas Project Gap-Filled Tasseled Cap Brightness (Annual 1km)
This gap-filled Tasseled Cap Brightness (TCB) dataset was created by applying the tasseled-cap equations defined in Lobser and Cohen (2007) to MODIS BRDF-corrected imagery (MCD43B4). The resulting data were gap-filled using the approach outlined in Weiss et al. (2014) to eliminate missing data caused by …
TCB: Malaria Atlas Project Gap-Filled Tasseled Cap Brightness (Monthly 1km)
This gap-filled Tasseled Cap Brightness (TCB) dataset was created by applying the tasseled-cap equations defined in Lobser and Cohen (2007) to MODIS BRDF-corrected imagery (MCD43B4). The resulting data were gap-filled using the approach outlined in Weiss et al. (2014) to eliminate missing data caused by …
TCW: Malaria Atlas Project Gap-Filled Tasseled Cap Wetness (8-Daily 1km)
This gap-filled Tasseled Cap Wetness (TCW) dataset was created by applying the tasseled-cap equations defined in Lobser and Cohen (2007) to MODIS BRDF-corrected imagery (MCD43B4). The resulting data were gap-filled using the approach outlined in Weiss et al. (2014) to eliminate missing data caused by …
TCW: Malaria Atlas Project Gap-Filled Tasseled Cap Wetness (Annual 1km)
This gap-filled Tasseled Cap Wetness (TCW) dataset was created by applying the tasseled-cap equations defined in Lobser and Cohen (2007) to MODIS BRDF-corrected imagery (MCD43B4). The resulting data were gap-filled using the approach outlined in Weiss et al. (2014) to eliminate missing data caused by …
TCW: Malaria Atlas Project Gap-Filled Tasseled Cap Wetness (Monthly 1km)
This gap-filled Tasseled Cap Wetness (TCW) dataset was created by applying the tasseled-cap equations defined in Lobser and Cohen (2007) to MODIS BRDF-corrected imagery (MCD43B4). The resulting data were gap-filled using the approach outlined in Weiss et al. (2014) to eliminate missing data caused by …
USFS Landscape Change Monitoring System v2025-11 (CONUS and OCONUS)
This product is part of the Landscape Change Monitoring System (LCMS) data suite. It shows LCMS-modeled change, land cover, and/or land use classes for each year and covers the Conterminous United States (CONUS) as well as areas outside the CONUS (OCONUS) including Alaska (AK), Puerto …
The Tree Canopy Cover (TCC) data suite, produced by the United States Department of Agriculture, Forest Service (USFS), are annual remote sensing-based map outputs spanning from 1985-2025. These data support the National Land Cover Database (NLCD) project, which is managed by the US Geological Survey …
WDKBA: World Database of Key Biodiversity Areas (KBAs) - March 2026
If you are interested in accessing the KBA dataset please complete the KBA data request form which will allow access directly in GEE once approved. Key Biodiversity Areas (KBAs) are 'sites contributing significantly to the global persistence of biodiversity', in terrestrial, freshwater and marine ecosystems. …
WRI/Google DeepMind Global Drivers of Forest Loss 2001-2022 v1.0
This dataset maps the dominant driver of tree cover loss from 2001-2022 globally at 1 km resolution. Produced by the World Resources Institute (WRI) and Google DeepMind, the data were developed using a global neural network model (ResNet) trained on a set of samples collected …
WRI/Google DeepMind Global Drivers of Forest Loss 2001-2023 v1.1
This dataset maps the dominant driver of tree cover loss from 2001-2023 globally at 1 km resolution. Produced by the World Resources Institute (WRI) and Google DeepMind, the data were developed using a global neural network model (ResNet) trained on a set of samples collected …
WRI/Google DeepMind Global Drivers of Forest Loss 2001-2024 v1.2
This dataset maps the dominant driver of tree cover loss from 2001-2024 globally at 1 km resolution. Produced by the World Resources Institute (WRI) and Google DeepMind, the data were developed using a global neural network model (ResNet) trained on a set of samples collected …
WRI/Google DeepMind Global Drivers of Forest Loss 2001-2025 v1.3
This dataset maps the dominant driver of tree cover loss from 2001-2025 globally at 1 km resolution. Produced by the World Resources Institute (WRI) and Google DeepMind, the data were developed using a global neural network model (ResNet) trained on a set of samples collected …
WeatherNext 2 — это экспериментальный набор данных глобальных среднесрочных ансамблевых прогнозов погоды, созданный рабочей версией генеративной модели погоды на основе функциональной сети Google DeepMind. Экспериментальный набор данных включает данные в реальном времени и исторические данные. Данные в реальном времени — это любые данные, относящиеся ко времени, которое…
WeatherNext 2 Mean — это среднее значение 64 ансамблей экспериментального набора данных глобальных среднесрочных ансамблевых прогнозов погоды, созданных рабочей версией генеративной модели погоды на основе функциональной сети Google DeepMind. Для получения набора данных, содержащего все члены ансамбля, см. (не среднее) значение WeatherNext 2…
Набор данных WeatherNext 3 (0,05°) — это экспериментальный набор данных глобальных среднесрочных ансамблевых прогнозов погоды от Google DeepMind и Google Research, созданный на основе рабочей версии модели, описанной в статье: WeatherNext 3: Повышение разрешения и производительности глобальных моделей погоды с использованием необработанных данных наблюдений. Доступ к данным…
Набор данных WeatherNext 3 (0,1°) — это экспериментальный набор данных глобальных среднесрочных ансамблевых прогнозов погоды от Google DeepMind и Google Research, созданный на основе рабочей версии модели, описанной в статье: WeatherNext 3: Повышение разрешения и производительности глобальных моделей погоды с использованием необработанных данных наблюдений. Доступ к данным…
This image collection provides estimated per-pixel probability that the underlying area is occupied by the commodity. The probability estimates are provided at 10 meter resolution, and have been generated by a machine learning model. For details, see the technical documentation on the Forest Data Partnership …
EVI: Malaria Atlas Project Gap-Filled Enhanced Vegetation Index (8-Daily 1km)
The underlying dataset for this Enhanced Vegetation Index (EVI) product is MODIS BRDF-corrected imagery (MCD43B4), which was gap-filled using the approach outlined in Weiss et al. (2014) to eliminate missing data caused by factors such as cloud cover. After gap-filling the data was clipped to …
EVI: Malaria Atlas Project Gap-Filled Enhanced Vegetation Index (Annual 1km)
The underlying dataset for this Enhanced Vegetation Index (EVI) product is MODIS BRDF-corrected imagery (MCD43B4), which was gap-filled using the approach outlined in Weiss et al. (2014) to eliminate missing data caused by factors such as cloud cover. After gap-filling the data was clipped to …
EVI: Malaria Atlas Project Gap-Filled Enhanced Vegetation Index (Monthly 1km)
The underlying dataset for this Enhanced Vegetation Index (EVI) product is MODIS BRDF-corrected imagery (MCD43B4), which was gap-filled using the approach outlined in Weiss et al. (2014) to eliminate missing data caused by factors such as cloud cover. After gap-filling the data was clipped to …
The Farmscapes 2020 dataset provides high-resolution (25cm) probability maps for three key semi-natural features within England's agricultural landscapes: hedgerows, woodland, and stone walls. This dataset was developed in collaboration with the Leverhulme Centre for Nature Recovery at Oxford to serve as a baseline for applications …
This is the vectorised version of the Farmscapes 2020 raster dataset. It provides polygon geometries representing fine-scale semi-natural landscape features (specifically hedgerows, woodland, and stone walls) across England's agricultural landscapes. This dataset was developed in collaboration with the Oxford Leverhulme Centre for Nature Recovery to …
This image provides a per-pixel score (in [0, 1]) that indicates whether the pixel area is occupied by undisturbed forest in year 2020. These scores are provided at 30 meter resolution, and have been generated by a convergence of evidence approach to combining multiple forest …
The Forest Typology (ForTy) v1 dataset consists of a global per-class probability map at 10 m resolution covering all land areas between 65°S and 84°N latitude for the year 2020. The six-class typology is aligned with FAO and EU Deforestation Regulation (EUDR) definitions: Class 1 …
This dataset provides global annual dominant class maps of grasslands (cultivated and natural/semi-natural) from 2000 to 2022 at 30-m spatial resolution. Produced by the Land & Carbon Lab Global Pasture Watch initiative, the mapped grassland extent includes any land cover type, which contains at least …
GPW Annual Probabilities of Cultivated Grasslands v1
This dataset provides global annual probability maps of cultivated grassland from 2000 to 2022 at 30-m spatial resolution. Produced by the Land & Carbon Lab Global Pasture Watch initiative, the mapped grassland extent includes any land cover type, which contains at least 30% of dry …
GPW Annual Probabilities of Natural/Semi-natural Grasslands v1
This dataset provides global annual probability maps of natural/semi-natural grassland from 2000 to 2022 at 30-m spatial resolution. Produced by the Land & Carbon Lab Global Pasture Watch initiative, the mapped grassland extent includes any land cover type, which contains at least 30% of dry …
This dataset provides global livestock headcount from 2000 to 2022 at 1-km spatial resolution. Produced by the Land & Carbon Lab's Global Pasture Watch initiative, the current dataset provides global headcount predictions adjusted to FAOSTAT national statistics. The dataset is based on the largest known …
This dataset provides global median vegetation height from 2000 at 30-m spatial resolution. Produced by the Land & Carbon Lab's Global Pasture Watch initiative, this dataset provides median vegetation height values (50th percentile) globally at 30-m spatial resolution from 2000 onwards. The dataset is based …
This dataset provides global uncalibrated EO-based Gross Primary Productivity from 2000 at 30-m spatial resolution. Produced by the Land & Carbon Lab Global Pasture Watch initiative, the current dataset provides Gross Primary Productivity (GPP) values globally at 30-m spatial resolution from 2000 onwards. GPP values …
The CGMD-Extent30 (Continuous Global Mangrove Dynamics-Annual Mangrove Extent at 30-m resolution) dataset provides global annual mangrove extent from 1984 to 2023. The dataset is distributed as a single Earth Engine FeatureCollection, with each feature representing a mapped mangrove polygon for a specific year. The dataset …
Global Annual Mangrove Fractional Canopy Cover (1984-2023)
This dataset provides global annual mangrove fractional canopy cover (FCC) at 30-m spatial resolution from 1984 to 2023 to support large-scale analyses of long-term mangrove dynamics, including canopy degradation and recovery, blue carbon assessment, and coastal ecosystem monitoring. FCC quantifies the proportion of each Landsat …
LST Day: Malaria Atlas Project Gap-Filled Daytime Land Surface Temperature (8-Daily 1km)
Daytime Land Surface Temperature (LST) are derived from the ~1km MODIS MOD11A2 v6.1 products. The 8-daily composites are converted to degrees Celsius and then gap-filled using the approach outlined in Weiss et al (2014) to eliminate missing data caused by factors such as cloud cover. …
LST Day: Malaria Atlas Project Gap-Filled Daytime Land Surface Temperature (Annual 1km)
Daytime Land Surface Temperature (LST) are derived from the ~1km MODIS MOD11A2 v6.1 products. The 8-daily composites are converted to degrees Celsius and then gap-filled using the approach outlined in Weiss et al (2014) to eliminate missing data caused by factors such as cloud cover. …
LST Day: Malaria Atlas Project Gap-Filled Daytime Land Surface Temperature (Monthly 1km)
Daytime Land Surface Temperature (LST) are derived from the ~1km MODIS MOD11A2 v6.1 products. The 8-daily composites are converted to degrees Celsius and then gap-filled using the approach outlined in Weiss et al (2014) to eliminate missing data caused by factors such as cloud cover. …
LST Night: Malaria Atlas Project Gap-Filled Nighttime Land Surface Temperature (8-Daily 1km)
Nighttime Land Surface Temperature (LST) are derived from the ~1km MODIS MOD11A2 v6.1 products. The 8-daily composites are converted to degrees Celsius and then gap-filled using the approach outlined in Weiss et al (2014) to eliminate missing data caused by factors such as cloud cover. …
LST Night: Malaria Atlas Project Gap-Filled Nighttime Land Surface Temperature (Annual 1km)
Nighttime Land Surface Temperature (LST) are derived from the ~1km MODIS MOD11A2 v6.1 products. The 8-daily composites are converted to degrees Celsius and then gap-filled using the approach outlined in Weiss et al (2014) to eliminate missing data caused by factors such as cloud cover. …
LST Night: Malaria Atlas Project Gap-Filled Nighttime Land Surface Temperature (Monthly 1km)
Nighttime Land Surface Temperature (LST) are derived from the ~1km MODIS MOD11A2 v6.1 products. The 8-daily composites are converted to degrees Celsius and then gap-filled using the approach outlined in Weiss et al (2014) to eliminate missing data caused by factors such as cloud cover. …
MAPL-EMIT: Modeled Methane Enhancement and Plume Probability
The Methane Analysis and Plume Localization with EMIT (MAPL-EMIT) enhancements dataset provides high-resolution (60m) methane (CH₄) enhancement maps and plume probabilities derived from radiance data captured by the Earth Surface Mineral Dust Source Investigation (EMIT) instrument which were generated and released as part of the …
The Methane Analysis and Plume Localization with EMIT (MAPL-EMIT) dataset provides high-resolution (60m) methane (CH₄) plume complex maps and plume source locations derived from radiance data captured by the Earth Surface Mineral Dust Source Investigation (EMIT) instrument. Methane point-source emissions are a major driver of …
Malaria Atlas Project Accessibility to Cities 2015
This global accessibility map enumerates land-based travel time to the nearest densely-populated area for all areas between 85 degrees north and 60 degrees south for a nominal year 2015. Densely-populated areas are defined as contiguous areas with 1,500 or more inhabitants per square kilometer or …
Malaria Atlas Project Accessibility to Healthcare 2019
This global accessibility map enumerates land-based travel time (in minutes) to the nearest hospital or clinic for all areas between 85 degrees north and 60 degrees south for a nominal year 2019. Major data collection efforts underway by OpenStreetMap, Google Maps, and academic researchers have …
Malaria Atlas Project Accessibility to Healthcare 2019 (Walking Only)
This global accessibility map enumerates land-based travel time (in minutes) to the nearest hospital or clinic for all areas between 85 degrees north and 60 degrees south for a nominal year 2019. This surface is based on "walking-only" travel time, using non-motorized means of transportation …
Malaria Atlas Project Global Friction Surface 2015
Friction Surface 2019". This global friction surface enumerates land-based travel speed for all land pixels between 85 degrees north and 60 degrees south for a nominal year 2015. This map was produced through a collaboration between the University of Oxford Malaria Atlas Project (MAP), Google, …
Malaria Atlas Project Global Friction Surface 2019
This global friction surface enumerates land-based travel speed for all land pixels between 85 degrees north and 60 degrees south for a nominal year 2019. This map was produced through a collaboration between MAP (University of Oxford), Telethon Kids Institute (Perth, Australia), Google, and the …
Malaria Atlas Project Global Friction Surface 2019 (Walking Only)
This global friction surface enumerates land-based travel speed for all land pixels between 85 degrees north and 60 degrees south for a nominal year 2019. This surface is based on "walking-only" travel speed, using non-motorized means of transportation only. This map was produced through a …
MapBiomas Land Use and Land Cover (LULC) dataset for Bolivia is produced annually by the MapBiomas Project using Landsat satellite imagery and machine learning classification techniques. The dataset provides consistent annual land cover maps at 30-meter resolution covering the period from 1985 to 2024. Bolivia's …
MapBiomas Land Use and Land Cover (LULC) dataset for Brazil is produced annually by the MapBiomas Project using Landsat satellite imagery and machine learning classification techniques. The dataset provides consistent, thematically detailed maps at 30-meter resolution, covering multiple decades and updated each year. Each image …
MapBiomas Land Use and Land Cover (LULC) dataset for Ecuador is produced annually by the MapBiomas Project using Landsat satellite imagery and machine learning classification techniques. The dataset provides consistent annual land cover maps at 30-meter resolution covering the period from 1985 to 2024. Ecuador's …
This dataset provides geospatial data for the total column dry air mole fraction of methane in the atmosphere, "XCH4", as observed by the MethaneAIR imaging spectrometer. XCH4 is defined as the total column amount (number of molecules) of methane ("CH4") divided by the total amount …
This dataset provides data for high-emitting methane point source detections (kg/hr) over 13 oil and gas or coal extraction areas from Colorado, New Mexico, and Texas in the west to Pennsylvania, Ohio, and West Virginia in the east, plus three urban areas (New York City, …
This early "Public Preview" dataset provides geospatial data for the column-averaged dry-air mole fraction of methane in the atmosphere, "XCH4", retrieved from measurements by the MethaneSAT imaging spectrometer. XCH4 is defined as the total column amount (number of molecules above a unit surface area) of …
The dispersed area emissions model is still in development and not representative of a final product. This early "Public Preview" dataset provides high precision data for methane emissions from dispersed area sources. These emissions data come from the Appalachian, Permian, and Uinta basins in the …
The dispersed area emissions model is still in development and not representative of a final product. This early "Public Preview" dataset provides high precision data for methane emissions from dispersed area sources. These novel measurements demonstrate the importance of quantifying total methane emissions with high …
This early "Public Preview" dataset provides high precision data for methane emissions from discrete point sources. These methane emission fluxes were produced using a point source detection and emissions quantification framework specialized to exploit the high spatial resolution, wide spatial coverage, and high precision of …
Height of the top of canopy above bare earth (Canopy Height Model; CHM). The CHM is derived from the NEON LiDAR point cloud and is generated by creating a continuous surface of canopy height estimates across the entire spatial domain of the LiDAR survey. The …
Modelled canopy nitrogen concentration calibrated with NEON plant foliar chemistry observations and predicted with L1 surface directional reflectance, derived from the NEON Imaging Spectrometer (NIS). Bands include 1) canopy nitrogen percent, 2) canopy nitrogen model uncertainty, 3) classification result for needle vs. non-needle model and …
Digital models of the surface (DSM) and terrain (DTM) derived from NEON LiDAR data. DSM: Surface features (topographic information with vegetation and man-made structures present). DTM: Bare earth elevation (topographic information with vegetation and man-made structures removed). Images are given in meters above mean sea …
High resolution Red-Green-Blue (RGB) orthorectified camera images mosaicked and output onto a fixed, uniform spatial grid using nearest-neighbor resampling; spatial resolution is 0.1 m. The digital camera is part of a suite of instruments on the NEON Airborne Observation Platform (AOP) that also includes a …
The NEON AOP Surface Bidirectional Reflectance is a hyperspectral VSWIR (visible to shortwave infrared) data product, containing 426 bands spanning wavelengths from ~380 nm to 2510 nm. Reflectance is scaled by a factor of 10000. Wavelengths between 1340-1445 nm and 1790-1955 nm are set to …
The NEON AOP Surface Directional Reflectance is a hyperspectral VSWIR (visible to shortwave infrared) data product, containing 426 bands spanning wavelengths from ~380 nm to 2510 nm. Reflectance is scaled by a factor of 10000. Wavelengths between 1340-1445 nm and 1790-1955 nm are set to …
NICFI Satellite Data Program Basemaps for Tropical Forest Monitoring - Africa
This image collection provides access to high-resolution satellite monitoring of the tropics for the primary purpose of reducing and reversing the loss of tropical forests, contributing to combating climate change, conserving biodiversity, contributing to forest regrowth, restoration and enhancement, and facilitating sustainable development, all of …
NICFI Satellite Data Program Basemaps for Tropical Forest Monitoring - Americas
This image collection provides access to high-resolution satellite monitoring of the tropics for the primary purpose of reducing and reversing the loss of tropical forests, contributing to combating climate change, conserving biodiversity, contributing to forest regrowth, restoration and enhancement, and facilitating sustainable development, all of …
NICFI Satellite Data Program Basemaps for Tropical Forest Monitoring - Asia
This image collection provides access to high-resolution satellite monitoring of the tropics for the primary purpose of reducing and reversing the loss of tropical forests, contributing to combating climate change, conserving biodiversity, contributing to forest regrowth, restoration and enhancement, and facilitating sustainable development, all of …
Natural Forests of the World 2020, provides a global map of natural forest probability for the year 2020 at a 10-meter resolution. It was developed to support initiatives like the European Union's Deforestation Regulation (EUDR) and other efforts for forest conservation and monitoring. The map …
Atmosphere-Land Exchange Inverse / Disaggregation of the Atmosphere-Land Exchange Inverse (ALEXI/DisALEXI). DisALEXI was ported to Google Earth Engine as part of the OpenET framework. The baseline ALEXI/DisALEXI model structure is described by Anderson et al. (2012, 2018). The ALEXI evapotranspiration (ET) model specifically uses time …
The OpenET dataset includes satellite-based data on the total amount of water that is transferred from the land surface to the atmosphere through the process of evapotranspiration (ET). OpenET provides ET data from multiple satellite-driven models, and also calculates a single "ensemble value" from the …
Priestley-Taylor Jet Propulsion Laboratory (PT-JPL). The core formulation of the PT-JPL model within the OpenET framework has not changed from the original formulation detailed in Fisher et al. (2008). However, enhancements and updates to model inputs and time integration for PT-JPL were made to take …
Satellite Irrigation Management Support (SIMS). The NASA Satellite Irrigation Management Support (SIMS) model was originally developed to support satellite mapping of crop coefficients and evapotranspiration (ET) from irrigated lands and to increase access to this data to support use in irrigation scheduling and regional assessment …
Operational Simplified Surface Energy Balance (SSEBop). The Operational Simplified Surface Energy Balance (SSEBop) model by Senay et al. (2013, 2017) is a thermal-based simplified surface energy model for estimating actual ET based on the principles of satellite psychrometry (Senay 2018). The OpenET SSEBop implementation uses …
Operational Simplified Surface Energy Balance (SSEBop). The Operational Simplified Surface Energy Balance (SSEBop) model (Senay et al., 2013; 2023) is a thermal based approach for estimating actual evapotranspiration (ET) using the principles of satellite psychrometry (Senay, 2018). As one of the core models in the …
Google Earth Engine implementation of the Mapping Evapotranspiration at high Resolution with Internalized Calibration model (eeMETRIC). eeMETRIC applies the advanced METRIC algorithms and process of Allen et al. (2007; 2015) and Allen et al. (2013b), where a singular relationship between the near surface air temperature …
Google Earth Engine implementation of the Surface Energy Balance Algorithm for Land (SEBAL) model. An overview of the current geeSEBAL version can be found in Laipelt et al. (2021), which is based on the original algorithms developed by Bastiaanssen et al. (1998). The OpenET geeSEBAL …
The Overture Maps Places theme contains more than 64 million point representations of real-world entities: businesses, schools, hospitals, religious organizations, landmarks, mountain peaks, and much more. Each place record includes location coordinates, names, categories, contact information (websites, social media, emails, phones), brand information, addresses, and …
Ойя: квазиглобальные оценки количества осадков на расстоянии 5 км
Oya — это квазиглобальный набор данных для оценки количества осадков с высоким разрешением, полученный на основе наблюдений с геостационарных (GEO) спутников. Модель Oya использует весь спектр видимых и инфракрасных (VIS-IR) каналов созвездия геостационарных спутников, включая GOES-16/18, Meteosat-9/10 и Himawari-8/9, для генерации оценок количества осадков, охватывающих…
PML_V2.2a: Coupled Evapotranspiration and Gross Primary Product (MODIS Edition)
The dataset is produced by the Large Scale Hydrology Lab, which specializes in advancing global and regional water cycle research by synthesizing multi-source Earth observations with process-based modeling. The PML-V2.2a (MODIS Edition) product provides global terrestrial evapotranspiration (ET) and gross primary production (GPP) at a …
PML_V2.2a: Coupled Evapotranspiration and Gross Primary Product (VIIRS Edition)
The dataset is produced by the Large Scale Hydrology Lab, which specializes in advancing global and regional water cycle research by synthesizing multi-source Earth observations with process-based modeling. The PML-V2.2a (VIIRS Edition) product provides global terrestrial evapotranspiration (ET) and gross primary production (GPP) at a …
This image collection provides estimated per-pixel probability that the underlying area is occupied by the commodity. The probability estimates are provided at 10 meter resolution, and have been generated by a machine learning model. For details, see the technical documentation on the Forest Data Partnership …
SCANFI: the Spatialized CAnadian National Forest Inventory data product1.2
This data publication contains a set of 30m resolution raster files representing 2020 Canadian wall-to-wall maps of broad land cover type, forest canopy height, degree of crown closure and aboveground tree biomass, along with species composition of several major tree species. The Spatialized CAnadian National …
These species distribution model outputs, developed by Google in collaboration with QCIF and EcoCommons, represent estimates of species' relative occurrence likelihoods (ie, higher values indicate a higher likelihood that the species would be detected at a location, for a given survey methodology and given survey …
TCB: Malaria Atlas Project Gap-Filled Tasseled Cap Brightness (8-Daily 1km)
This gap-filled Tasseled Cap Brightness (TCB) dataset was created by applying the tasseled-cap equations defined in Lobser and Cohen (2007) to MODIS BRDF-corrected imagery (MCD43B4). The resulting data were gap-filled using the approach outlined in Weiss et al. (2014) to eliminate missing data caused by …
TCB: Malaria Atlas Project Gap-Filled Tasseled Cap Brightness (Annual 1km)
This gap-filled Tasseled Cap Brightness (TCB) dataset was created by applying the tasseled-cap equations defined in Lobser and Cohen (2007) to MODIS BRDF-corrected imagery (MCD43B4). The resulting data were gap-filled using the approach outlined in Weiss et al. (2014) to eliminate missing data caused by …
TCB: Malaria Atlas Project Gap-Filled Tasseled Cap Brightness (Monthly 1km)
This gap-filled Tasseled Cap Brightness (TCB) dataset was created by applying the tasseled-cap equations defined in Lobser and Cohen (2007) to MODIS BRDF-corrected imagery (MCD43B4). The resulting data were gap-filled using the approach outlined in Weiss et al. (2014) to eliminate missing data caused by …
TCW: Malaria Atlas Project Gap-Filled Tasseled Cap Wetness (8-Daily 1km)
This gap-filled Tasseled Cap Wetness (TCW) dataset was created by applying the tasseled-cap equations defined in Lobser and Cohen (2007) to MODIS BRDF-corrected imagery (MCD43B4). The resulting data were gap-filled using the approach outlined in Weiss et al. (2014) to eliminate missing data caused by …
TCW: Malaria Atlas Project Gap-Filled Tasseled Cap Wetness (Annual 1km)
This gap-filled Tasseled Cap Wetness (TCW) dataset was created by applying the tasseled-cap equations defined in Lobser and Cohen (2007) to MODIS BRDF-corrected imagery (MCD43B4). The resulting data were gap-filled using the approach outlined in Weiss et al. (2014) to eliminate missing data caused by …
TCW: Malaria Atlas Project Gap-Filled Tasseled Cap Wetness (Monthly 1km)
This gap-filled Tasseled Cap Wetness (TCW) dataset was created by applying the tasseled-cap equations defined in Lobser and Cohen (2007) to MODIS BRDF-corrected imagery (MCD43B4). The resulting data were gap-filled using the approach outlined in Weiss et al. (2014) to eliminate missing data caused by …
USFS Landscape Change Monitoring System v2025-11 (CONUS and OCONUS)
This product is part of the Landscape Change Monitoring System (LCMS) data suite. It shows LCMS-modeled change, land cover, and/or land use classes for each year and covers the Conterminous United States (CONUS) as well as areas outside the CONUS (OCONUS) including Alaska (AK), Puerto …
The Tree Canopy Cover (TCC) data suite, produced by the United States Department of Agriculture, Forest Service (USFS), are annual remote sensing-based map outputs spanning from 1985-2025. These data support the National Land Cover Database (NLCD) project, which is managed by the US Geological Survey …
WDKBA: World Database of Key Biodiversity Areas (KBAs) - March 2026
If you are interested in accessing the KBA dataset please complete the KBA data request form which will allow access directly in GEE once approved. Key Biodiversity Areas (KBAs) are 'sites contributing significantly to the global persistence of biodiversity', in terrestrial, freshwater and marine ecosystems. …
WRI/Google DeepMind Global Drivers of Forest Loss 2001-2022 v1.0
This dataset maps the dominant driver of tree cover loss from 2001-2022 globally at 1 km resolution. Produced by the World Resources Institute (WRI) and Google DeepMind, the data were developed using a global neural network model (ResNet) trained on a set of samples collected …
WRI/Google DeepMind Global Drivers of Forest Loss 2001-2023 v1.1
This dataset maps the dominant driver of tree cover loss from 2001-2023 globally at 1 km resolution. Produced by the World Resources Institute (WRI) and Google DeepMind, the data were developed using a global neural network model (ResNet) trained on a set of samples collected …
WRI/Google DeepMind Global Drivers of Forest Loss 2001-2024 v1.2
This dataset maps the dominant driver of tree cover loss from 2001-2024 globally at 1 km resolution. Produced by the World Resources Institute (WRI) and Google DeepMind, the data were developed using a global neural network model (ResNet) trained on a set of samples collected …
WRI/Google DeepMind Global Drivers of Forest Loss 2001-2025 v1.3
This dataset maps the dominant driver of tree cover loss from 2001-2025 globally at 1 km resolution. Produced by the World Resources Institute (WRI) and Google DeepMind, the data were developed using a global neural network model (ResNet) trained on a set of samples collected …
WeatherNext 2 — это экспериментальный набор данных глобальных среднесрочных ансамблевых прогнозов погоды, созданный рабочей версией генеративной модели погоды на основе функциональной сети Google DeepMind. Экспериментальный набор данных включает данные в реальном времени и исторические данные. Данные в реальном времени — это любые данные, относящиеся ко времени, которое…
WeatherNext 2 Mean — это среднее значение 64 ансамблей экспериментального набора данных глобальных среднесрочных ансамблевых прогнозов погоды, созданных рабочей версией генеративной модели погоды на основе функциональной сети Google DeepMind. Для получения набора данных, содержащего все члены ансамбля, см. (не среднее) значение WeatherNext 2…
Набор данных WeatherNext 3 (0,05°) — это экспериментальный набор данных глобальных среднесрочных ансамблевых прогнозов погоды от Google DeepMind и Google Research, созданный на основе рабочей версии модели, описанной в статье: WeatherNext 3: Повышение разрешения и производительности глобальных моделей погоды с использованием необработанных данных наблюдений. Доступ к данным…
Набор данных WeatherNext 3 (0,1°) — это экспериментальный набор данных глобальных среднесрочных ансамблевых прогнозов погоды от Google DeepMind и Google Research, созданный на основе рабочей версии модели, описанной в статье: WeatherNext 3: Повышение разрешения и производительности глобальных моделей погоды с использованием необработанных данных наблюдений. Доступ к данным…
[[["Прост для понимания","easyToUnderstand","thumb-up"],["Помог мне решить мою проблему","solvedMyProblem","thumb-up"],["Другое","otherUp","thumb-up"]],[["Отсутствует нужная мне информация","missingTheInformationINeed","thumb-down"],["Слишком сложен/слишком много шагов","tooComplicatedTooManySteps","thumb-down"],["Устарел","outOfDate","thumb-down"],["Проблема с переводом текста","translationIssue","thumb-down"],["Проблемы образцов/кода","samplesCodeIssue","thumb-down"],["Другое","otherDown","thumb-down"]],[],[],[]]