This site has been permanently archived. The content on this site was last updated in 2019.
Performance HUD
Stay organized with collections
Save and categorize content based on your preferences.
The Daydream Performance HUD is a performance overlay
enabled for all Daydream applications built with Google VR SDK 1.60 and
above. It provides a quick insight into performance issues you might encounter
when working with VR applications.

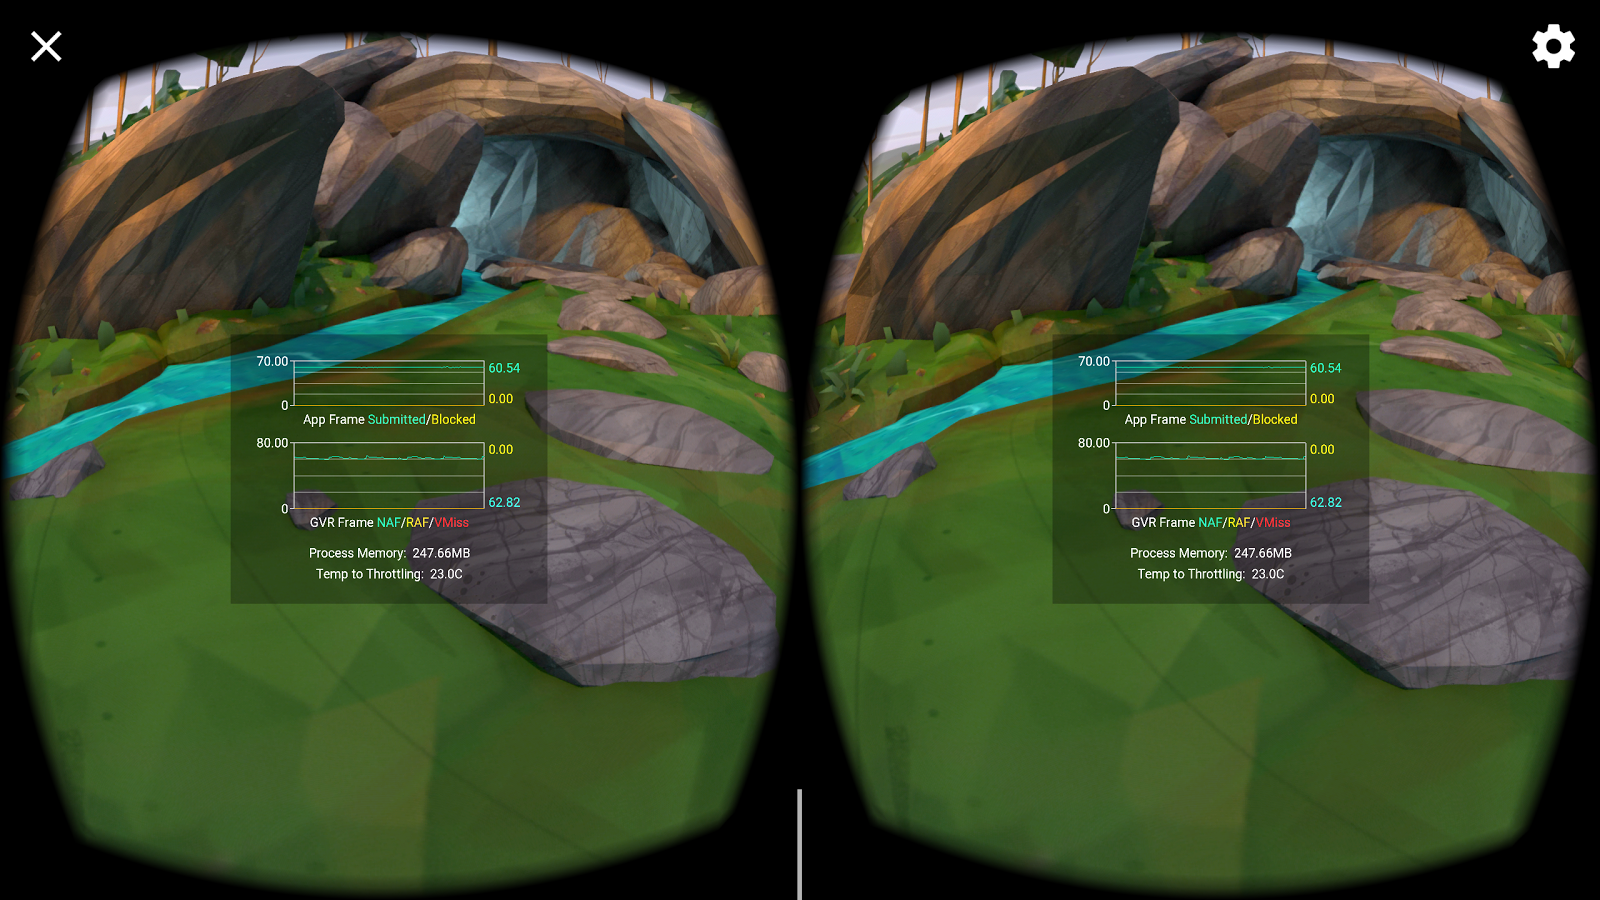
This tool is useful if you’re trying to monitor frame rate or asynchronous
reprojection issues while you’re working within VR. The overlay is rendered in
stereo and head-locked so you don’t need to leave VR to see this data.
Using this overlay, you are able to see:
- Application frame submit rate and whether frames were blocked on the GPU
- Asynchronous Reprojection statistics
- Process memory usage
- How many degrees (°C) the device is from thermal throttling
Enabling the HUD
- Open VR Settings, available by tapping the gear icon at the top right of
the phone's screen after launching a Daydream application.
- Tap Build Version six times to make the Developer Options
item appear.
Select Developer Options -> Enable performance heads-up display.
Enabling this option also implicitly enables the Enable performance
monitoring option.
You should now see the performance overlay the next time you run a VR app.
Metrics displayed
Application Rendering Metrics
This graph shows the behaviour of your running VR application.
Submitted: The number of application submitted frames per second, ideally matching the
device hardware frame rate.
Blocked: Number of frames per second whose submission was blocked waiting on GPU work for
the previous frame to finish executing. Generally if you are seeing an equal
number of frames submitted as blocked on GPU, your application is GPU bound.
Google VR SDK (GVR) Metrics
The Google VR SDK utilizes an asynchronous reprojection pipeline for display
stability and user comfort. In brief, a dedicated high priority thread
asynchronously picks up frames submitted from the application and applies
distortion and reprojection as necessary. In the absence of any new frames from
the application, the reprojection pipeline will utilize an older frame,
reprojecting the older frame with updated information about head rotation from
system sensors.
- New App Frames (NAF): The number of times per second that the display reprojection pipeline picked up
a new frame from the application. An ideal ‘New App Frame' rate is the native
display frame rate - e.g. 60hz on a Daydream phone device, meaning that every
physical refresh of the screen has updated application data.
- Reused App Frames (RAF): The number of times per second that the display reprojection pipeline did not have a new frame from the application, and had to reproject a previously provided frame A non-zero value here represents increased input to
photon latency, and a constantly changing re-used app frame value can lead to
animation and motion discontinuities.
- VSync Misses (VMISS): This value represents an inability of the display pipeline to reproject any
frames in time for the hardware's vertical synchronization deadline. This is
usually out of the developer's specific control but can be caused by systems in
a generally overburdened state. For some architectures, it can be an indication
of excessive work in the vertex shaders, excessive I/O or using large vertex
buffers.
Application System Metrics
Process Memory: The memory currently being used by your process.
Temp to Throttling: The approximate temperature (in degrees in Celsius) before the device will enter
a thermal shutdown state to protect against overheating. The temperature of the
device is driven from multiple factors, .e.g. CPU, GPU, network, etc.
Applications usually make use of ‘Sustained Performance Mode' to ensure a cap on
these resources in an attempt to prevent thermal shutdown.
All rights reserved. Java is a registered trademark of Oracle and/or its affiliates.
Last updated 2024-10-09 UTC.
[[["Easy to understand","easyToUnderstand","thumb-up"],["Solved my problem","solvedMyProblem","thumb-up"],["Other","otherUp","thumb-up"]],[["Missing the information I need","missingTheInformationINeed","thumb-down"],["Too complicated / too many steps","tooComplicatedTooManySteps","thumb-down"],["Out of date","outOfDate","thumb-down"],["Samples / code issue","samplesCodeIssue","thumb-down"],["Other","otherDown","thumb-down"]],["Last updated 2024-10-09 UTC."],[[["\u003cp\u003eThe Daydream Performance HUD, available for Daydream applications built with Google VR SDK 1.60 and above, provides real-time insights into VR application performance.\u003c/p\u003e\n"],["\u003cp\u003eIt allows developers to monitor key metrics like frame rate, asynchronous reprojection, memory usage, and device temperature within the VR environment.\u003c/p\u003e\n"],["\u003cp\u003eThe HUD displays Application Rendering Metrics, Google VR SDK Metrics, and Application System Metrics for detailed performance analysis.\u003c/p\u003e\n"],["\u003cp\u003eDevelopers can enable the HUD through the VR settings by accessing Developer Options and enabling the performance heads-up display.\u003c/p\u003e\n"],["\u003cp\u003eBy using this tool, developers can identify performance bottlenecks and optimize their VR applications for smoother user experiences.\u003c/p\u003e\n"]]],["The Daydream Performance HUD, available in Google VR SDK 1.60+, is a stereo, head-locked overlay for VR performance monitoring. It displays application rendering metrics like submitted and blocked frames, indicating GPU bottlenecks. GVR metrics show new and reused app frames, and VSync misses. Additional data includes process memory usage and the device's temperature proximity to thermal throttling. To enable, tap the **Build Version** six times in VR Settings to unlock Developer Options, then enable **performance heads-up display**.\n"],null,["The Daydream Performance HUD is a performance overlay\nenabled for all Daydream applications **built with Google VR SDK 1.60** and\nabove. It provides a quick insight into performance issues you might encounter\nwhen working with VR applications.\n\nThis tool is useful if you're trying to monitor frame rate or asynchronous\nreprojection issues while you're working within VR. The overlay is rendered in\nstereo and head-locked so you don't need to leave VR to see this data.\n\nUsing this overlay, you are able to see:\n\n- Application frame submit rate and whether frames were blocked on the GPU\n- Asynchronous Reprojection statistics\n- Process memory usage\n- How many degrees (°C) the device is from thermal throttling\n\nEnabling the HUD\n\n1. Open VR Settings, available by tapping the gear icon at the top right of the phone's screen after launching a Daydream application.\n2. Tap **Build Version** six times to make the Developer Options item appear.\n3. Select **Developer Options -\\\u003e Enable performance heads-up display** .\n Enabling this option also implicitly enables the **Enable performance\n monitoring** option.\n\n4. You should now see the performance overlay the next time you run a VR app.\n\nMetrics displayed\n\nApplication Rendering Metrics\n\nThis graph shows the behaviour of your running VR application.\n\n- **Submitted**: The number of application submitted frames per second, ideally matching the\n device hardware frame rate.\n\n- **Blocked**: Number of frames per second whose submission was blocked waiting on GPU work for\n the previous frame to finish executing. Generally if you are seeing an equal\n number of frames submitted as blocked on GPU, your application is GPU bound.\n\nGoogle VR SDK (GVR) Metrics\n\nThe Google VR SDK utilizes an asynchronous reprojection pipeline for display\nstability and user comfort. In brief, a dedicated high priority thread\nasynchronously picks up frames submitted from the application and applies\ndistortion and reprojection as necessary. In the absence of any new frames from\nthe application, the reprojection pipeline will utilize an older frame,\nreprojecting the older frame with updated information about head rotation from\nsystem sensors.\n\n- **New App Frames (NAF)**: The number of times per second that the display reprojection pipeline picked up a new frame from the application. An ideal 'New App Frame' rate is the native display frame rate - e.g. 60hz on a Daydream phone device, meaning that every physical refresh of the screen has updated application data.\n- **Reused App Frames (RAF)**: The number of times per second that the display reprojection pipeline did not have a new frame from the application, and had to reproject a previously provided frame A non-zero value here represents increased input to photon latency, and a constantly changing re-used app frame value can lead to animation and motion discontinuities.\n- **VSync Misses (VMISS)**: This value represents an inability of the display pipeline to reproject any frames in time for the hardware's vertical synchronization deadline. This is usually out of the developer's specific control but can be caused by systems in a generally overburdened state. For some architectures, it can be an indication of excessive work in the vertex shaders, excessive I/O or using large vertex buffers.\n\nApplication System Metrics\n\n- **Process Memory**: The memory currently being used by your process.\n\n- **Temp to Throttling**: The approximate temperature (in degrees in Celsius) before the device will enter\n a thermal shutdown state to protect against overheating. The temperature of the\n device is driven from multiple factors, .e.g. CPU, GPU, network, etc.\n Applications usually make use of 'Sustained Performance Mode' to ensure a cap on\n these resources in an attempt to prevent thermal shutdown."]]