
W sekcji FeatureStyleFunction
określasz logikę selektywnego stylowania obiektów w zbiorze danych. Zgodnie z tą logiką zwraca wartość FeatureStyleOptions. Jeśli logika stylizacji nie jest wymagana, możesz użyć FeatureStyleOptions
, aby bezpośrednio ustawić style. Na tej stronie dowiesz się, jak dodać zbiór danych do mapy i zastosować style.
Wymagania wstępne
Zanim przejdziesz dalej, musisz mieć identyfikator mapy, styl mapy i identyfikator zbioru danych.
Powiązywanie identyfikatora zbioru danych ze stylem mapy
Aby powiązać zbiór danych ze stylem mapy, którego używasz:
- W konsoli Google Cloud otwórz stronę Zbiory danych.
- Kliknij nazwę zbioru danych. Pojawi się strona Szczegóły zbioru danych.
- Kliknij kartę Podgląd.
- Przewiń do sekcji DODAJ STYL MAPY i kliknij ją.
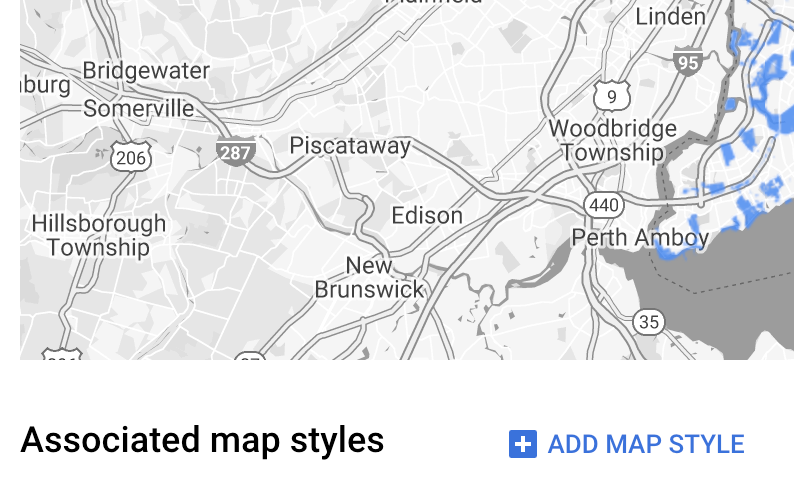
- Zaznacz pola wyboru stylów mapy, które chcesz powiązać, a następnie kliknij ZAPISZ.
Używanie prostych reguł stylu
Najprostszym sposobem na określenie stylu elementów jest przekazanie obiektu FeatureStyleOptions, aby zdefiniować atrybuty stylu, takie jak kolor, krycie i szerokość linii. Stosuj opcje stylu elementu bezpośrednio do warstwy mapy zbioru danych lub używaj ich w połączeniu z FeatureStyleFunction.
TypeScript
const styleOptions = { strokeColor: 'green', strokeWeight: 2, strokeOpacity: 1, fillColor: 'green', fillOpacity: 0.3, };
JavaScript
const styleOptions = { strokeColor: 'green', strokeWeight: 2, strokeOpacity: 1, fillColor: 'green', fillOpacity: 0.3, };
Używanie deklaratywnych reguł stylu
Użyj FeatureStyleFunction, aby deklaratywnie ustawić reguły stylu i zastosować je do całego zbioru danych. Zastosuj FeatureStyleOptions do funkcji na podstawie wartości atrybutów zbioru danych. Możesz też zwrócić null z funkcji stylu cechy, na przykład jeśli chcesz, aby podzbiór cech pozostał niewidoczny. Ten przykład pokazuje funkcję stylu, która koloruje zestaw punktów na podstawie atrybutów danych:
TypeScript
function setStyle(params: { feature: google.maps.Feature }) { // Get the dataset feature, so we can work with all of its attributes. const datasetFeature = params.feature as google.maps.DatasetFeature; // Get all of the needed dataset attributes. const furColors = datasetFeature.datasetAttributes.CombinationofPrimaryandHighlightColor; // Apply styles. Fill is primary fur color, stroke is secondary fur color. switch (furColors) { case 'Black+': return { fillColor: 'black', pointRadius: 8, }; break; case 'Cinnamon+': return { fillColor: '#8b0000', pointRadius: 8, }; break; case 'Cinnamon+Gray': return { fillColor: '#8b0000', strokeColor: 'gray', pointRadius: 6, }; break; case 'Cinnamon+White': return { fillColor: '#8b0000', strokeColor: 'white', pointRadius: 6, }; break; case 'Gray+': return { fillColor: 'gray', pointRadius: 8, }; break; case 'Gray+Cinnamon': return { fillColor: 'gray', strokeColor: '#8b0000', pointRadius: 6, }; break; case 'Gray+Cinnamon, White': return { fillColor: 'silver', strokeColor: '#8b0000', pointRadius: 6, }; break; case 'Gray+White': return { fillColor: 'gray', strokeColor: 'white', pointRadius: 6, }; break; default: // Color not defined. return { fillColor: 'yellow', pointRadius: 8, }; break; } }
JavaScript
function setStyle(params) { // Get the dataset feature, so we can work with all of its attributes. const datasetFeature = params.feature; // Get all of the needed dataset attributes. const furColors = datasetFeature.datasetAttributes.CombinationofPrimaryandHighlightColor; // Apply styles. Fill is primary fur color, stroke is secondary fur color. switch (furColors) { case 'Black+': return { fillColor: 'black', pointRadius: 8, }; break; case 'Cinnamon+': return { fillColor: '#8b0000', pointRadius: 8, }; break; case 'Cinnamon+Gray': return { fillColor: '#8b0000', strokeColor: 'gray', pointRadius: 6, }; break; case 'Cinnamon+White': return { fillColor: '#8b0000', strokeColor: 'white', pointRadius: 6, }; break; case 'Gray+': return { fillColor: 'gray', pointRadius: 8, }; break; case 'Gray+Cinnamon': return { fillColor: 'gray', strokeColor: '#8b0000', pointRadius: 6, }; break; case 'Gray+Cinnamon, White': return { fillColor: 'silver', strokeColor: '#8b0000', pointRadius: 6, }; break; case 'Gray+White': return { fillColor: 'gray', strokeColor: 'white', pointRadius: 6, }; break; default: // Color not defined. return { fillColor: 'yellow', pointRadius: 8, }; break; } }
Zastosuj styl do warstwy mapy zbioru danych
Aby zastosować style w funkcji stylu elementu:
- Pobierz warstwę mapy zbioru danych, wywołując
map.getDatasetFeatureLayer()i przekazując identyfikator zbioru danych. - Zastosuj styl, ustawiając opcje stylu elementu (np.
styleOptions) lub funkcję (np.setStyle) w warstwie zbioru danych.
TypeScript
// Dataset ID for NYC park data. const datasetId = 'a75dd002-ad20-4fe6-af60-27cd2ed636b4'; const datasetLayer = innerMap.getDatasetFeatureLayer(datasetId); datasetLayer.style = styleOptions;
JavaScript
// Dataset ID for NYC park data. const datasetId = 'a75dd002-ad20-4fe6-af60-27cd2ed636b4'; const datasetLayer = innerMap.getDatasetFeatureLayer(datasetId); datasetLayer.style = styleOptions;
Usuwanie stylu z warstwy
Aby usunąć styl z warstwy, ustaw wartość style na null:
featureLayer.style = null;
Możesz też zwrócić null z funkcji stylu cechy, np. jeśli chcesz, aby podzbiór cech pozostał niewidoczny.
Dodawanie tekstu z informacją o pochodzeniu danych
Gdy wyświetlasz w Mapach Google przesłane zbiory danych, mapa musi zawierać wymagane atrybucje. Informacja o pochodzeniu danych nie może zasłaniać logo Google ani zakłócać jego wyświetlania.
Jednym ze sposobów dodania informacji o pochodzeniu danych jest użycie elementów sterujących niestandardowych, aby umieścić dowolny kod HTML w standardowych miejscach na mapie. Poniższe fragmenty kodu pokazują kod HTML i CSS użyty w informacjach o pochodzeniu danych w tym przykładzie:
<gmp-map
center="40.757815, -73.933123"
zoom="11"
map-id="5cd2c9ca1cf05670"
map-type-control="false">
<div id="attribution" slot="control-block-end-inline-start">
Data source: NYC Open Data
</div>
</gmp-map>
#attribution { background-color: rgba(255, 255, 255, 0.7); font-family: 'Roboto', 'Arial', sans-serif; font-size: 10px; padding: 2px; margin: 2px; }