
Use the detect change tool track_changes to quickly identify and visualize changes on the Earth's surface over time.
Instead of manually searching for differences, this tool uses an AI model to compare geospatial data between two different years. It automatically generates a heatmap that highlights areas of change, such as urban development or environmental and agricultural shifts.
This heatmap can then be used to identify areas of interest to explore and understand what type of change occurred, using historical imagery or historical Street View.
How it works
The detect change tool utilizes the AlphaEarth Foundations Satellite Embedding dataset, a specialized global AI model that understands unique patterns across geospatial data. Unlike standard historical imagery, where you must visually toggle between dates to spot differences, this new tool does the heavy lifting for you. It uses AI to blend multiple satellite and geospatial data streams together to quantify change between two years.
This tool calculates change on a pixel level, and the resulting layer visualizes where change has occurred between those two years at 10-meter resolution.
Detect change versus historical imagery
Understanding the differences between the detect change and historical imagery tools is key to a successful analysis. While detecting year-over-year change with detect change provides pixel-level precision, historical imagery remains an important tool for identifying the nature of that change. By using both in tandem, you can move from a high-level detection to a granular visual verification in a single workflow.
| Detect change | Historical imagery | |
|---|---|---|
| Change detection functionality | Automated change detection using geospatial embeddings | Manual visual inspection of change |
| Imagery | Multi-modal embeddings including optical, multispectral, thermal, and radar imagery | Optical composite of the best available visual imagery |
| Spatial resolution | Consistent 10m resolution global embeddings | Ranges from 15m (satellite) to 0.15m (high-res aerial photography) |
| Temporal frequency | Annual only intervals | Irregular intervals (granularity can be monthly) |
Generate custom change detection layers
- Open an existing project or create a new one in Google Earth.
Click
 Show historical imagery
track_changes
Detect change or Tools
track_changes
Detect change, which opens
the tool's dialog and a preview of the heatmap at 40m resolution.
Show historical imagery
track_changes
Detect change or Tools
track_changes
Detect change, which opens
the tool's dialog and a preview of the heatmap at 40m resolution.- To see a preview of the detected change in the area, pan around the map.
- Choose two years for comparison. The preview automatically updates to show the detected change between the selected years.
- Change the opacity to adjust the transparency of the preview.
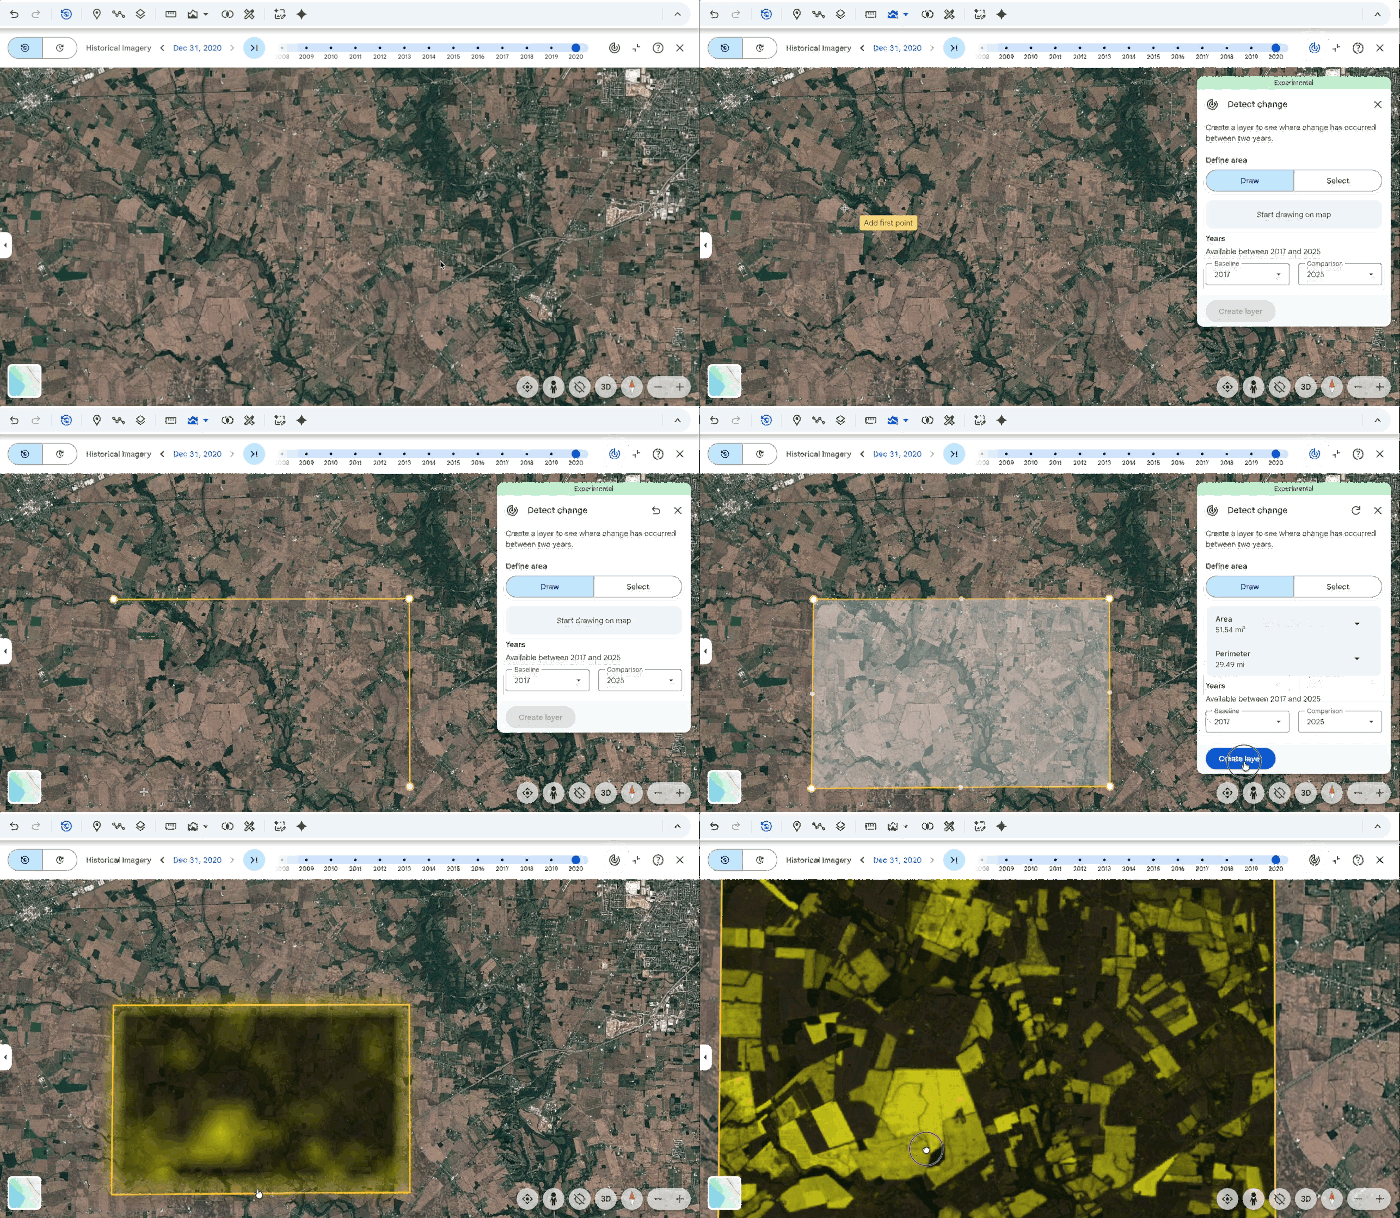
To see the full resolution of the change in an area, draw a polygon around your area of interest, or select an existing polygon to get started.
- Select points on the map to draw an area of interest.
- To remove a point, click undo Undo at the top right.
- To redraw the area of interest, click refresh Start new.
Select Create layer to start the analysis process.
When analysis is complete, a data layer will be added to your project's Map contents panel. This data layer is a heatmap at 10m resolution that shows areas where change was detected between the two years.
- Select the new data layer to open an inspector panel on the right. Learn how to manage and style change detection data layers.
Try now in Google Earth on web
Verify results
Because the AI model behind the detect change tool combines many types of satellite and geospatial data sources, there may be areas of change highlighted that may not be relevant to your workflow or visible in imagery (such as soil moisture shifts, flooding, changes in biomass, and more). We recommend using Google Earth's visual tools to verify findings:
- Historical imagery: Switch to historical imagery to see high-resolution snapshots of the two comparison years and confirm the type of change is relevant.
- Historical Street View: Jump to ground level using Street View to confirm the nature of the change (for example, verifying if a detected change is a new warehouse or a cleared forest).