
As your SoC design progresses from simulation to silicon implementation, your control and understanding of the system's state drops dramatically. To help bring up and debug low-level software and hardware, it is critical to have good debugging support built into the hardware – in this case, the Coral NPU processor core.
The RISC-V organization describes a standard architecture for debug support on RISC-V hardware platforms, as published in the RISC-V Debug Specification. This specification defines the JTAG interface to allow debugging tools and components to target a variety of hardware platforms – see 6.1. JTAG Debug Transport Module.
RISC-V Debug Specification – System Overview
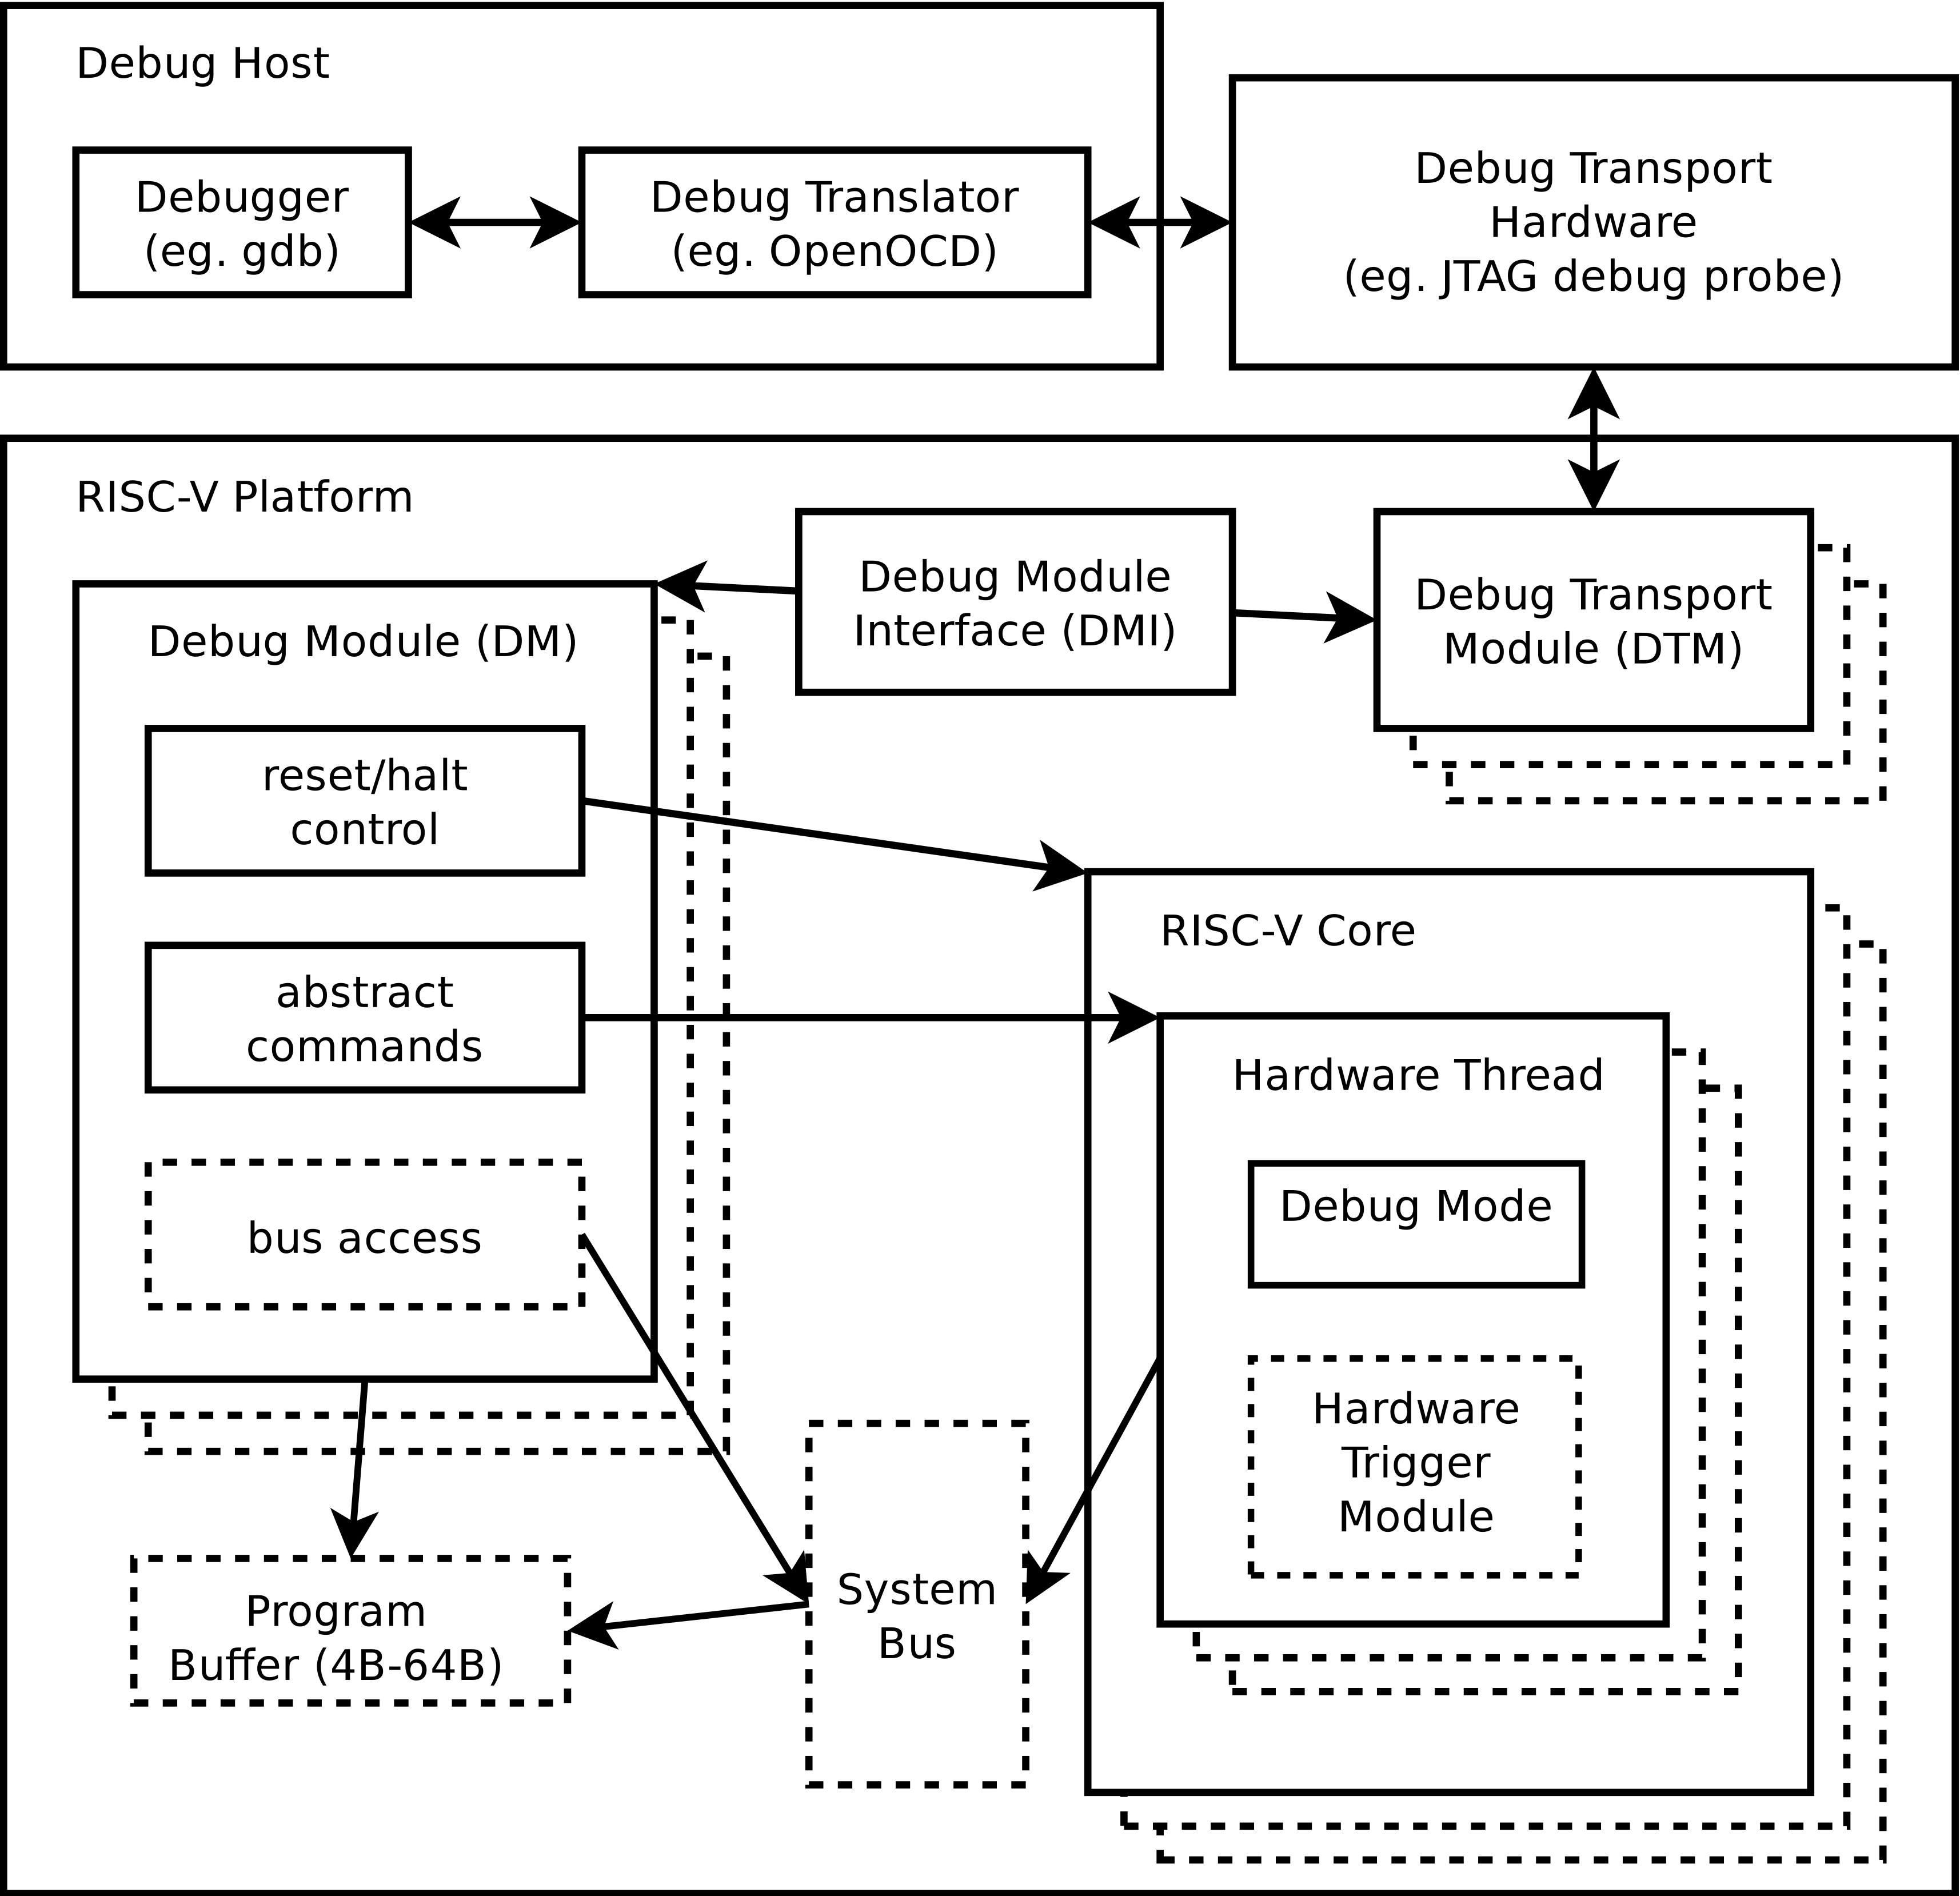
- Debug Module (DM): A hardware block that controls one or more harts (hardware threads), allowing for run control (halt, resume, step) and access to registers and memory.
- Debug Transport Module (DTM): Manages the communication protocol between the host computer and the target, utilizing JTAG as the physical transport layer.
- Debug Module Interface (DMI): The internal interface between the DTM and the DM, allowing the debugger to send abstract commands to the hardware.
- Abstract commands: High-level commands used to perform actions like reading/writing registers or memory without the debugger needing to know specific microarchitectural details.
JTAG hardware interface
Coral NPU includes a debug module that implements a subset of the RISC-V specification, allowing control over core execution, registers, and memory access. The external debugger – a GNU debugger (GDB), for example – can control the NPU core as well as read and write registers and memory.
In Coral NPU, the debug module must be driven through the industry-standard 1149.1 JTAG Test Access Port (TAP). The JTAG TAP allows access to arbitrary JTAG registers by first selecting one using the JTAG instruction register (IR) and then accessing it through the JTAG data register (DR).
Coral NPU provides the JTAG standard I/O signals (pins):
- TCK (Test Clock): Clocks data and drives the internal TAP state machine.
- TMS (Test Mode Select): Sampled on the rising edge of TCK.
- TDI (Test Data In): Accepts serial instructions and data shifted into the device on the rising edge of TCK.
- TDO (Test Data Out): Outputs serial data from the internal registers on the falling edge of TCK.
- TRST (Test Reset): Optional active-low pin used to asynchronously reset the TAP state machine.
The JTAG pins control an on-chip Debug Transport Module (DTM). The DTM contains a standard JTAG TAP that translates serial scan chain inputs into read/write commands for the debug module, which ultimately halts, steps, and resets the RISC-V hardware core.
The RISC-V debug standard mandates strict constraints on the JTAG interface layer to ensure cross-vendor debugger compatibility:
- Instruction Register (IR) width: The RISC-V TAP instruction register must be at least 5 bits wide.
- Reset default: Upon a JTAG hardware or software reset, the IR register must default to 00001, which maps directly to the IDCODE instruction.
- Core registers: At minimum, the JTAG DTM implementation must provide
access to these registers:
BYPASS: all onesIDCODE: to identify a specific silicon versionDTMCS: Debug Transport Module Control and StatusDMI: Debug Module Interface Access
The bit field definitions for these registers are given in the IEEE standard 1149.1-2013 and in section 6.1.2. JTAG DTM Registers of the RISC-V debug specification.
GNU debugger integration with RISC-V
The GNU debugger (GDB) can provide the user-facing interface for the Coral NPU RISC-V debug module. This arrangement typically uses a GDB server as an intermediary, for example OpenOCD (Open On-Chip Debugger). Tools such as OpenOCD translate GDB commands into hardware instructions (JTAG signals) to debug firmware running on a microcontroller such as Coral NPU.
- Remote debugging: GDB communicates with a GDB server using the Remote Serial Protocol (RSP). The GDB server translates these requests into RISC-V-specific DMI commands for the hardware.
- Register support: GDB recognizes standard RISC-V register sets, including general-purpose registers (x0–x31), floating-point registers (f0–f31), and Control and Status Registers (CSRs).
- RISC-V-specific commands: GDB includes specialized commands like
set
riscv numeric-register-names [on|off]
to toggle between architectural names (for example,x1) and ABI names (for example,ra).
Hardware debugging with timing waveforms
You can use the Coral NPU Verilator simulator to generate timing diagrams (waveforms) for Coral NPU signals.
To generate the waveform trace diagrams for a given input ELF program, use these commands:
bazel build //tests/verilator_sim:rvv_core_mini_axi_sim
bazel-bin/tests/verilator_sim/rvv_core_mini_axi_sim --trace --binary [path/file.elf]
There are several options you can use to view the waveform traces, see: