Page Summary
-
Data-driven styling allows you to upload custom geospatial datasets (GeoJSON, CSV, KML) and visualize them on vector maps using points, polylines, and polygons.
-
Datasets are managed through Google Cloud Console or Google Cloud Shell and are associated with map styles and IDs for display.
-
You can customize the visual appearance of data features based on their properties and enable click event interactions.
-
Data-driven styling enables the creation of dynamic and interactive data visualizations for highlighting locations, geographical features, and areas on maps.
Data-driven styling for datasets lets you upload your own geospatial datasets, apply custom styling to their data features, and display those data features on maps. With data-driven styling for datasets, you can create data visualizations based on point, polyline, and polygon geometries, and make data features respond to click events. Data-driven styling for datasets is supported on vector maps only (a map ID is required).
Get started with data-driven styling for datasets
Add custom geospatial datasets
Add your custom data using Google Cloud Console or Google Cloud Shell. Each dataset has a unique ID, which you can associate with a map style. The following data formats are supported:
- GeoJSON
- Comma-separated (CSV)
- KML
For details about dataset requirements and limitations, see Create and manage a dataset
Style data features
Once your custom data has been uploaded and associated to a map style and map ID, you can style data features for visual impact, and make features respond to click events.
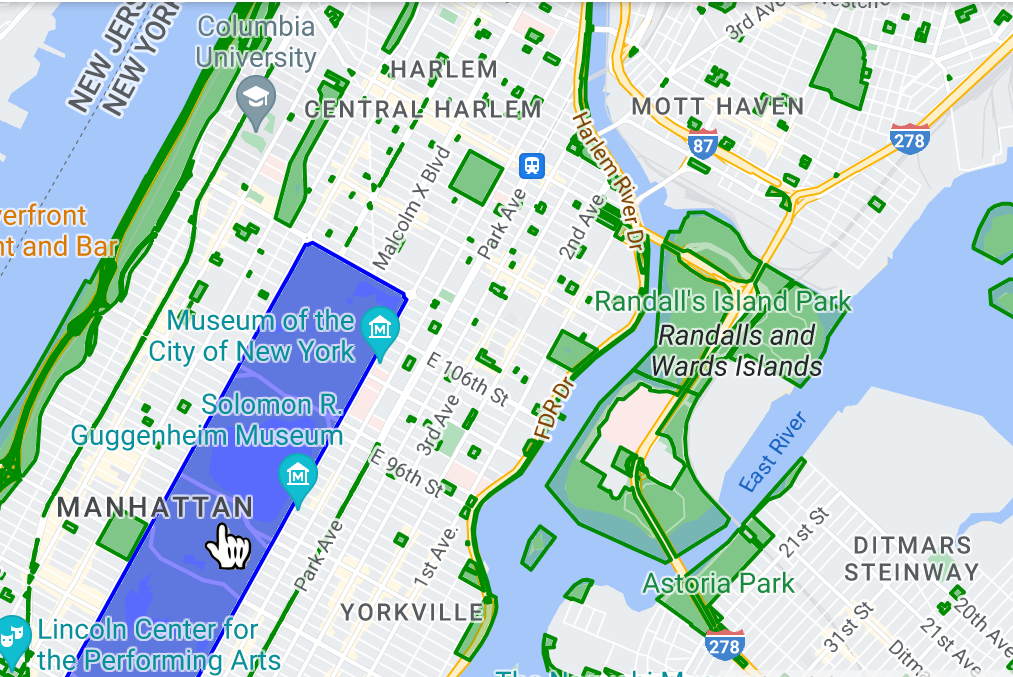
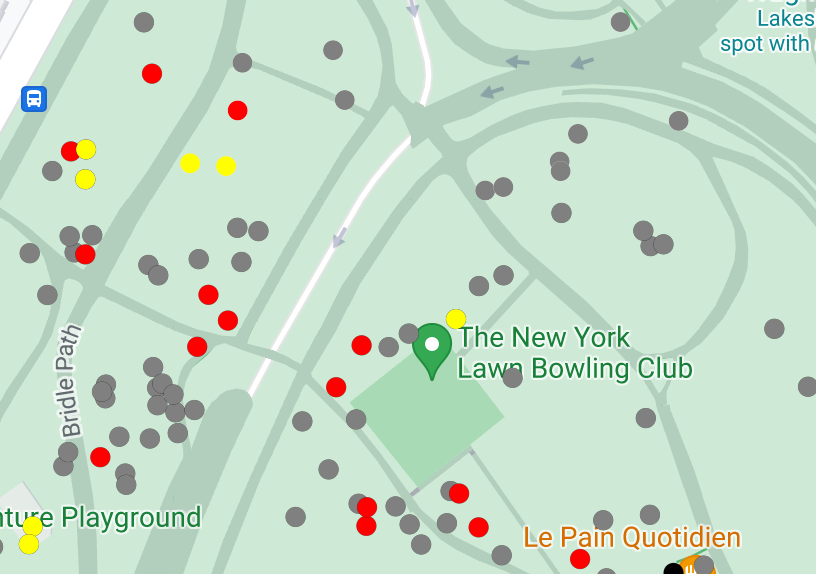
Style point data to show specific locations on the map.
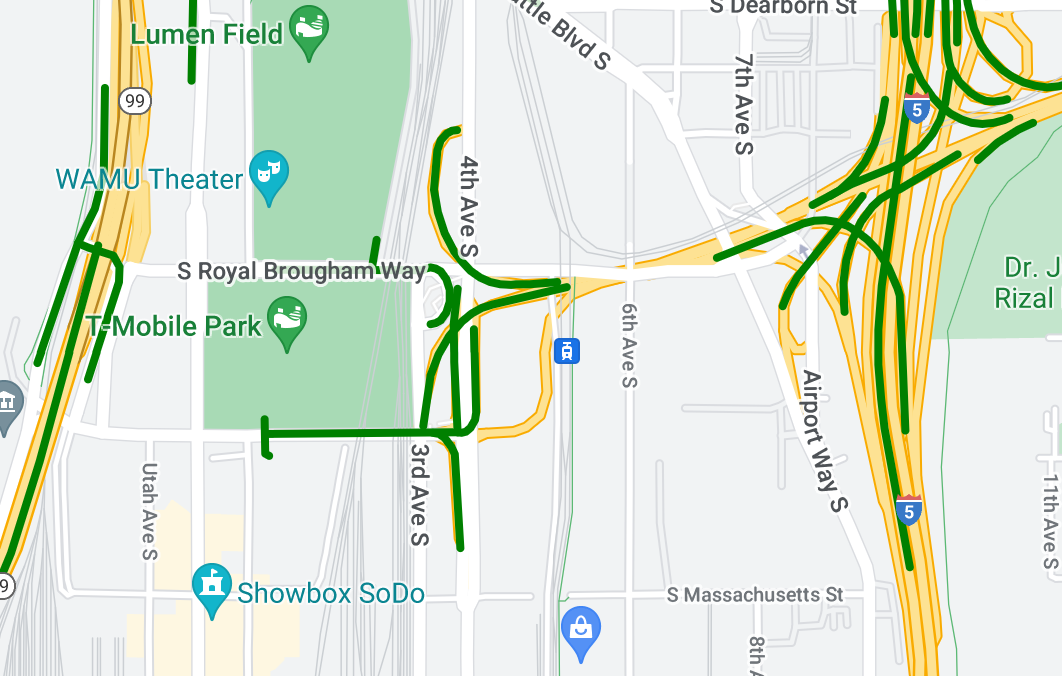
Style polyline data to highlight geographical features.
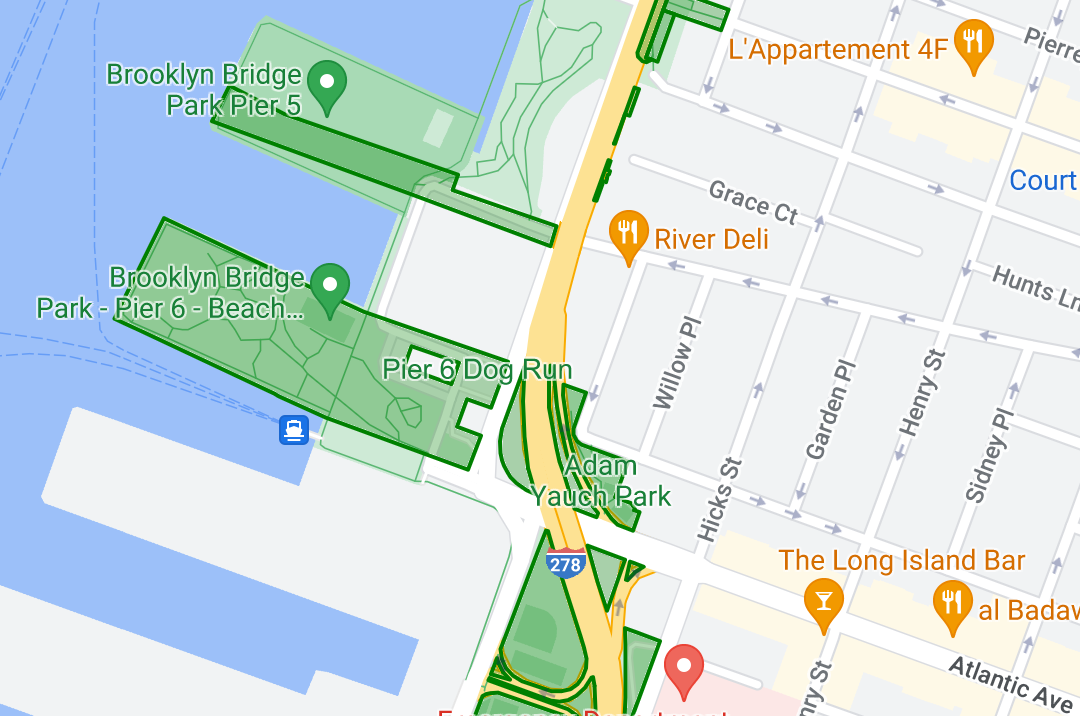
Style polygon data to highlight geographical areas.
Make data features respond to click events by adding an event listener.