

FeatureStyleFunction,
to miejsce, w którym definiujesz logikę selektywnego stylowania cech w zbiorze danych. Na podstawie tej logiki zwraca ona
FeatureStyleOptions. Jeśli logika stylowania nie jest wymagana, możesz użyć FeatureStyleOptions, aby bezpośrednio ustawić style. Na tej stronie dowiesz się, jak dodać zbiór danych do mapy i zastosować styl.
Wymagania wstępne
Zanim przejdziesz dalej, musisz mieć identyfikator mapy, styl mapy i identyfikator zbioru danych.
Powiąż identyfikator zbioru danych ze stylem mapy
Aby powiązać zbiór danych ze stylem mapy, którego używasz:
- W konsoli Google Cloud otwórz stronę Zbiory danych.
- Kliknij nazwę zbioru danych. Pojawi się strona Szczegóły zbioru danych.
- Kliknij kartę Podgląd.
- Przewiń do sekcji DODAJ STYL MAPY i kliknij ją.
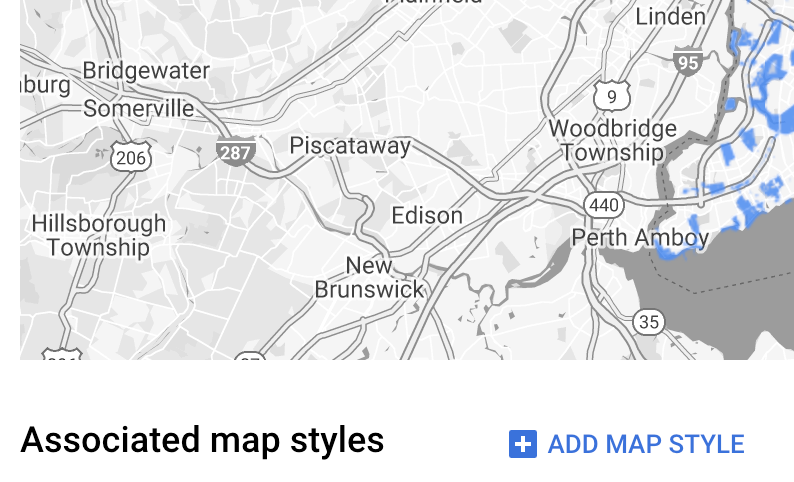
- Kliknij pola wyboru obok stylów mapy, które chcesz powiązać, a następnie kliknij ZAPISZ.
Używanie prostych reguł stylu
Najprostszym sposobem na stylizowanie cech jest przekazanie FeatureStyleOptions, aby zdefiniować atrybuty stylu, takie jak kolor, krycie i grubość linii. Zastosuj opcje stylu cechy bezpośrednio do warstwy cech zbioru danych lub użyj ich w połączeniu z FeatureStyleFunction.
TypeScript
const styleOptions = { strokeColor: 'green', strokeWeight: 2, strokeOpacity: 1, fillColor: 'green', fillOpacity: 0.3, };
JavaScript
const styleOptions = { strokeColor: 'green', strokeWeight: 2, strokeOpacity: 1, fillColor: 'green', fillOpacity: 0.3, };
Używanie deklaratywnych reguł stylu
Użyj FeatureStyleFunction, aby deklaratywnie ustawić reguły stylu i zastosować je do całego zbioru danych. Zastosuj FeatureStyleOptions do cechy na podstawie wartości atrybutów zbioru danych. Możesz też zwrócić null z funkcji stylu cechy, na przykład jeśli chcesz, aby podzbiór cech pozostał niewidoczny. Ten przykład pokazuje funkcję stylu, która koloruje zestaw punktów na podstawie atrybutów danych:
TypeScript
function setStyle(params: { feature: google.maps.Feature }) { // Get the dataset feature, so we can work with all of its attributes. const datasetFeature = params.feature as google.maps.DatasetFeature; // Get all of the needed dataset attributes. const furColors = datasetFeature.datasetAttributes.CombinationofPrimaryandHighlightColor; // Apply styles. Fill is primary fur color, stroke is secondary fur color. switch (furColors) { case 'Black+': return { fillColor: 'black', pointRadius: 8, }; break; case 'Cinnamon+': return { fillColor: '#8b0000', pointRadius: 8, }; break; case 'Cinnamon+Gray': return { fillColor: '#8b0000', strokeColor: 'gray', pointRadius: 6, }; break; case 'Cinnamon+White': return { fillColor: '#8b0000', strokeColor: 'white', pointRadius: 6, }; break; case 'Gray+': return { fillColor: 'gray', pointRadius: 8, }; break; case 'Gray+Cinnamon': return { fillColor: 'gray', strokeColor: '#8b0000', pointRadius: 6, }; break; case 'Gray+Cinnamon, White': return { fillColor: 'silver', strokeColor: '#8b0000', pointRadius: 6, }; break; case 'Gray+White': return { fillColor: 'gray', strokeColor: 'white', pointRadius: 6, }; break; default: // Color not defined. return { fillColor: 'yellow', pointRadius: 8, }; break; } }
JavaScript
function setStyle(params) { // Get the dataset feature, so we can work with all of its attributes. const datasetFeature = params.feature; // Get all of the needed dataset attributes. const furColors = datasetFeature.datasetAttributes.CombinationofPrimaryandHighlightColor; // Apply styles. Fill is primary fur color, stroke is secondary fur color. switch (furColors) { case 'Black+': return { fillColor: 'black', pointRadius: 8, }; break; case 'Cinnamon+': return { fillColor: '#8b0000', pointRadius: 8, }; break; case 'Cinnamon+Gray': return { fillColor: '#8b0000', strokeColor: 'gray', pointRadius: 6, }; break; case 'Cinnamon+White': return { fillColor: '#8b0000', strokeColor: 'white', pointRadius: 6, }; break; case 'Gray+': return { fillColor: 'gray', pointRadius: 8, }; break; case 'Gray+Cinnamon': return { fillColor: 'gray', strokeColor: '#8b0000', pointRadius: 6, }; break; case 'Gray+Cinnamon, White': return { fillColor: 'silver', strokeColor: '#8b0000', pointRadius: 6, }; break; case 'Gray+White': return { fillColor: 'gray', strokeColor: 'white', pointRadius: 6, }; break; default: // Color not defined. return { fillColor: 'yellow', pointRadius: 8, }; break; } }
Zastosuj styl do warstwy cech zbioru danych
Aby zastosować style w funkcji stylu cechy:
- Pobierz warstwę cech zbioru danych, wywołując
map.getDatasetFeatureLayer()i przekazując identyfikator zbioru danych. - Zastosuj styl, ustawiając opcje stylu cechy (np.
styleOptions) lub funkcję (np.setStyle) w warstwie zbioru danych.
TypeScript
// Dataset ID for NYC park data. const datasetId = 'a75dd002-ad20-4fe6-af60-27cd2ed636b4'; const datasetLayer = innerMap.getDatasetFeatureLayer(datasetId); datasetLayer.style = styleOptions;
JavaScript
// Dataset ID for NYC park data. const datasetId = 'a75dd002-ad20-4fe6-af60-27cd2ed636b4'; const datasetLayer = innerMap.getDatasetFeatureLayer(datasetId); datasetLayer.style = styleOptions;
Usuwanie stylu z warstwy
Aby usunąć styl z warstwy, ustaw style na null:
featureLayer.style = null;
Możesz też zwrócić null z funkcji stylu cechy, na przykład jeśli chcesz, aby podzbiór cech pozostał niewidoczny.
Dodawanie tekstu informacji o autorze
Gdy wyświetlasz przesłane zbiory danych w Mapach Google, na mapie muszą być widoczne wszystkie wymagane informacje o autorze. Tekst informacji o autorze nie może zasłaniać ani zakłócać wyświetlania logo Google.
Jednym ze sposobów dodania tekstu informacji o autorze jest użycie niestandardowych elementów sterujących aby umieścić dowolny kod HTML w standardowych miejscach na mapie. Poniższe fragmenty kodu pokazują kod HTML i CSS używany w tym przykładzie do informacji o autorze:
<gmp-map
center="40.757815, -73.933123"
zoom="11"
map-id="5cd2c9ca1cf05670"
map-type-control="false">
<div id="attribution" slot="control-block-end-inline-start">
Data source: NYC Open Data
</div>
</gmp-map>
#attribution { background-color: rgba(255, 255, 255, 0.7); font-family: 'Roboto', 'Arial', sans-serif; font-size: 10px; padding: 2px; margin: 2px; }