
Page Summary
-
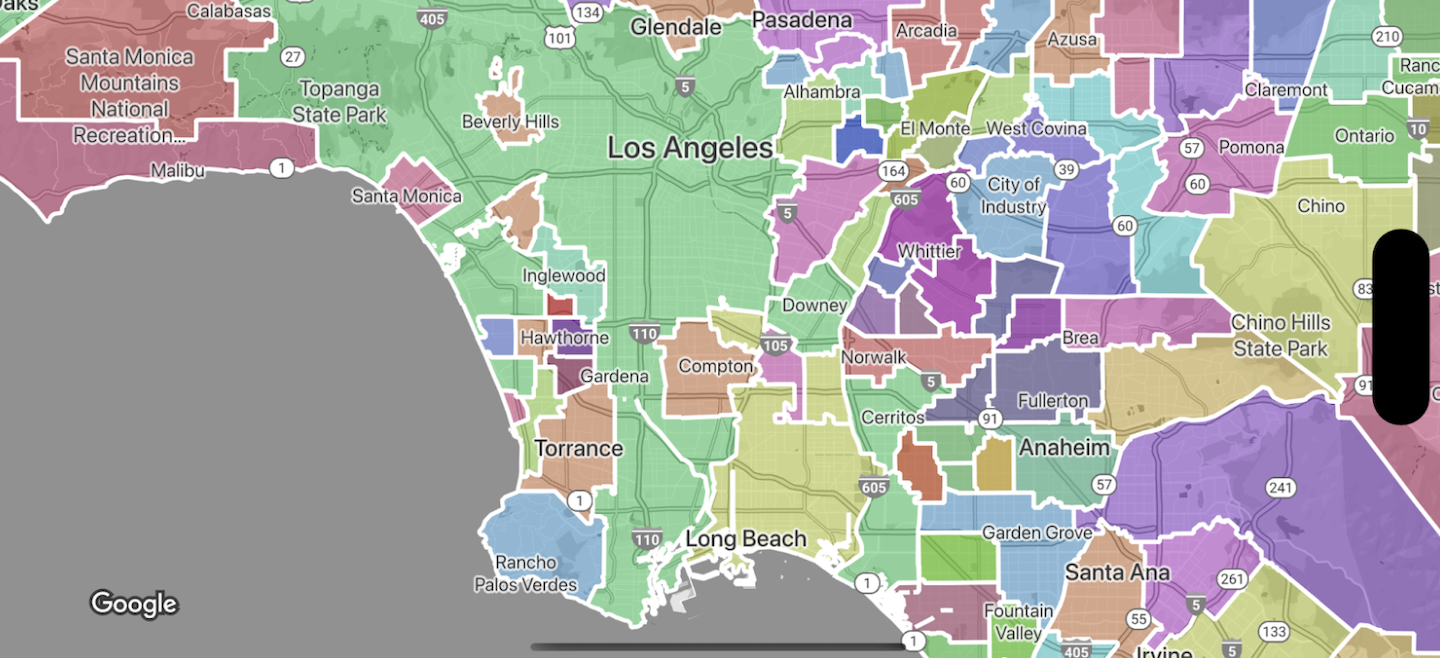
Data-driven styling enables applying custom styles to Google's administrative boundary polygons on your maps, targeting regions by place ID.
-
You can select specific feature types like countries, states, localities, and postal codes to display on your map.
-
Boundary polygons can be styled with fill and stroke properties to create visual effects or choropleth maps.
-
Google provides boundary data for various countries, and coverage details are available in the documentation.
-
Data-driven styling is available across Android, iOS, and JavaScript platforms.
Data-driven styling for boundaries lets you access Google's polygons for administrative boundaries, apply styling to boundary polygons, display them on your maps.
Data-driven styling for boundaries lets you target regions by place ID, and apply custom styling to boundary polygons on the map. Each feature type represents a type of region; you select which feature types to enable when configuring a map style. Consult Google boundaries coverage to see per-country boundary coverage.
Feature types
Data-driven styling provides access to Google boundaries for feature types that represent administrative areas. Administrative areas are categorized by function, for example country, state, locality, and postal code. Feature types are arranged by administrative level, the structure of which varies by country. These include:
GMSFeatureTypeCountry— The national political entity, typically the highest order type.GMSFeatureTypeAdministrativeAreaLevel1- A first-order civil entity below the country level. Within the United States, these administrative levels are states.GMSFeatureTypeAdministrativeAreaLevel2— A second-order civil entity below the country level. Within the United States, these administrative levels are counties.GMSFeatureTypeLocality— An incorporated city or town political entity.GMSFeatureTypePostalCode— A postal code, as used to address postal mail within the country.GMSFeatureTypeSchoolDistrict— A school district; includes unified, elementary, and secondary.
Administrative areas are represented on the map as feature layers; each type has its own layer. Feature layers are enabled per map style. You can choose which feature layers to enable when setting up your map style in the Google Cloud console.
Style boundary polygons
You can apply styles to boundary polygons for fill (color, opacity), and stroke (color, opacity, stroke weight). Use styling to:
- Style a boundary polygon or show all the boundaries for a feature type.
- Create a choropleth map.
Google boundaries coverage shows per-country availability of feature types.