
Page Summary
-
Data-driven styling allows you to upload, style, and display custom geospatial datasets (GeoJSON, CSV, KML) on vector maps using Google Maps Platform.
-
Datasets are associated with map styles and IDs, enabling data visualization and interactivity based on point, polyline, and polygon geometries.
-
Public datasets, when linked to a map ID, become accessible to anyone with the app using that ID, requiring awareness regarding data sensitivity.
-
Data features can be styled for visual impact and interactivity, such as highlighting locations, geographical features, areas, and responding to click events.
-
Rendering a large number of data features might impact app performance, potentially causing lag or stability issues during zoom or rotate operations.
Data-driven styling for datasets lets you upload your own geospatial datasets, apply custom styling to their data features, and display those data features on maps. With data-driven styling for datasets, you can create data visualizations based on point, polyline, and polygon geometries, and make data features respond to click events. Data-driven styling for datasets is supported on vector maps only (a map ID is required).
Get started with data-driven styling for datasets
Add custom geospatial datasets
Add your custom data using Google Cloud Console or Google Cloud Shell. Each dataset has a unique ID, which you can associate with a map style. The following data formats are supported:
- GeoJSON
- Comma-separated (CSV)
- KML
For details about dataset requirements and limitations, see Create and manage a dataset
About public datasets
In order to style a dataset you must associate a map style with a map ID, which also associates the dataset to the map ID. In an app, developers can reference that map ID, and any map style and geospatial data associated with it. No additional access control is applied to the geospatial data, making the geospatial data effectively publicly available to anyone with the app.
Style data features
Once your custom data has been uploaded and associated to a map style and map ID, you can style data features for visual impact, and make features respond to click events.
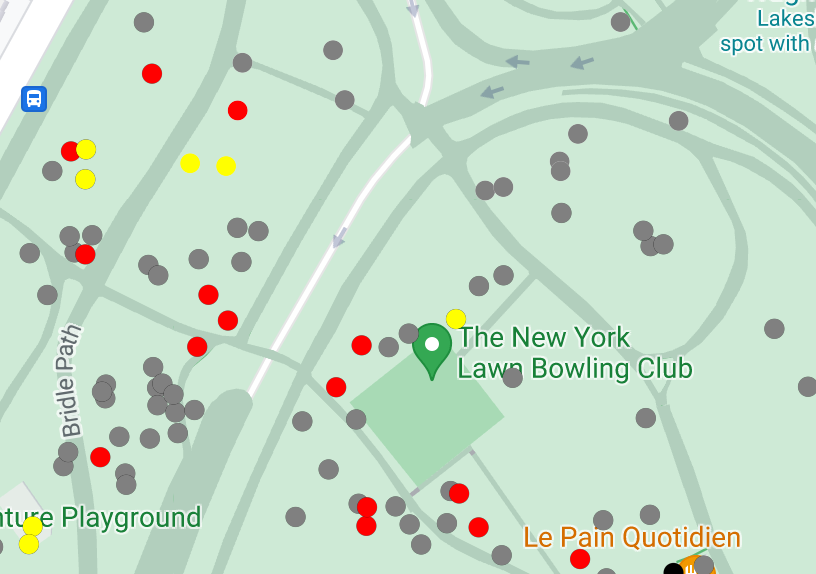
Style point data to show specific locations on the map.
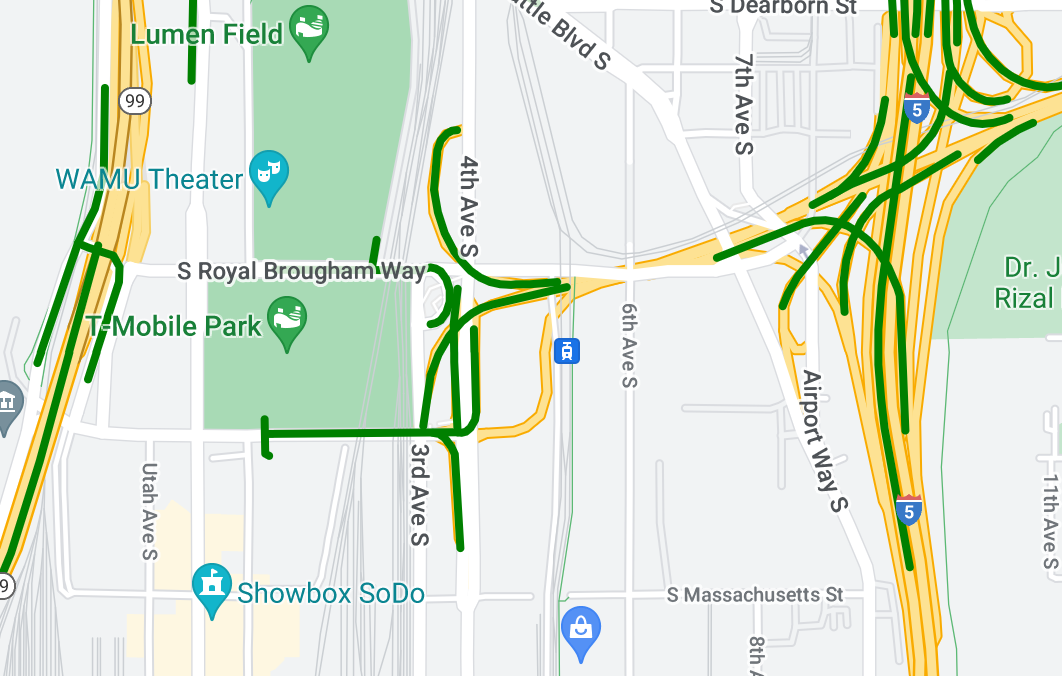
Style polyline data to highlight geographical features.
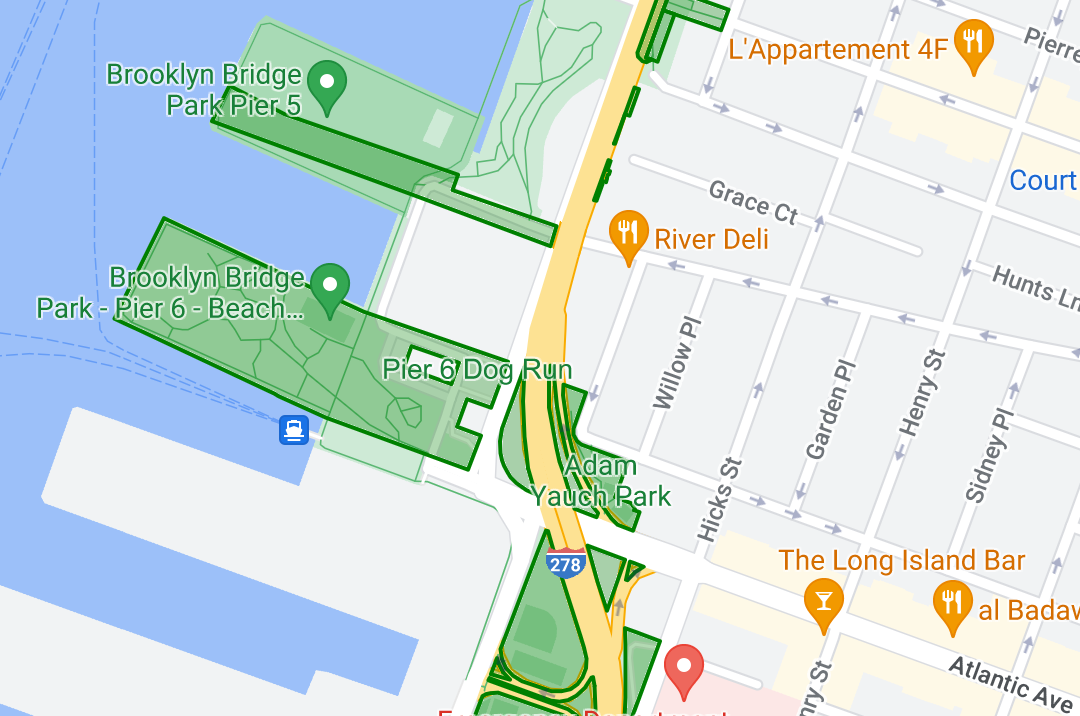
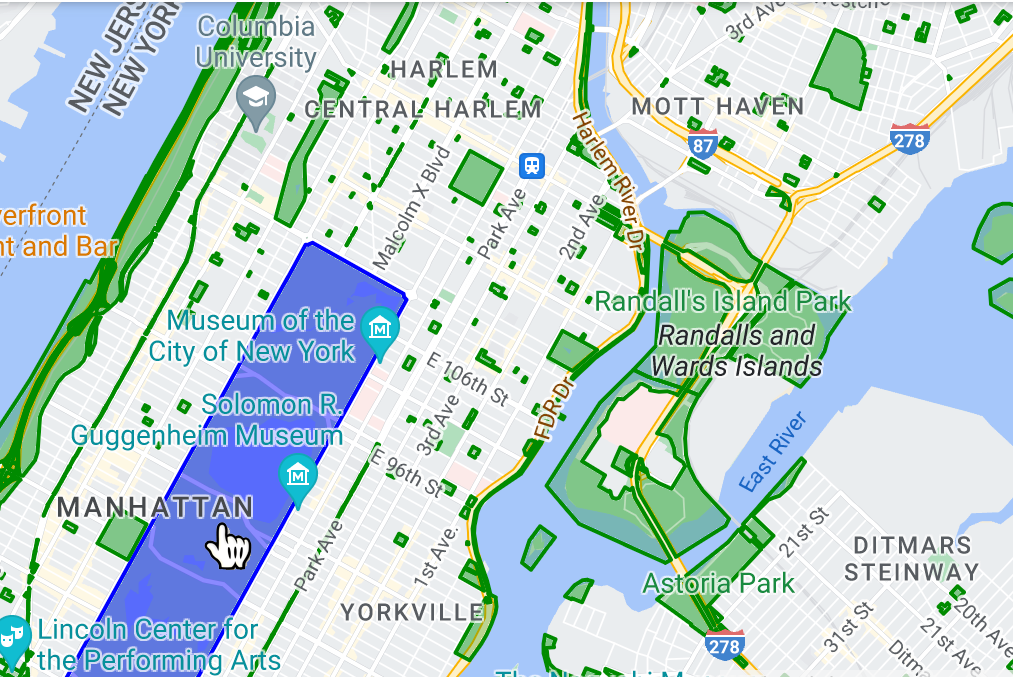
Style polygon data to highlight geographical areas.
Make data features respond to click events by adding an event listener.
Performance when rendering a large number of data features
When rendering a large number of data features, you might notice performance issues in your app. For example, you might notice a performance lag or stability issues with the app during a zoom or rotate.