
Overview

Standard location data can tell you what's nearby, but it often fails to answer the more important question: "How good is this area for me?" Your users' needs are nuanced. A family with young children has different priorities when compared to a young professional with a dog. To help them make confident decisions, you need to provide insights that reflect these specific needs. A custom location score is a powerful tool to deliver this value and create a significant differentiated user experience.
This document describes how to create custom, multi-faceted location scores using the Places Insights dataset in BigQuery. By transforming POI data into meaningful metrics you can enrich your real estate, retail, or travel applications and provide your users with the relevant information they need. We also provide an option to use generative AI in BigQuery as a powerful way to compute your location scores.
Drive Business Value with Tailored Scores
The following examples illustrate how you can translate raw location data into the powerful, user-centric metrics to enhance your application.
- Real Estate Developers can create a "Family-Friendliness Score" or a "Commuter's Dream Score" to help buyers and renters choose the perfect neighborhood that matches their lifestyle, leading to increased user engagement, higher quality leads and faster conversions.
- Travel & Hospitality Engineers can build a "Nightlife Score" or a "Sightseer's Paradise Score" to help travelers pick a hotel that matches their vacation style, boosting booking rates and customer satisfaction
- Retail Analysts can generate a "Fitness & Wellness Score" to identify the optimal location for a new gym or health food store based on nearby complementary businesses, maximizing potential to target the right user demographic.
In this guide, you will learn a flexible, three-part methodology for building any kind of custom location score using Places data directly in BigQuery. We will illustrate this pattern by building two distinct example scores: a Family-Friendliness Score and a Pet-Owner Paradise Score. This approach lets you move beyond place counts and take advantage of the rich, detailed attributes within the Places Insights dataset. You can use information like business hours, whether a place is good for children, or if it allows dogs, to create sophisticated and meaningful metrics for your users.
Solution Workflow
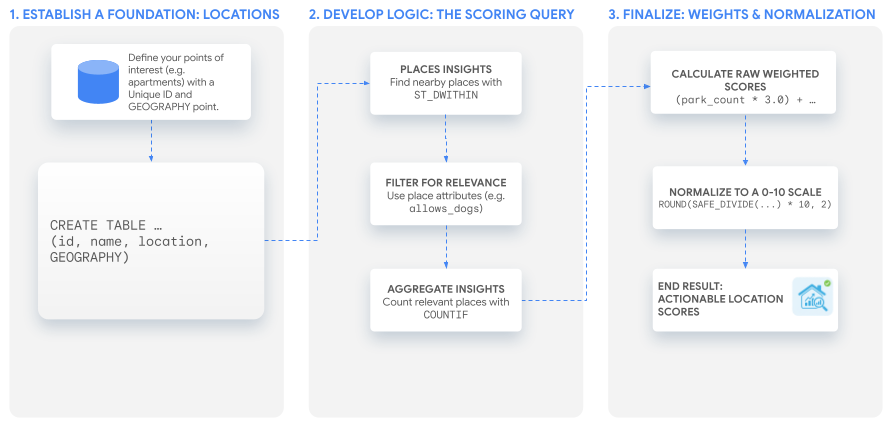
This tutorial uses a single, powerful SQL query to build a custom score that you can adapt to any use case. We'll walk through this process by building our two example scores for a hypothetical set of apartment listings.
To explore this workflow in an interactive environment, run the following
notebook. It demonstrates how to use the
AI.GENERATE function within
BigQuery to create a location score.
 View source on GitHub
Prerequisites
Before you begin, follow these instructions to set up Places Insights.
1. Establish a Foundation: Your Locations of Interest
Before you can create scores, you need a list of the locations you want to
analyze. The first step is to ensure this data exists as a table in BigQuery.
The key is to have a unique identifier for each location and a GEOGRAPHY
column that stores its coordinates.
You can create and populate a table of locations to score with a query like this:
CREATE OR REPLACE TABLE `your_project.your_dataset.apartment_listings`
(
  id INT64,
  name STRING,
  location GEOGRAPHY
);

INSERT INTO `your_project.your_dataset.apartment_listings` VALUES
  (1, 'The Downtowner', ST_GEOGPOINT(-74.0077, 40.7093)),
  (2, 'Suburban Oasis', ST_GEOGPOINT(-73.9825, 40.7507)),
  (3, 'Riverside Lofts', ST_GEOGPOINT(-73.9470, 40.8079))
  -- More rows can be added here
  . . . ;
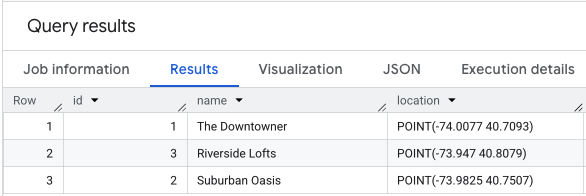
Performing a SELECT * on your location data would look similar to this.
2. Develop the Core Logic: The Scoring Query
With your locations established, the next step is to find, filter, and count the
nearby places that are relevant to your custom score. This is all done within a
single SELECT statement.
Find What's Nearby with a Geospatial Search
First, you need to find all the places from the Places Insights dataset that are
within a certain distance of each of your locations. The BigQuery function
ST_DWITHIN is perfect for this. We'll perform a JOIN between our
apartment_listings table and the places_insights table to find all places
within a 800-meter radius. A LEFT JOIN ensures that all your original
locations are included in the results, even if no matching places are found
nearby.
Filter for Relevance with Advanced Attributes
This is where you translate the abstract concept of a score into concrete data filters. For our two example scores, the criteria are different:
- For the "Family-Friendliness Score", we care about parks, museums, and restaurants that are explicitly good for children.
- For the "Pet-Owner Paradise Score", we care about parks, veterinary clinics, pet stores, and any restaurant or cafe that allows dogs.
You can filter for these specific attributes directly in the WHERE clause of
your query.
Aggregate the Insights for Each Location
Finally, you need to count how many relevant places you found for each
apartment. The GROUP BY clause aggregates the results, and the COUNTIF
function counts places that match the specific criteria for each of our scores.
The query below combines these three steps, calculating the raw counts for both scores in a single pass:
-- This Common Table Expression (CTE) will hold the raw counts for each score component.
WITH insight_counts AS (
  SELECT WITH AGGREGATION_THRESHOLD -- Correctly includes the mandatory aggregation threshold
    apartments.id,
    apartments.name,
    COUNTIF(places.primary_type = 'park') AS park_count,
    COUNTIF(places.primary_type = 'museum') AS museum_count,
    COUNTIF(places.primary_type = 'restaurant' AND places.good_for_children = TRUE) AS family_restaurant_count,
    COUNTIF(places.primary_type IN ('veterinary_care', 'pet_store')) AS pet_service_count,
    COUNTIF(places.allows_dogs = TRUE) AS dog_friendly_place_count
  FROM
    `your_project.your_dataset.apartment_listings` AS apartments
  LEFT JOIN
    `your-project.places_insights___us.places` AS places -- Corrected table name for the US dataset
    ON ST_DWITHIN(apartments.location, places.point, 800) -- Find places within 800 meters
  GROUP BY
    apartments.id, apartments.name
)
SELECT * FROM insight_counts;
The result of this query will be similar to this.
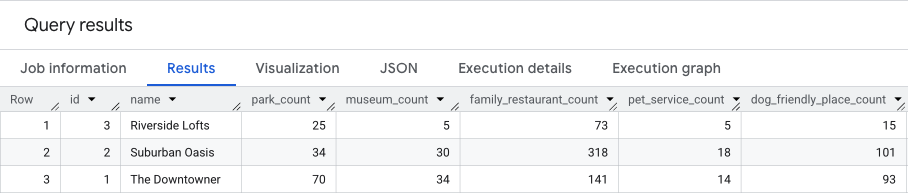
We will build on these results in the next section.
3. Create the Score
Now you have the count of places and weighting for each place type for each location you can now generate the custom location score. We will discuss two options in this section: using your own custom calculation in BigQuery or using generative artificial intelligence (AI) functions in BigQuery.
Option 1: Use your own custom calculation in BigQuery
The raw counts from the previous step are insightful, but a single, user-friendly score is the goal. The final step is to combine these counts using weights and then normalize the result to a 0-10 scale.
Applying Custom Weights Choosing your weights is both an art and science. They need to reflect your business priorities or what you believe is the most important to your users. For a "Family friendliness" Score you might decide a park is twice as important as a museum. Start with your best assumptions and iterate based on our user feedback.
Normalizing the Score The query below uses two Common Table Expressions
(CTEs): the first calculates the raw counts as before, and the second calculates
the weighted scores. The final SELECT statement then performs a min-max
normalization on the weighted scores. The location column of the example
apartment_listings table is output, to enable data visualization on a map.
WITH
  -- CTE 1: Count nearby amenities of interest for each apartment listing.
  insight_counts AS (
    SELECT WITH AGGREGATION_THRESHOLD
      apartments.id,
      apartments.name,
      COUNTIF(places.primary_type = 'park') AS park_count,
      COUNTIF(places.primary_type = 'museum') AS museum_count,
      COUNTIF(places.primary_type = 'restaurant' AND places.good_for_children = TRUE) AS family_restaurant_count,
      COUNTIF(places.primary_type IN ('veterinary_care', 'pet_store')) AS pet_service_count,
      COUNTIF(places.allows_dogs = TRUE) AS dog_friendly_place_count
    FROM
      `your_project.your_dataset.apartment_listings` AS apartments
    LEFT JOIN
      `your-project.places_insights___us.places` AS places
      ON ST_DWITHIN(apartments.location, places.point, 800)
    GROUP BY
      apartments.id,
      apartments.name
  ),
  -- CTE 2: Apply custom weighting to the amenity counts to generate raw scores.
  raw_scores AS (
    SELECT
      id,
      name,
      (park_count * 3.0) + (museum_count * 1.5) + (family_restaurant_count * 2.5) AS family_friendliness_score,
      (park_count * 2.0) + (pet_service_count * 3.5) + (dog_friendly_place_count * 2.5) AS pet_paradise_score
    FROM
      insight_counts
  )
-- Final Step: Normalize scores to a 0-10 scale and rejoin to retrieve the location geometry.
SELECT
  raw_scores.id,
  raw_scores.name,
  apartments.location,
  raw_scores.family_friendliness_score,
  raw_scores.pet_paradise_score,
  -- Normalize Family Score using a MIN/MAX window function.
  ROUND(
    COALESCE(
      SAFE_DIVIDE(
        (raw_scores.family_friendliness_score - MIN(raw_scores.family_friendliness_score) OVER ()),
        (MAX(raw_scores.family_friendliness_score) OVER () - MIN(raw_scores.family_friendliness_score) OVER ())
      ) * 10,
      0
    ),
    2
  ) AS normalized_family_score,
  -- Normalize Pet Score using a MIN/MAX window function.
  ROUND(
    COALESCE(
      SAFE_DIVIDE(
        (raw_scores.pet_paradise_score - MIN(raw_scores.pet_paradise_score) OVER ()),
        (MAX(raw_scores.pet_paradise_score) OVER () - MIN(raw_scores.pet_paradise_score) OVER ())
      ) * 10,
      0
    ),
    2
  ) AS normalized_pet_score
FROM
  raw_scores
JOIN
  `your_project.your_dataset.apartment_listings` AS apartments
  ON raw_scores.id = apartments.id;
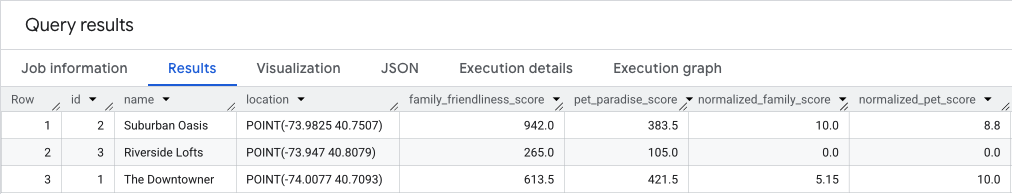
The results of the query will be similar to the below. The last two columns are the normalized scores.
Understand the Normalized Score
It's important to understand why this final normalization step is so valuable.
The raw weighted scores can range from 0 to a potentially very large number
depending on the urban density of your locations. A score of 500 is
meaningless to a user without context.
Normalization transforms these abstract numbers into a relative ranking. By scaling the results from 0 to 10, the score clearly communicates how each location compares to the others in your specific dataset:
- A score of 10 is assigned to the location with the highest raw score, marking it as the best option in the current set.
- A score of 0 is assigned to the location with the lowest raw score, making it the baseline for comparison. This does not mean the location has zero amenities, but rather that it is the least suitable relative to the other options being evaluated.
- All other scores fall proportionally in between, giving your users a clear and intuitive way to compare their options at a glance.
Option 2: Use the AI.GENERATE function (Gemini)
As an alternative to using a fixed mathematical formula, you can use the
BigQuery AI.GENERATE
function
to compute custom location scores directly within your SQL workflow.
While Option 1 is excellent for purely quantitative scoring based on amenity
counts, it cannot easily factor in qualitative data. The AI.GENERATE function
lets you combine the numbers from your Places Insights query with
unstructured data, like the apartment listing's text description (e.g., "This
location is suitable for families and the area is quiet at night") or specific
user profile preferences (e.g., "This user is booking for a family and prefers a
quiet area in a central location"). This lets you generate a more nuanced
score that detects subtleties a strict count might miss, such as a location
having high amenity density but also described as 'too noisy for children'.
Construct the Prompt
To use this function, the results of the aggregation (from Step 2) are formatted into a natural language prompt. This can be done dynamically in SQL by concatenating data columns with instructions for the model.
In the query below, insight_counts are combined with the text description of
the apartment to create a prompt for each row. A target user profile is also
defined to guide the scoring.
Generate the Score with SQL
The following query performs the entire operation in BigQuery. It:
- Aggregates the Place counts (as described in Step 2).
- Constructs a prompt for each location.
- Calls the
AI.GENERATEfunction to analyze the prompt using the Gemini model. - Parses the result into a structured format ready for use in your application.
WITH
  -- CTE 1: Aggregate Place counts (Same as Step 2)
  insight_counts AS (
    SELECT WITH AGGREGATION_THRESHOLD
      apartments.id,
      apartments.name,
      apartments.description, -- Assuming your table has a description column
      COUNTIF(places.primary_type = 'park') AS park_count,
      COUNTIF(places.primary_type = 'museum') AS museum_count,
      COUNTIF(places.primary_type = 'restaurant' AND places.good_for_children = TRUE) AS family_restaurant_count
    FROM
      `your-project.your_dataset.apartment_listings` AS apartments
    LEFT JOIN
      `your-project.places_insights___us.places` AS places
      ON ST_DWITHIN(apartments.location, places.point, 800)
    GROUP BY
      apartments.id, apartments.name, apartments.description
  ),

  -- CTE 2: Construct the Prompt
  prepared_prompts AS (
    SELECT
      id,
      name,
      FORMAT("""
        You are an expert real estate analyst. Generate a 'Family-Friendliness Score' (0-10) for this location.

        Target User: Young family with a toddler, looking for a balance of activity and quiet.

        Location Data:
        - Name: %s
        - Description: %s
        - Parks nearby: %d
        - Museums nearby: %d
        - Family-friendly restaurants nearby: %d

        Scoring Rules:
        - High importance: Proximity to parks and high restaurant count.
        - Negative modifiers: Descriptions indicating excessive noise or nightlife focus.
        - Positive modifiers: Descriptions indicating quiet streets or backyards.
      """, name, description, park_count, museum_count, family_restaurant_count) AS prompt_text
    FROM insight_counts
    )

-- Final Step: Call AI.GENERATE
SELECT
  id,
  name,
  -- Access the structured fields returned by the model
  generated.family_friendliness_score,
  generated.reasoning
FROM
  prepared_prompts,
  AI.GENERATE(
    prompt_text,
    endpoint => 'gemini-flash-latest',
    output_schema => 'family_friendliness_score FLOAT64, reasoning STRING'
  ) AS generated;
Understand the Configuration
- Cost Awareness: This function passes your input to a Gemini model and incurs charges in Vertex AI each time it's called. If a large number of locations are being analyzed (e.g., thousands of apartment listings), filtering the dataset to the most relevant candidates first is recommended. For more details on minimizing costs, see Best Practices.
endpoint:gemini-flash-latestis specified for this example to prioritize speed and cost-efficiency. However, you can choose the model that best fits your needs. See the Gemini models documentation to experiment with different versions (e.g., Gemini Pro for more complex reasoning tasks) and find the best fit for your use case.output_schema: Instead of parsing raw text, a schema is enforced (FLOAT64for the score andSTRINGfor the reasoning). This ensures the output is immediately usable in your application or visualization tools without post-processing.
Example Output
The query returns a standard BigQuery table with the custom score and the model's reasoning.
| id | name | family_friendliness_score | reasoning |
|---|---|---|---|
| 1 | The Downtowner | 5.5 | Excellent amenity counts (parks, restaurants), fulfilling quantitative metrics. However, the qualitative data indicates excessive weekend noise and a strong nightlife focus, conflicting directly with the target user's need for quiet. |
| 2 | Suburban Oasis | 9.8 | Outstanding quantitative data combined with a description ("quiet, tree-lined street") that perfectly aligns with the target family profile. High positive modifiers result in a near-perfect score. |
This procedure lets you deliver highly personalized scoring that feels intelligible and tailored to each individual user, all within a single SQL query.
4. Visualize your scores on a map
BigQuery Studio includes an integrated map
visualization
for any query result that contains a GEOGRAPHY column. Since our query outputs
the location column, you can immediately visualize your scores.
Clicking on the Visualization tab will bring up the map, and the Data Column
drop-down controls the location score to visualize. In this example, the
normalized_pet_score is visualized from the Option 1
example. Note that more
locations were added to the apartment_listings table, for this example.
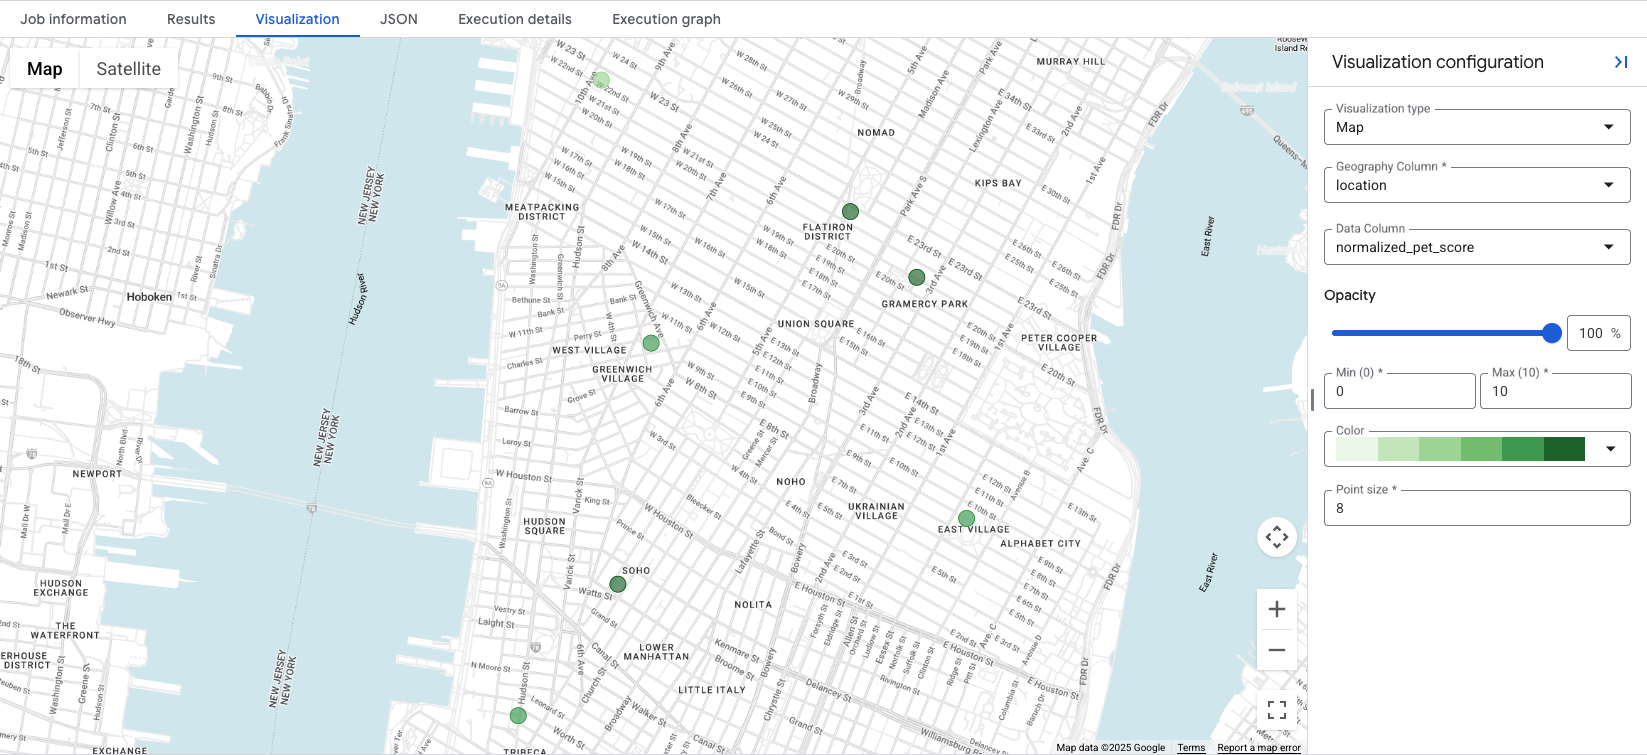
Visualizing the data reveals at a glance the most appropriate locations for the
created score, with darker green circles representing locations with a higher
normalized_pet_score, in this case. For further Places Insights data
visualization options, see Visualize query
results.
Conclusion
You now possess a powerful and repeatable methodology for creating nuanced
location scores. Starting with your locations, you built a single SQL query in
BigQuery that finds nearby places with ST_DWITHIN, filters them by advanced
attributes like good_for_children and allows_dogs, and aggregates the
results with COUNTIF. By applying custom weights and normalizing the result,
you produced a single, user-friendly score that delivers deep, actionable
insight. You can directly apply this pattern to transform raw location data into
a significant competitive advantage.
Next Actions
Now it's your turn to build. This tutorial provides a template. You can use the rich data available in the Places Insights schema to create the scores that are most necessary for your use case. Consider these other scores you could build:
- "Nightlife Score": Combine filters for
primary_type(bar,night_club),price_level, and late-night opening hours to find the most vibrant areas after dark. - "Fitness & Wellness Score": Count nearby
gyms,parks, andhealth_food_stores, and filter restaurants for those withserves_vegetarian_foodto score locations for health-conscious users. - "Commuter's Dream Score": Find locations with a high density of nearby
transit_stationandparkingplaces to help users who value access to transportation.
Contributors
Henrik Valve | DevX Engineer