
Analysis and business intelligence tools are crucial to helping you discover insights from your BigQuery data. BigQuery supports several Google and third-party data visualization tools that you can use to analyze the results of your queries on Places Insights data, including:
- Visualization tab of BigQuery Studio
- Colab notebooks
- Looker Studio
- Google Earth Engine
- BigQuery Geo Viz
The examples below describes how to visualize your results in:
- Visualization tab of BigQuery Studio, an integrated geography data viewer.
- Colab notebooks, a hosted Jupyter Notebook service.
- Looker Studio, a platform that lets you build and consume data visualizations, dashboards, and reports.
- BigQuery Geo Viz, a geospatial data visualization tool in BigQuery using Google Maps APIs.
The examples show a visualization of wheelchair accessible restaurants, but any of your Places Insights queries and brands data queries can be visualized.
See the BigQuery documentation for more information on visualizing your data using other tools.
Query data to visualize
The visualization examples below use the following query to generate a count of restaurants within 3000 meters of the Empire State Building in New York City with a wheelchair accessible entrance. This query returns a table of restaurant counts per geographical point where the size of each point is 0.005 degrees.
Because you cannot perform a GROUP BY operation on a GEOGRAPHY point, this
query uses the BigQuery
ST_ASTEXT
function to convert each point into the STRING
WKT representation of the
point, and writes that value to the geo_txt column. It then performs the
GROUP BY using geo_txt.
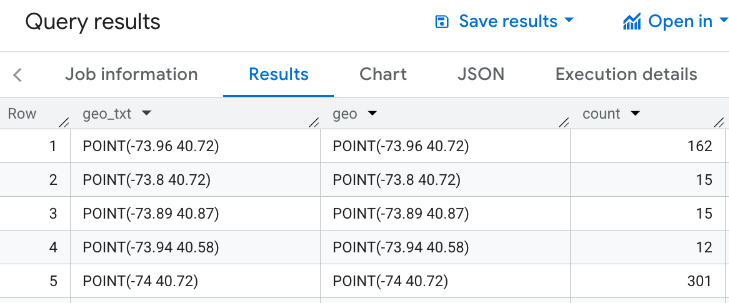
SELECT
  geo_txt, -- STRING WKT geometry value.
  ST_GEOGFROMTEXT(geo_txt) AS geo, -- Convert STRING to GEOGRAPHY value.
  count
FROM (
  -- Create STRING WKT representation of each GEOGRAPHY point to
  -- GROUP BY the STRING value.
  SELECT WITH AGGREGATION_THRESHOLD
    ST_ASTEXT(ST_SNAPTOGRID(point, 0.005)) AS geo_txt,
    COUNT(*) AS count
  FROM
    `PROJECT_NAME.places_insights___us.places`
  WHERE
    'restaurant' IN UNNEST(types)
    AND wheelchair_accessible_entrance = true
    AND ST_DWITHIN(ST_GEOGPOINT(-73.9857, 40.7484), point, 3000)
  GROUP BY
    geo_txt
)
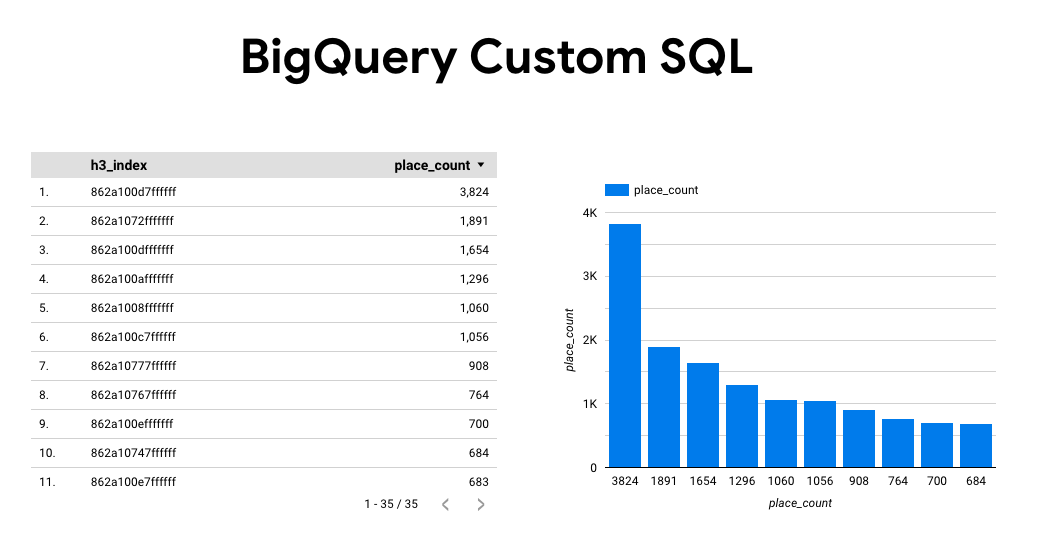
The following image shows an example output to this query where count contains
the number of restaurants for each point:
Visualize data using the Visualization tab of BigQuery Studio
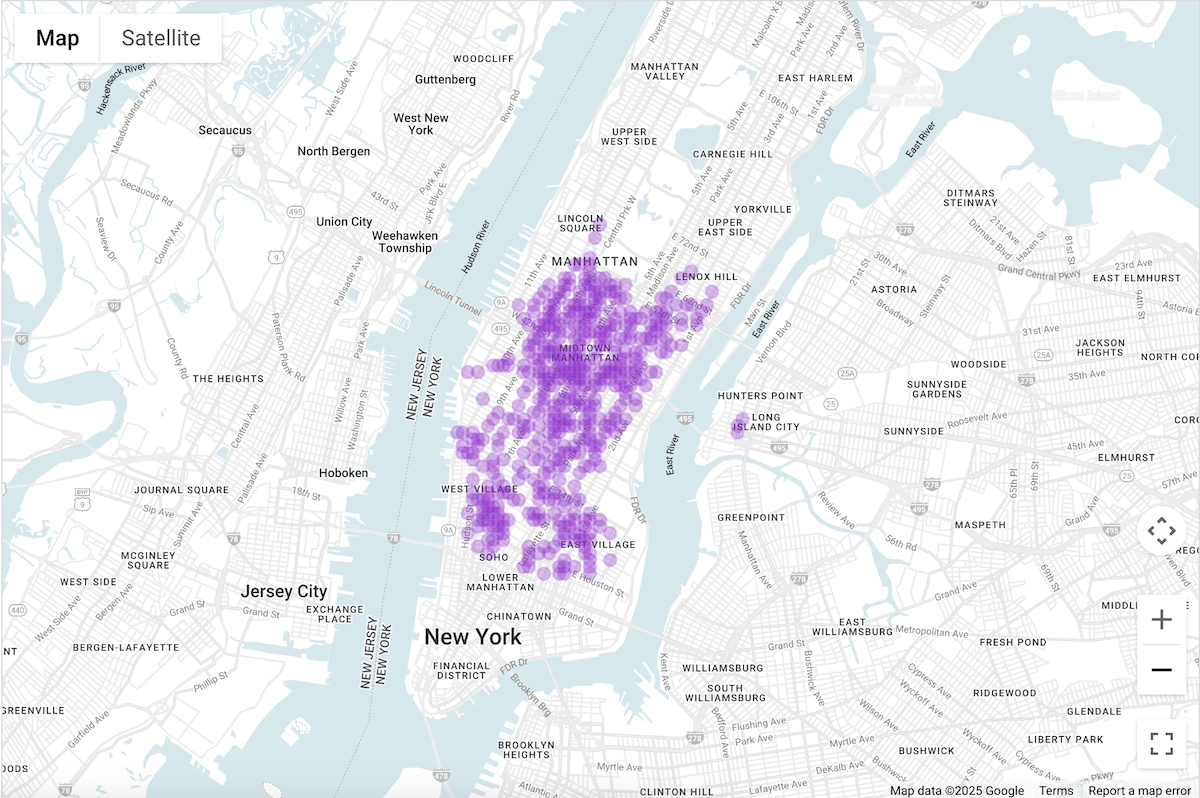
The following image shows this data displayed in BigQuery using the Visualization tab. Darker circles indicate a higher concentration of restaurants in that location.
Visualize your data in BigQuery Studio
- Run the query above in Query data to
visualize.
- In the BigQuery results, click the Visualization tab.
- A map will open up with circles representing the points queried.
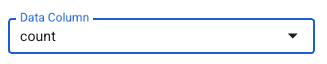
Under Visualization configuration, set Data Column to count.
The darker circles will represent points with higher restaurant counts.
You can optionally update other settings to change the look and feel of the visualization.
Visit the BiqQuery visualization documentation for more information on the configuration options.
Visualize data using Colab Notebooks
Visualization in Colab Notebooks offers you more control and sophistication than BigQuery Studio, and lets you remain in a Jupyter notebook environment.
A tutorial on visualizing geospatial analytics data in Colab is available in three formats:
- In the Colab documentation.
- As a YouTube video.
- In a GitHub Notebook the you can clone and use in Colab for Workspaces or Colab Enterprise.
The tutorial focuses on 4 core types of charts using pydeck, deck.gl and
- Scatterplot (typically for sampling).
- GeoJSON (for discovery).
- Choropleth (for intensity).
- Heatmap (for density).
Visualize data using Looker Studio
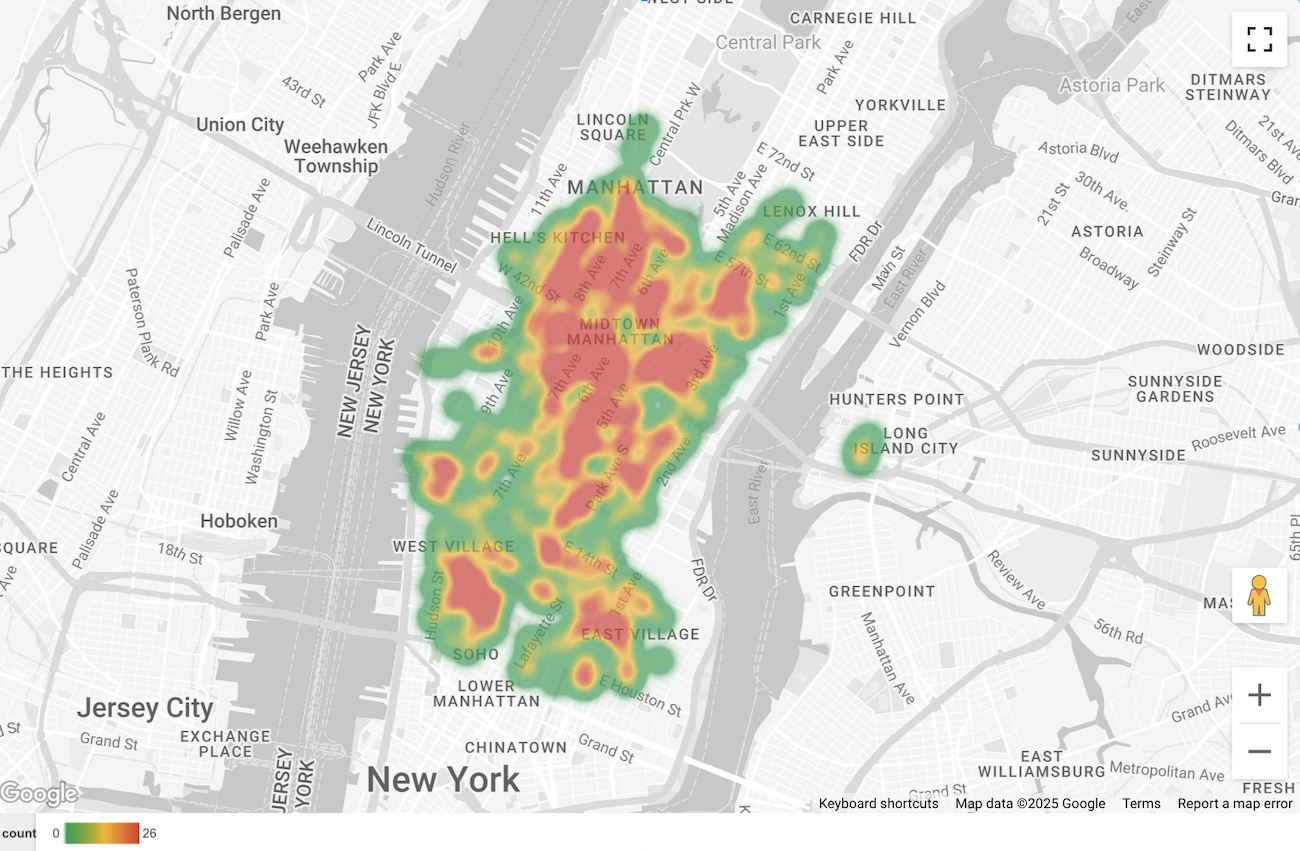
The following images show this data displayed in Looker Studio as a heatmap. The heatmap shows density from low (green) to high (red).
Import your data into Looker Studio
To import your data into Looker Studio:
Run the query above in Query data to visualize.
In the BigQuery results, click Open in -> Looker Studio. Your results are automatically imported into Looker Studio.
Looker Studio creates a default report page and initializes it with a title, table, and bar graph of the results.
Select everything on the page and delete it.
Click Insert -> Heatmap to add a heatmap to your report.
Under Chart types -> Setup, drag items from the Data section to configure fields as shown below:
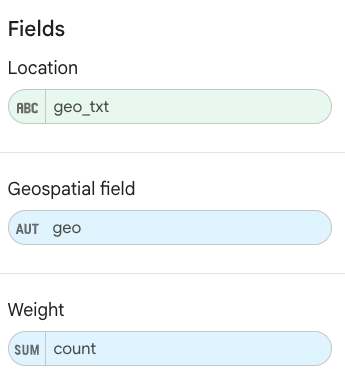
The heatmap appears as above. You can optionally select Chart types -> Styles to further configure the appearance of the map.
Visualize data using BigQuery Geo Viz
The following images show this data displayed in BigQuery Geo Viz as a filled map. The filled map shows the restaurant density by point cell, where the larger the point corresponds to the higher density.
Import your data into BigQuery Geo Viz
To import your data into BigQuery Geo Viz:
Run the query above in Query data to visualize.
In the BigQuery results, click Open in -> GeoViz.
The display opens to the Query step.
Select the Run button to run the query. The map automatically shows the points on the map.
Select Data to view the data.
In the Data section, click the Add styles button.
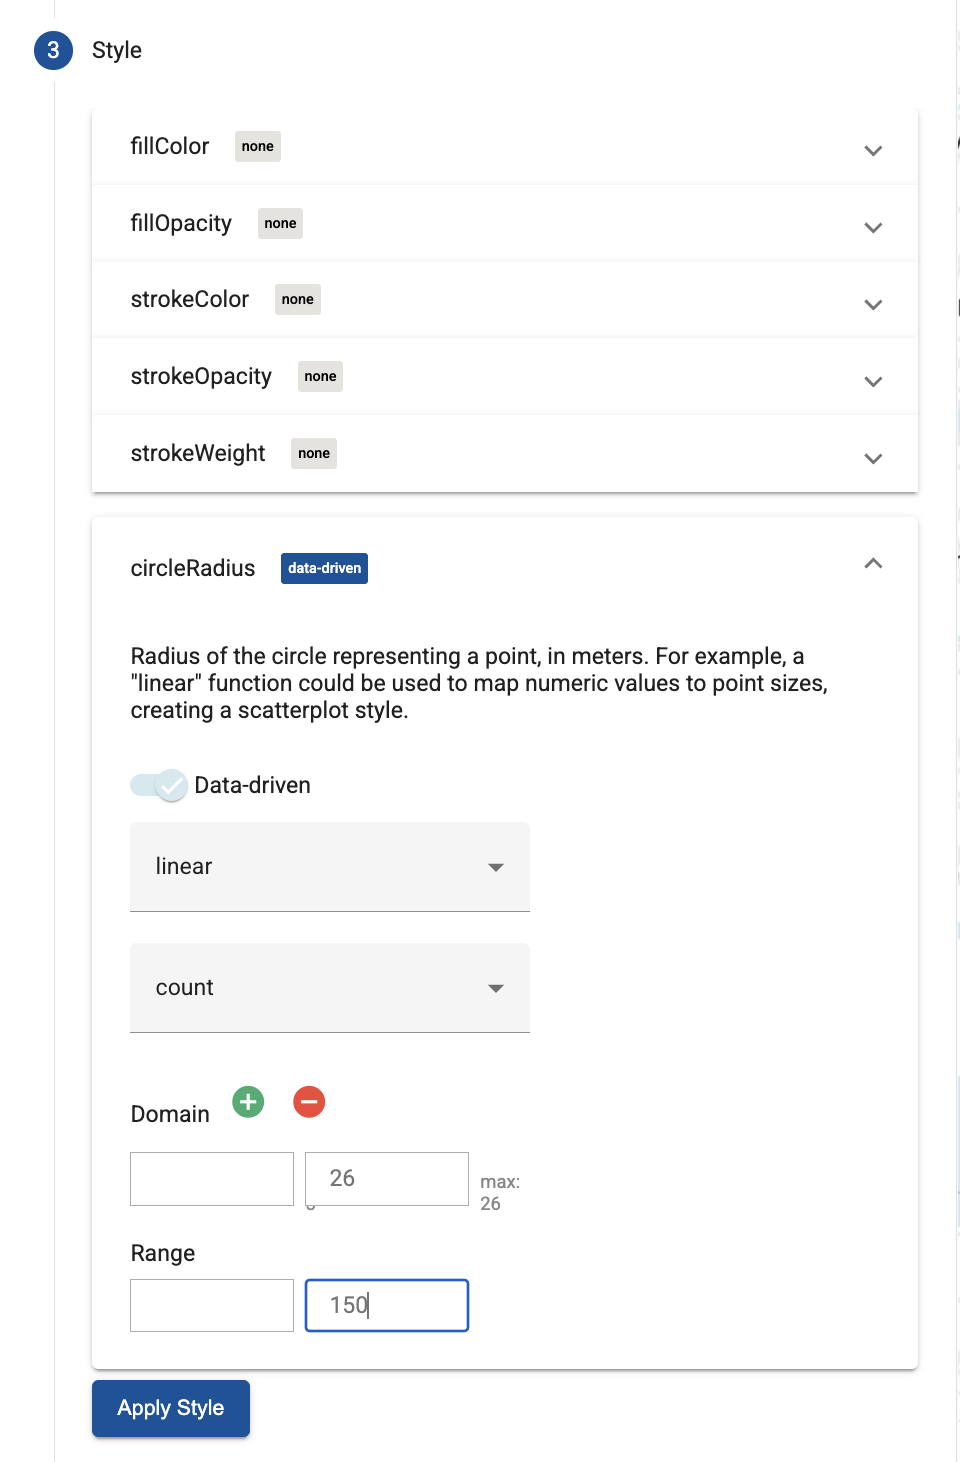
Select circleRadius and then use the slider to enable Data-driven styling.
Set the remaining fields as shown below:

Click Apply Style to apply the styles to the map.