
Функция ui.Chart создает диаграммы на основе клиентского объекта JSON, который имеет ту же структуру, что и класс DataTable Google Диаграмм, но не имеет методов DataTable и изменяемости. По сути, это двумерная таблица, в которой строки представляют наблюдения, а столбцы – атрибуты наблюдений. Это гибкий базовый интерфейс для построения диаграмм в Earth Engine. Это хороший вариант, когда требуется высокая степень настройки диаграммы.
Схема DataTable
В Earth Engine есть два способа определить псевдо-DataTable: двумерный массив JavaScript и литеральный объект JavaScript. Для большинства приложений самым простым подходом будет создание двумерного массива. В обоих случаях таблица, передаваемая в ui.Chart, должна быть клиентским объектом. Таблица, закодированная вручную, по своей природе будет клиентской, тогда как вычисляемый объект необходимо будет перенести на сторону клиента с помощью evaluate. Подробную информацию о различиях между серверными и клиентскими объектами можно найти на странице Клиент и сервер.
массив JavaScript
Двумерный массив DataTable состоит из строк и столбцов. Строки — это наблюдения,
а столбцы — атрибуты. Первый столбец определяет значения для оси X, а дополнительные столбцы – значения для серии оси Y. Первая строка должна содержать заголовки столбцов. Простейший заголовок – это ряд названий столбцов, как в следующем массиве DataTable, который содержит данные о населении некоторых штатов.
var dataTable = [
  ['State', 'Population'],
  ['CA', 37253956],
  ['NY', 19378102],
  ['IL', 12830632],
  ['MI', 9883640],
  ['OR', 3831074],
];
При необходимости столбцам можно назначить роль, отличную от определения домена (ось X) и данных (серия оси Y), например аннотацию, интервалы, подсказки или стиль. В примере ниже массив заголовков представлен в виде серии объектов, в которых явно определена роль каждого столбца. Допустимые роли столбцов для каждого типа Google Диаграмм можно найти в соответствующей документации, например Формат данных столбчатой диаграммы.
var dataTable = [
  [{role: 'domain'}, {role: 'data'}, {role: 'annotation'}],
  ['CA', 37253956, '37.2e6'],
  ['NY', 19378102, '19.3e6'],
  ['IL', 12830632, '12.8e6'],
  ['MI', 9883640, '9.8e6'],
  ['OR', 3831074, '3.8e6'],
];
Свойства столбцов указываются следующим образом:
| Параметр | Тип | Определение |
|---|---|---|
type |
Строка, рекомендуется | Тип данных столбца: 'string', 'number', 'boolean', 'date', 'datetime' или 'timeofday'. |
label |
Строка, рекомендуется | Ярлык для столбца, ярлык серии в легенде диаграммы. |
role |
Строка, рекомендуется | Роль столбца (например, роли для столбчатой диаграммы). |
pattern |
строка, необязательно | Строка формата числа (или даты), указывающая, как отображать значение столбца. |
Объект JavaScript
Объект DataTable можно форматировать как литеральный объект JavaScript, в котором представлены массивы объектов строк и столбцов. Инструкции по указанию параметров столбцов и строк можно найти в этом руководстве.
var dataTable = {
  cols: [{id: 'name', label: 'State', type: 'string'},
         {id: 'pop', label: 'Population', type: 'number'}],
  rows: [{c: [{v: 'CA'}, {v: 37253956}]},
         {c: [{v: 'NY'}, {v: 19378102}]},
         {c: [{v: 'IL'}, {v: 12830632}]},
         {c: [{v: 'MI'}, {v: 9883640}]},
         {c: [{v: 'OR'}, {v: 3831074}]}]
};
Диаграмма DataTable, созданная вручную
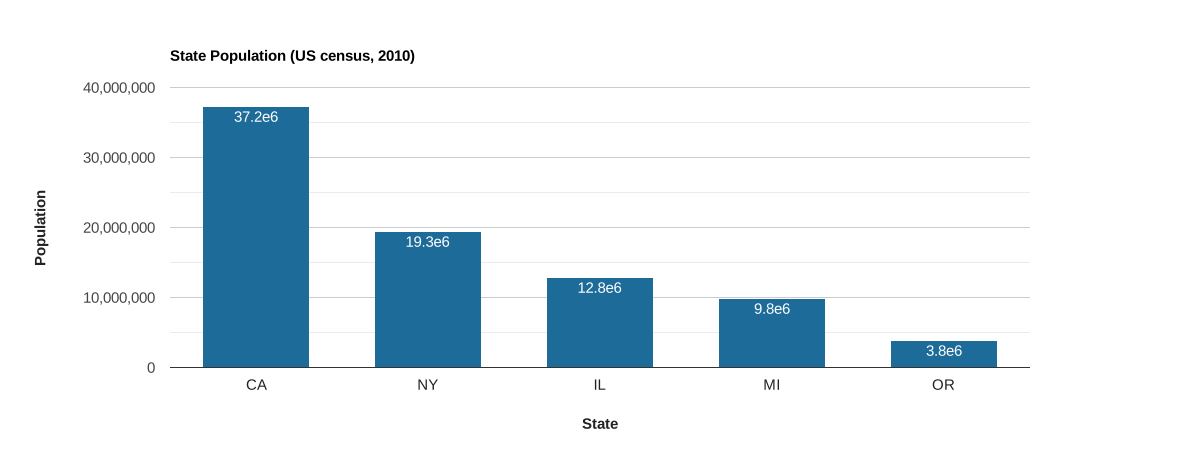
Предположим, у вас есть небольшой объем статических данных, которые вы хотите отобразить на диаграмме.
Чтобы создать входные данные для функции ui.Chart, используйте спецификации массива или объекта JavaScript. Здесь данные о населении некоторых штатов США из переписи 2010 года закодированы в виде массива JavaScript с объектами заголовков столбцов, которые определяют свойства столбцов. Обратите внимание, что третий столбец предназначен для роли
'annotation', которая добавляет население в качестве аннотации к каждому наблюдению
на диаграмме.
Редактор кода (JavaScript)
// Define a DataTable using a JavaScript array with a column property header.
var dataTable = [
  [
    {label: 'State', role: 'domain', type: 'string'},
    {label: 'Population', role: 'data', type: 'number'},
    {label: 'Pop. annotation', role: 'annotation', type: 'string'}
  ],
  ['CA', 37253956, '37.2e6'],
  ['NY', 19378102, '19.3e6'],
  ['IL', 12830632, '12.8e6'],
  ['MI', 9883640, '9.8e6'],
  ['OR', 3831074, '3.8e6']
];

// Define the chart and print it to the console.
var chart = ui.Chart(dataTable).setChartType('ColumnChart').setOptions({
  title: 'State Population (US census, 2010)',
  legend: {position: 'none'},
  hAxis: {title: 'State', titleTextStyle: {italic: false, bold: true}},
  vAxis: {title: 'Population', titleTextStyle: {italic: false, bold: true}},
  colors: ['1d6b99']
});
print(chart);
Вычисленная диаграмма "DataTable"
Массив DataTable можно создать из двумерного массива ee.List, переданного с сервера на клиент через evaluate. Распространенный сценарий – преобразование свойств ee.FeatureCollection, ee.ImageCollection или их поэлементного сокращения в DataTable. В примерах ниже используется стратегия, которая сопоставляет функцию с объектом ee.ImageCollection, уменьшающим заданный элемент, собирает объект ee.List из результатов уменьшения и прикрепляет список в качестве свойства с названием 'row' к возвращенному элементу. Каждый элемент новой коллекции имеет одномерный массив ee.List, который представляет строку в DataTable.
Функция aggregate_array() используется для объединения всех свойств 'row' в родительский объект ee.List, чтобы создать двумерный объект ee.List на стороне сервера в форме, необходимой для DataTable. Заголовок специального столбца объединяется с таблицей, и результат передается на клиентскую сторону с помощью evaluate, где он обрабатывается функцией ui.Chart.
Временной ряд по регионам
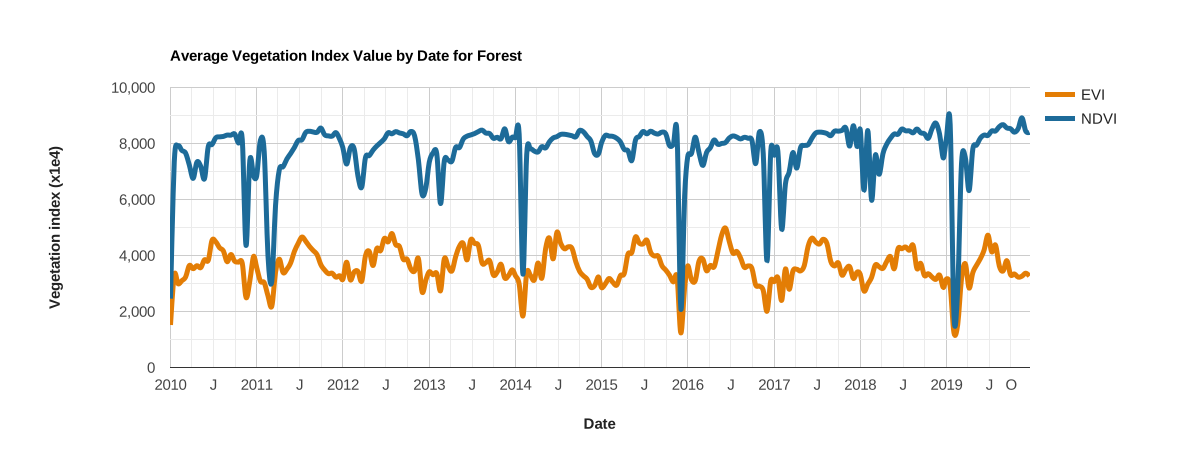
В этом примере показан временной ряд индексов растительности NDVI и EVI, полученных с помощью MODIS, для лесного экорегиона. Каждое изображение в серии уменьшается по экорегиону, а его результаты собираются как свойство 'row', которое агрегируется в DataTable для передачи клиенту и построения диаграммы с помощью ui.Chart. Обратите внимание, что этот фрагмент создает ту же диаграмму, что и пример диаграммы ui.Chart.image.series.
Редактор кода (JavaScript)
// Import the example feature collection and subset the forest feature.
var forest = ee.FeatureCollection('projects/google/charts_feature_example')
                 .filter(ee.Filter.eq('label', 'Forest'));

// Load MODIS vegetation indices data and subset a decade of images.
var vegIndices = ee.ImageCollection('MODIS/061/MOD13A1')
                     .filter(ee.Filter.date('2010-01-01', '2020-01-01'))
                     .select(['NDVI', 'EVI']);

// Define a function to format an image timestamp as a JavaScript Date string.
function formatDate(img) {
  var millis = img.date().millis().format();
  return ee.String('Date(').cat(millis).cat(')');
}

// Build a feature collection where each feature has a property that represents
// a DataFrame row.
var reductionTable = vegIndices.map(function(img) {
  // Reduce the image to the mean of pixels intersecting the forest ecoregion.
  var stat = img.reduceRegion(
      {reducer: ee.Reducer.mean(), geometry: forest, scale: 500});

  // Extract the reduction results along with the image date.
  var date = formatDate(img);   // x-axis values.
  var evi = stat.get('EVI');    // y-axis series 1 values.
  var ndvi = stat.get('NDVI');  // y-axis series 2 values.

  // Make a list of observation attributes to define a row in the DataTable.
  var row = ee.List([date, evi, ndvi]);

  // Return the row as a property of an ee.Feature.
  return ee.Feature(null, {'row': row});
});

// Aggregate the 'row' property from all features in the new feature collection
// to make a server-side 2-D list (DataTable).
var dataTableServer = reductionTable.aggregate_array('row');

// Define column names and properties for the DataTable. The order should
// correspond to the order in the construction of the 'row' property above.
var columnHeader = ee.List([[
  {label: 'Date', role: 'domain', type: 'date'},
  {label: 'EVI', role: 'data', type: 'number'},
  {label: 'NDVI', role: 'data', type: 'number'}
]]);

// Concatenate the column header to the table.
dataTableServer = columnHeader.cat(dataTableServer);

// Use 'evaluate' to transfer the server-side table to the client, define the
// chart and print it to the console.
dataTableServer.evaluate(function(dataTableClient) {
  var chart = ui.Chart(dataTableClient).setOptions({
    title: 'Average Vegetation Index Value by Date for Forest',
    hAxis: {
      title: 'Date',
      titleTextStyle: {italic: false, bold: true},
    },
    vAxis: {
      title: 'Vegetation index (x1e4)',
      titleTextStyle: {italic: false, bold: true}
    },
    lineWidth: 5,
    colors: ['e37d05', '1d6b99'],
    curveType: 'function'
  });
  print(chart);
});
Интервальная диаграмма
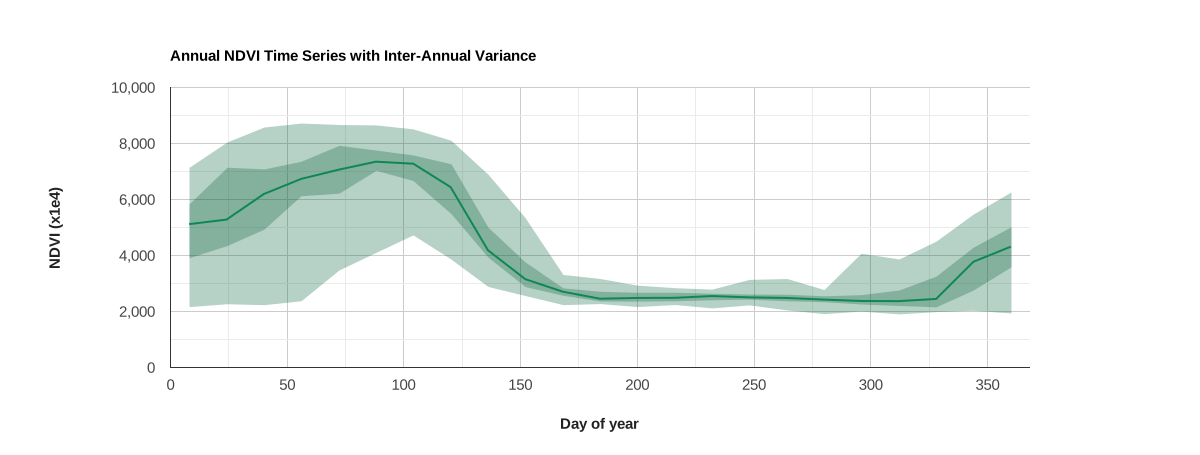
В этой диаграмме используется свойство 'role' столбца DataTable, чтобы создать диаграмму интервалов.
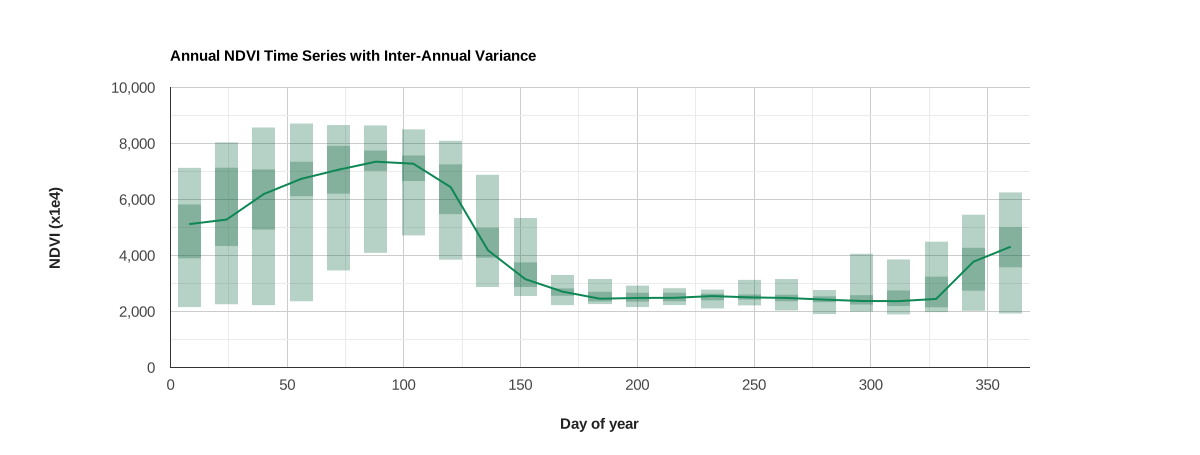
На диаграмме показан годовой профиль NDVI и межгодовая дисперсия для пикселя вблизи Монтерея, Калифорния.
Медиана за несколько лет представлена в виде линии, а абсолютный и межквартильный диапазоны – в виде полос. Столбцы таблицы, представляющие каждый интервал, назначаются как таковые путем установки свойства столбца 'role' как 'interval'. Полосы рисуются вокруг медианы, если свойству диаграммы intervals.style присвоено значение 'area'.
Редактор кода (JavaScript)
// Define a point to extract an NDVI time series for.
var geometry = ee.Geometry.Point([-121.679, 36.479]);

// Define a band of interest (NDVI), import the MODIS vegetation index dataset,
// and select the band.
var band = 'NDVI';
var ndviCol = ee.ImageCollection('MODIS/061/MOD13Q1').select(band);

// Map over the collection to add a day of year (doy) property to each image.
ndviCol = ndviCol.map(function(img) {
  var doy = ee.Date(img.get('system:time_start')).getRelative('day', 'year');
  // Add 8 to day of year number so that the doy label represents the middle of
  // the 16-day MODIS NDVI composite.
  return img.set('doy', ee.Number(doy).add(8));
});

// Join all coincident day of year observations into a set of image collections.
var distinctDOY = ndviCol.filterDate('2013-01-01', '2014-01-01');
var filter = ee.Filter.equals({leftField: 'doy', rightField: 'doy'});
var join = ee.Join.saveAll('doy_matches');
var joinCol = ee.ImageCollection(join.apply(distinctDOY, ndviCol, filter));

// Calculate the absolute range, interquartile range, and median for the set
// of images composing each coincident doy observation group. The result is
// an image collection with an image representative per unique doy observation
// with bands that describe the 0, 25, 50, 75, 100 percentiles for the set of
// coincident doy images.
var comp = ee.ImageCollection(joinCol.map(function(img) {
  var doyCol = ee.ImageCollection.fromImages(img.get('doy_matches'));

  return doyCol
      .reduce(ee.Reducer.percentile(
          [0, 25, 50, 75, 100], ['p0', 'p25', 'p50', 'p75', 'p100']))
      .set({'doy': img.get('doy')});
}));

// Extract the inter-annual NDVI doy percentile statistics for the
// point of interest per unique doy representative. The result is
// is a feature collection where each feature is a doy representative that
// contains a property (row) describing the respective inter-annual NDVI
// variance, formatted as a list of values.
var reductionTable = comp.map(function(img) {
  var stats = ee.Dictionary(img.reduceRegion(
      {reducer: ee.Reducer.first(), geometry: geometry, scale: 250}));

  // Order the percentile reduction elements according to how you want columns
  // in the DataTable arranged (x-axis values need to be first).
  var row = ee.List([
    img.get('doy'),            // x-axis, day of year.
    stats.get(band + '_p50'),  // y-axis, median.
    stats.get(band + '_p0'),   // y-axis, min interval.
    stats.get(band + '_p25'),  // y-axis, 1st quartile interval.
    stats.get(band + '_p75'),  // y-axis, 3rd quartile interval.
    stats.get(band + '_p100')  // y-axis, max interval.
  ]);

  // Return the row as a property of an ee.Feature.
  return ee.Feature(null, {row: row});
});

// Aggregate the 'row' properties to make a server-side 2-D array (DataTable).
var dataTableServer = reductionTable.aggregate_array('row');

// Define column names and properties for the DataTable. The order should
// correspond to the order in the construction of the 'row' property above.
var columnHeader = ee.List([[
  {label: 'Day of year', role: 'domain'},
  {label: 'Median', role: 'data'},
  {label: 'p0', role: 'interval'},
  {label: 'p25', role: 'interval'},
  {label: 'p75', role: 'interval'},
  {label: 'p100', role: 'interval'}
]]);

// Concatenate the column header to the table.
dataTableServer = columnHeader.cat(dataTableServer);

// Use 'evaluate' to transfer the server-side table to the client, define the
// chart and print it to the console.
dataTableServer.evaluate(function(dataTableClient) {
  var chart = ui.Chart(dataTableClient).setChartType('LineChart').setOptions({
    title: 'Annual NDVI Time Series with Inter-Annual Variance',
    intervals: {style: 'area'},
    hAxis: {
      title: 'Day of year',
      titleTextStyle: {italic: false, bold: true},
    },
    vAxis: {title: 'NDVI (x1e4)', titleTextStyle: {italic: false, bold: true}},
    colors: ['0f8755'],
    legend: {position: 'none'}
  });
  print(chart);
});
Интервалы можно представлять по-разному. В примере ниже вместо полос используются прямоугольники. Для этого свойство intervals.style заменено на 'boxes' с соответствующим стилем прямоугольников.
dataTableServer.evaluate(function(dataTableClient) {
  var chart = ui.Chart(dataTableClient).setChartType('LineChart').setOptions({
    title: 'Annual NDVI Time Series with Inter-Annual Variance',
    intervals: {style: 'boxes', barWidth: 1, boxWidth: 1, lineWidth: 0},
    hAxis: {
      title: 'Day of year',
      titleTextStyle: {italic: false, bold: true},
    },
    vAxis: {title: 'NDVI (x1e4)', titleTextStyle: {italic: false, bold: true}},
    colors: ['0f8755'],
    legend: {position: 'none'}
  });
  print(chart);
});