

Модуль ui.Chart.feature содержит набор функций для отрисовки диаграмм из объектов Feature и FeatureCollection. Выбор функции определяет расположение данных на диаграмме, то есть то, что определяет значения по осям X и Y и что определяет ряд. Описания и примеры ниже помогут вам выбрать подходящую функцию и тип диаграммы.
Функции диаграмм
Используйте следующие диаграммы в качестве визуального руководства, чтобы понять, как каждая функция упорядочивает объекты и их свойства на диаграмме, то есть какие элементы определяют значения x, значения y и серии.
Объекты наносятся на ось X по значениям выбранного свойства. Серии определяются списком названий свойств, значения которых наносятся на ось Y.
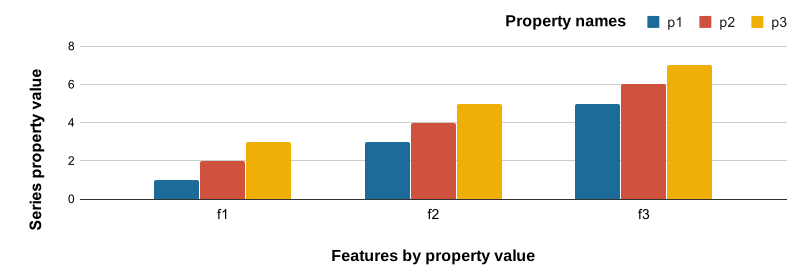
Свойства объектов наносятся на ось X по названию, а значения заданных свойств – на ось Y. Серии – это объекты, помеченные значениями выбранного свойства.
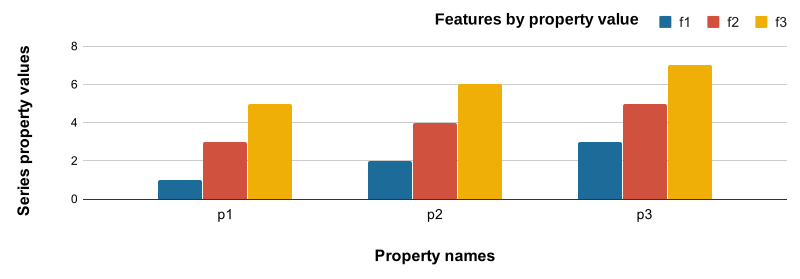
Объекты наносятся на ось X по значениям выбранного свойства. Ряды определяются уникальными значениями заданного свойства. Положение оси Y определяется значением заданного свойства.
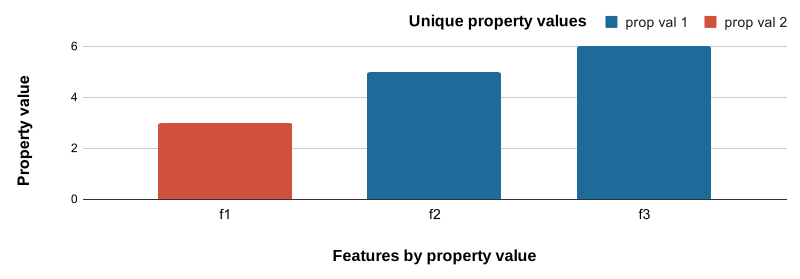
Гистограмма частоты значений выбранного свойства.
- Ось X. Группы гистограммы для значений выбранного свойства.
- Ось Y: частота функций, соответствующих каждому сегменту гистограммы.
Пример данных
В примерах ниже используется FeatureCollection, состоящая из трех объектов экорегионов со свойствами, описывающими климатические нормы.
Как были созданы примеры данных
Редактор кода (JavaScript)
// Define three representative ecoregions in the USA.
var desert = ee.Feature(
    ee.Geometry.Rectangle(-109.21, 31.42, -108.3, 32.03),
    {label: 'Desert', value: 0});

var forest = ee.Feature(
    ee.Geometry.Rectangle(-122.73, 43.45, -122.28, 43.91),
    {label: 'Forest', value: 1});

var grassland = ee.Feature(
    ee.Geometry.Rectangle(-101.81, 41.7, -100.53, 42.51),
    {label: 'Grassland', value: 2});

// Combine features into a feature collection.
var ecoregions = ee.FeatureCollection([desert, forest, grassland]);

// Load PRISM climate normals image collection; convert images to bands.
var normClim = ee.ImageCollection('OREGONSTATE/PRISM/Norm91m').toBands();

// Summarize climate normals for each ecoregion feature as a set or properties.
ecoregions = normClim.reduceRegions(
    {collection: ecoregions, reducer: ee.Reducer.mean(), scale: 5e4});

// Add a property for whether January temperature is warm or not.
ecoregions = ecoregions.map(function(ecoregion) {
  return ecoregion.set('warm', ee.Number(ecoregion.get('01_tmean')).gt(0));
});
ui.Chart.feature.byFeature
Столбчатая
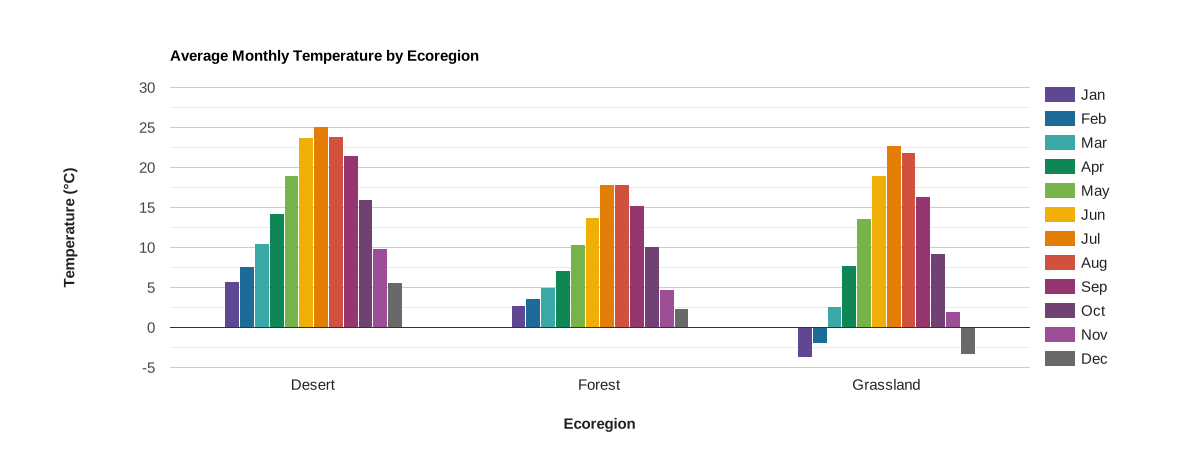
Объекты наносятся на ось X и помечаются значениями выбранного свойства. Серии представлены смежными столбцами, определяемыми списком имен свойств, значения которых нанесены на ось Y.
Редактор кода (JavaScript)
// Import the example feature collection.
var ecoregions = ee.FeatureCollection('projects/google/charts_feature_example');

// Define the chart and print it to the console.
var chart =
    ui.Chart.feature
        .byFeature({
          features: ecoregions.select('[0-9][0-9]_tmean|label'),
          xProperty: 'label',
        })
        .setSeriesNames([
          'Jan', 'Feb', 'Mar', 'Apr', 'May', 'Jun', 'Jul', 'Aug', 'Sep', 'Oct',
          'Nov', 'Dec'
        ])
        .setChartType('ColumnChart')
        .setOptions({
          title: 'Average Monthly Temperature by Ecoregion',
          hAxis:
              {title: 'Ecoregion', titleTextStyle: {italic: false, bold: true}},
          vAxis: {
            title: 'Temperature (°C)',
            titleTextStyle: {italic: false, bold: true}
          },
          colors: [
            '604791', '1d6b99', '39a8a7', '0f8755', '76b349', 'f0af07',
            'e37d05', 'cf513e', '96356f', '724173', '9c4f97', '696969'
          ]
        });
print(chart);
Линейчатая диаграмма
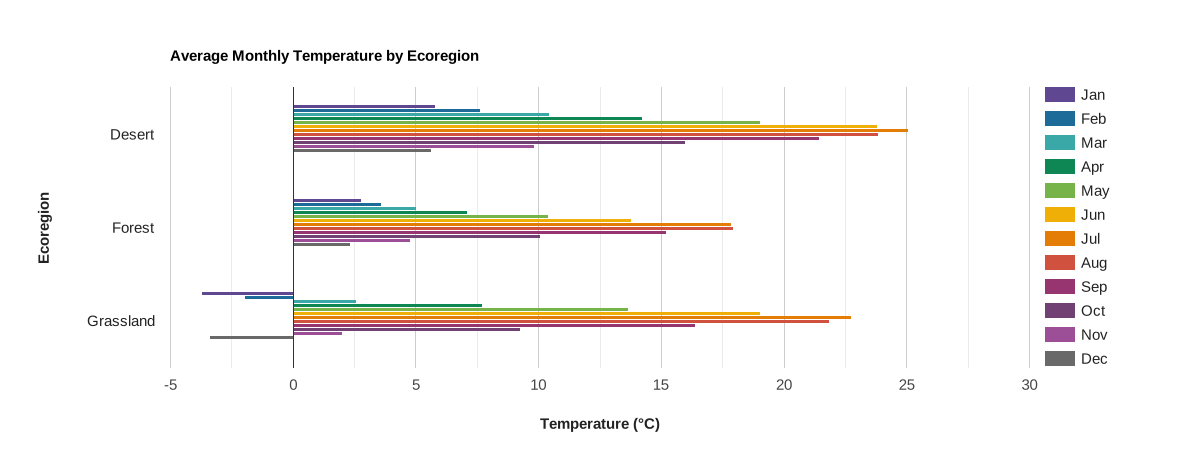
Объекты наносятся на ось Y и помечаются значениями выбранного свойства. Серии представлены соседними столбцами, определяемыми списком названий свойств, значения которых откладываются по оси X.
Редактор кода (JavaScript)
// Import the example feature collection.
var ecoregions = ee.FeatureCollection('projects/google/charts_feature_example');

// Define the chart and print it to the console.
var chart =
    ui.Chart.feature
        .byFeature({
          features: ecoregions.select('[0-9][0-9]_tmean|label'),
          xProperty: 'label',
        })
        .setSeriesNames([
          'Jan', 'Feb', 'Mar', 'Apr', 'May', 'Jun', 'Jul', 'Aug', 'Sep', 'Oct',
          'Nov', 'Dec'
        ])
        .setChartType('BarChart')
        .setOptions({
          title: 'Average Monthly Temperature by Ecoregion',
          hAxis: {
            title: 'Temperature (°C)',
            titleTextStyle: {italic: false, bold: true}
          },
          vAxis:
              {title: 'Ecoregion', titleTextStyle: {italic: false, bold: true}},
          colors: [
            '604791', '1d6b99', '39a8a7', '0f8755', '76b349', 'f0af07',
            'e37d05', 'cf513e', '96356f', '724173', '9c4f97', '696969'
          ]
        });
print(chart);
Столбчатая диаграмма с накоплением
Абсолютное значение
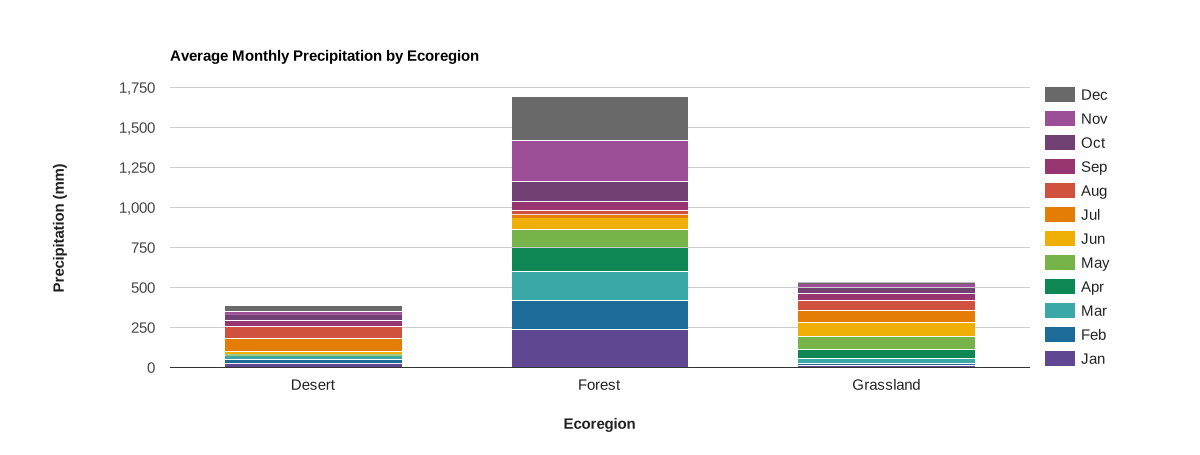
Объекты наносятся на ось X и помечаются значениями выбранного свойства. Серии представлены в виде столбцов с накоплением, которые определяются списком названий свойств. Значения этих свойств наносятся на ось Y в виде совокупной суммы серий.
Редактор кода (JavaScript)
// Import the example feature collection.
var ecoregions = ee.FeatureCollection('projects/google/charts_feature_example');

// Define the chart and print it to the console.
var chart =
    ui.Chart.feature
        .byFeature({
          features: ecoregions.select('[0-9][0-9]_ppt|label'),
          xProperty: 'label'
        })
        .setSeriesNames([
          'Jan', 'Feb', 'Mar', 'Apr', 'May', 'Jun', 'Jul', 'Aug', 'Sep', 'Oct',
          'Nov', 'Dec'
        ])
        .setChartType('ColumnChart')
        .setOptions({
          title: 'Average Monthly Precipitation by Ecoregion',
          hAxis:
              {title: 'Ecoregion', titleTextStyle: {italic: false, bold: true}},
          vAxis: {
            title: 'Precipitation (mm)',
            titleTextStyle: {italic: false, bold: true}
          },
          colors: [
            '604791', '1d6b99', '39a8a7', '0f8755', '76b349', 'f0af07',
            'e37d05', 'cf513e', '96356f', '724173', '9c4f97', '696969'
          ],
          isStacked: 'absolute'
        });
print(chart);
Член семьи
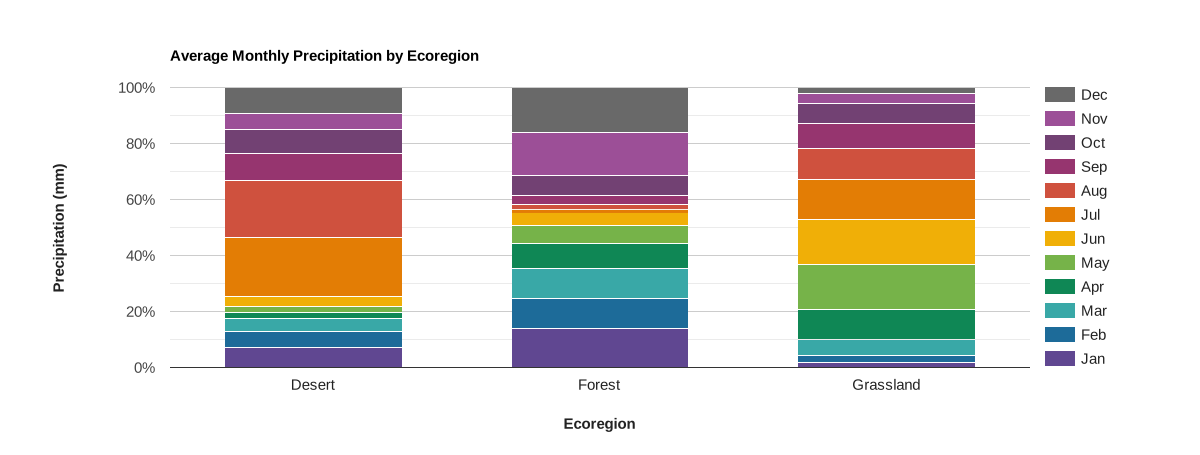
Объекты наносятся на ось X и помечаются значениями выбранного свойства. Серии представлены в виде столбцов с накоплением, которые определяются списком названий свойств. Значения этих свойств наносятся на ось Y в виде процентов от суммы серий.
Редактор кода (JavaScript)
// Import the example feature collection.
var ecoregions = ee.FeatureCollection('projects/google/charts_feature_example');

// Define the chart and print it to the console.
var chart =
    ui.Chart.feature
        .byFeature({
          features: ecoregions.select('[0-9][0-9]_ppt|label'),
          xProperty: 'label'
        })
        .setSeriesNames([
          'Jan', 'Feb', 'Mar', 'Apr', 'May', 'Jun', 'Jul', 'Aug', 'Sep', 'Oct',
          'Nov', 'Dec'
        ])
        .setChartType('ColumnChart')
        .setOptions({
          title: 'Average Monthly Precipitation by Ecoregion',
          hAxis:
              {title: 'Ecoregion', titleTextStyle: {italic: false, bold: true}},
          vAxis: {
            title: 'Precipitation (mm)',
            titleTextStyle: {italic: false, bold: true}
          },
          colors: [
            '604791', '1d6b99', '39a8a7', '0f8755', '76b349', 'f0af07',
            'e37d05', 'cf513e', '96356f', '724173', '9c4f97', '696969'
          ],
          isStacked: 'percent'
        });
print(chart);
Точечная диаграмма
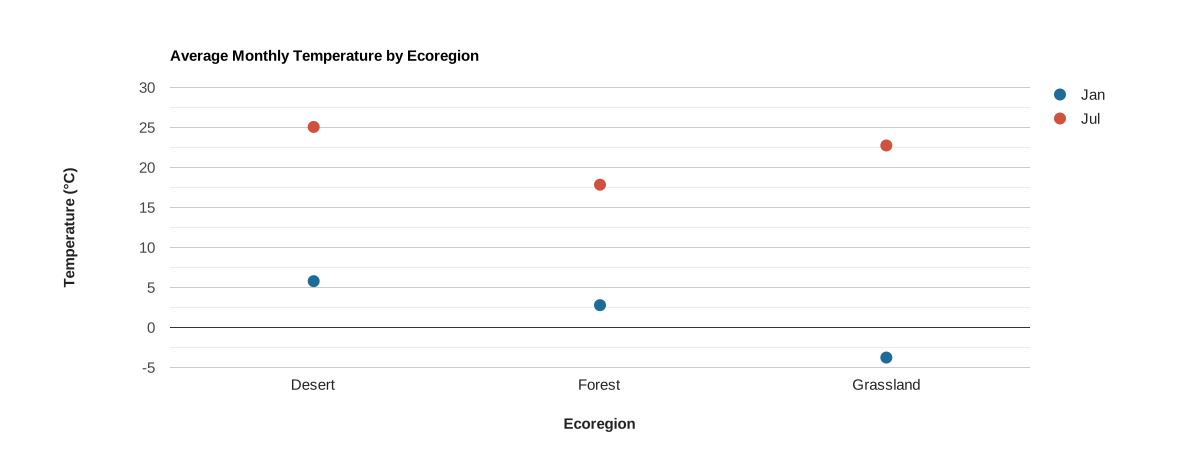
Объекты наносятся на ось X и помечаются значениями выбранного свойства. Ряды представлены точками, которые определяются списком названий свойств, значения которых наносятся на ось Y.
Редактор кода (JavaScript)
// Import the example feature collection.
var ecoregions = ee.FeatureCollection('projects/google/charts_feature_example');

// Define the chart and print it to the console.
var chart =
    ui.Chart.feature
        .byFeature({
          features: ecoregions,
          xProperty: 'label',
          yProperties: ['01_tmean', '07_tmean']
        })
        .setSeriesNames(['Jan', 'Jul'])
        .setChartType('ScatterChart')
        .setOptions({
          title: 'Average Monthly Temperature by Ecoregion',
          hAxis:
              {title: 'Ecoregion', titleTextStyle: {italic: false, bold: true}},
          vAxis: {
            title: 'Temperature (°C)',
            titleTextStyle: {italic: false, bold: true}
          },
          pointSize: 10,
          colors: ['1d6b99', 'cf513e'],
        });
print(chart);
Комбинированная диаграмма
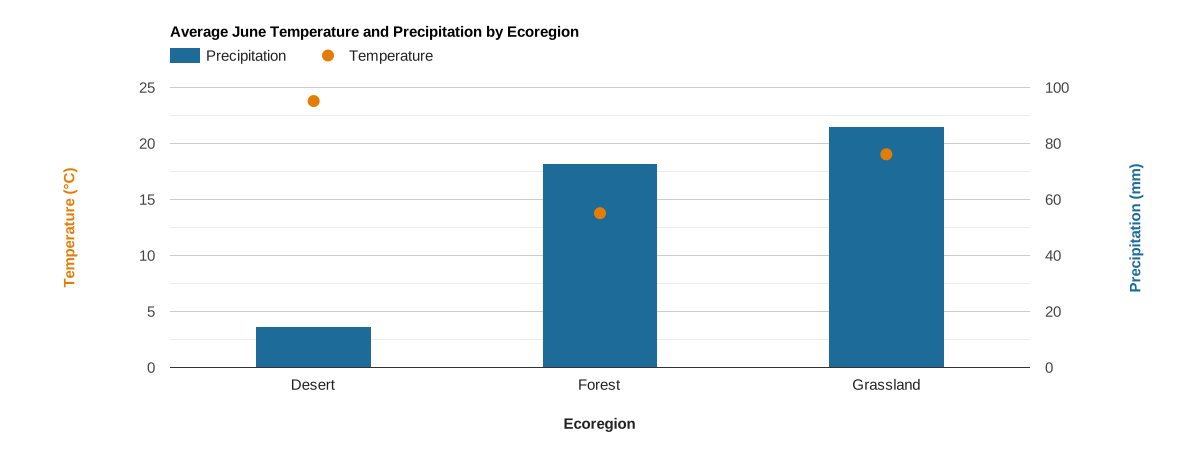
Объекты наносятся на ось X и помечаются значениями выбранного свойства. Серии представлены точками и столбцами, которые определяются списком названий свойств, значения которых наносятся на ось Y. Эта диаграмма создана с помощью двух осей и стилей для отдельных рядов.
Редактор кода (JavaScript)
// Import the example feature collection.
var ecoregions = ee.FeatureCollection('projects/google/charts_feature_example');

// Define the chart and print it to the console.
var chart =
    ui.Chart.feature
        .byFeature({
          features: ecoregions,
          xProperty: 'label',
          yProperties: ['06_ppt', '06_tmean']
        })
        .setSeriesNames(['Precipitation', 'Temperature'])
        .setChartType('ColumnChart')
        .setOptions({
          title: 'Average June Temperature and Precipitation by Ecoregion',
          series: {
            0: {targetAxisIndex: 1, type: 'bar', color: '1d6b99'},
            1: {
              targetAxisIndex: 0,
              type: 'line',
              lineWidth: 0,
              pointSize: 10,
              color: 'e37d05'
            }
          },
          hAxis:
              {title: 'Ecoregion', titleTextStyle: {italic: false, bold: true}},
          vAxes: {
            0: {
              title: 'Temperature (°C)',
              baseline: 0,
              titleTextStyle: {italic: false, bold: true, color: 'e37d05'}
            },
            1: {
              title: 'Precipitation (mm)',
              titleTextStyle: {italic: false, bold: true, color: '1d6b99'}
            },
          },
          bar: {groupWidth: '40%'},
        });
print(chart);
ui.Chart.feature.byProperty
Пример настройки
Функция ui.Chart.feature.byProperty принимает словарь, который позволяет управлять ярлыками и порядком названий свойств по оси X, присваивая им числовые значения. На следующих диаграммах с декартовой сеткой этот параметр используется для установки меток месяцев и сортировки названий месяцев в хронологическом порядке для среднего месячного количества осадков.
Столбчатая
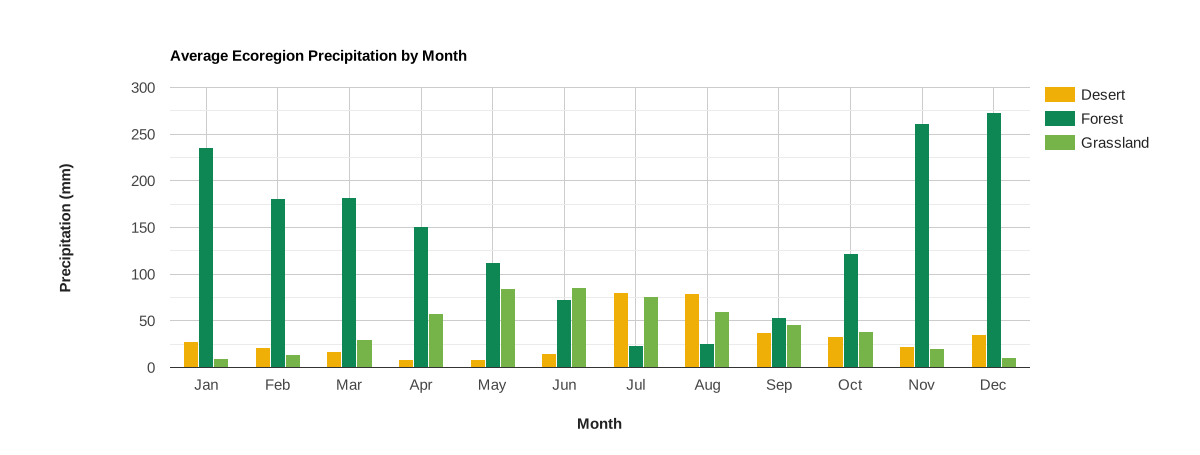
Свойства объектов наносятся на ось X, помечаются и сортируются по входным данным словаря; значения заданных свойств наносятся на ось Y. Серии – это функции, представленные столбцами и помеченные значениями выбранного свойства. Чтобы преобразовать в линейчатую диаграмму, используйте .setChartType('BarChart').
Редактор кода (JavaScript)
// Import the example feature collection.
var ecoregions = ee.FeatureCollection('projects/google/charts_feature_example');

// Define a dictionary that associates property names with values and labels.
var precipInfo = {
  '01_ppt': {v: 1, f: 'Jan'},
  '02_ppt': {v: 2, f: 'Feb'},
  '03_ppt': {v: 3, f: 'Mar'},
  '04_ppt': {v: 4, f: 'Apr'},
  '05_ppt': {v: 5, f: 'May'},
  '06_ppt': {v: 6, f: 'Jun'},
  '07_ppt': {v: 7, f: 'Jul'},
  '08_ppt': {v: 8, f: 'Aug'},
  '09_ppt': {v: 9, f: 'Sep'},
  '10_ppt': {v: 10, f: 'Oct'},
  '11_ppt': {v: 11, f: 'Nov'},
  '12_ppt': {v: 12, f: 'Dec'}
};

// Organize property information into objects for defining x properties and
// their tick labels.
var xPropValDict = {};  // Dictionary to codify x-axis property names as values.
var xPropLabels = [];   // Holds dictionaries that label codified x-axis values.
for (var key in precipInfo) {
  xPropValDict[key] = precipInfo[key].v;
  xPropLabels.push(precipInfo[key]);
}

// Define the chart and print it to the console.
var chart = ui.Chart.feature
                .byProperty({
                  features: ecoregions,
                  xProperties: xPropValDict,
                  seriesProperty: 'label'
                })
                .setChartType('ColumnChart')
                .setOptions({
                  title: 'Average Ecoregion Precipitation by Month',
                  hAxis: {
                    title: 'Month',
                    titleTextStyle: {italic: false, bold: true},
                    ticks: xPropLabels
                  },
                  vAxis: {
                    title: 'Precipitation (mm)',
                    titleTextStyle: {italic: false, bold: true}
                  },
                  colors: ['f0af07', '0f8755', '76b349'],
                });
print(chart);
Линейная диаграмма
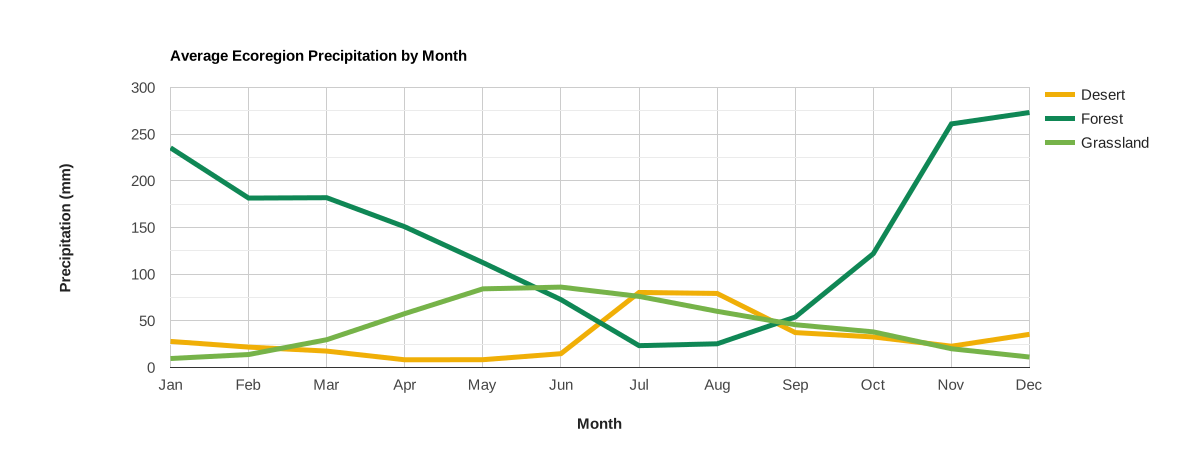
Свойства объектов наносятся на ось X, помечаются и сортируются по входным данным словаря; значения заданных свойств наносятся на ось Y. Ряды – это объекты, представленные линиями и помеченные значениями выбранного свойства.
Редактор кода (JavaScript)
// Import the example feature collection.
var ecoregions = ee.FeatureCollection('projects/google/charts_feature_example');

// Define a dictionary that associates property names with values and labels.
var precipInfo = {
  '01_ppt': {v: 1, f: 'Jan'},
  '02_ppt': {v: 2, f: 'Feb'},
  '03_ppt': {v: 3, f: 'Mar'},
  '04_ppt': {v: 4, f: 'Apr'},
  '05_ppt': {v: 5, f: 'May'},
  '06_ppt': {v: 6, f: 'Jun'},
  '07_ppt': {v: 7, f: 'Jul'},
  '08_ppt': {v: 8, f: 'Aug'},
  '09_ppt': {v: 9, f: 'Sep'},
  '10_ppt': {v: 10, f: 'Oct'},
  '11_ppt': {v: 11, f: 'Nov'},
  '12_ppt': {v: 12, f: 'Dec'}
};

// Organize property information into objects for defining x properties and
// their tick labels.
var xPropValDict = {};  // Dictionary to codify x-axis property names as values.
var xPropLabels = [];   // Holds dictionaries that label codified x-axis values.
for (var key in precipInfo) {
  xPropValDict[key] = precipInfo[key].v;
  xPropLabels.push(precipInfo[key]);
}

// Define the chart and print it to the console.
var chart = ui.Chart.feature
                .byProperty({
                  features: ecoregions,
                  xProperties: xPropValDict,
                  seriesProperty: 'label'
                })
                .setChartType('ScatterChart')
                .setOptions({
                  title: 'Average Ecoregion Precipitation by Month',
                  hAxis: {
                    title: 'Month',
                    titleTextStyle: {italic: false, bold: true},
                    ticks: xPropLabels
                  },
                  vAxis: {
                    title: 'Precipitation (mm)',
                    titleTextStyle: {italic: false, bold: true}
                  },
                  colors: ['f0af07', '0f8755', '76b349'],
                  lineSize: 5,
                  pointSize: 0
                });
print(chart);
Диаграмма с областями
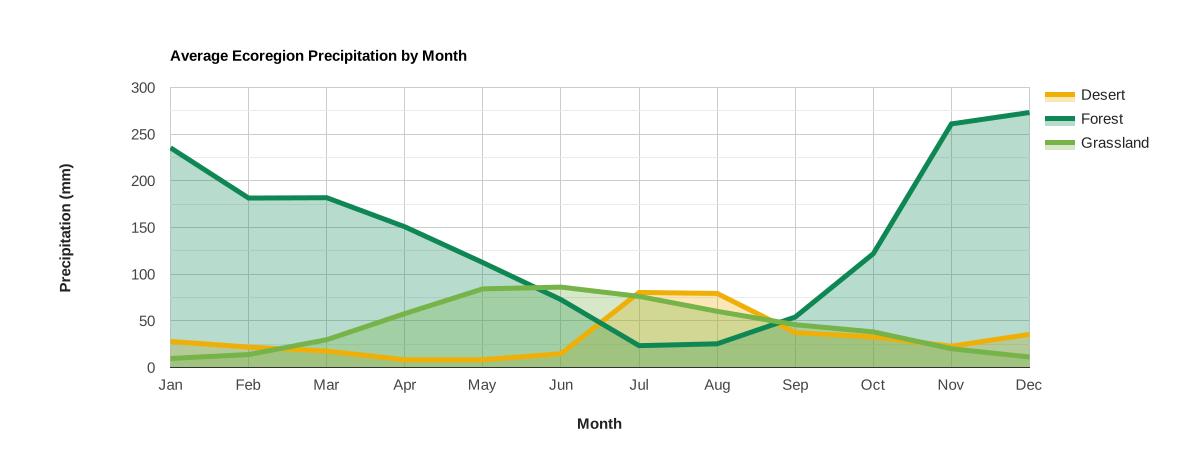
Свойства объектов наносятся на ось X, помечаются и сортируются по входным данным словаря; значения заданных свойств наносятся на ось Y. Ряды – это объекты, представленные линиями и затененными областями, помеченные значениями выбранного свойства.
Редактор кода (JavaScript)
// Import the example feature collection.
var ecoregions = ee.FeatureCollection('projects/google/charts_feature_example');

// Define a dictionary that associates property names with values and labels.
var precipInfo = {
  '01_ppt': {v: 1, f: 'Jan'},
  '02_ppt': {v: 2, f: 'Feb'},
  '03_ppt': {v: 3, f: 'Mar'},
  '04_ppt': {v: 4, f: 'Apr'},
  '05_ppt': {v: 5, f: 'May'},
  '06_ppt': {v: 6, f: 'Jun'},
  '07_ppt': {v: 7, f: 'Jul'},
  '08_ppt': {v: 8, f: 'Aug'},
  '09_ppt': {v: 9, f: 'Sep'},
  '10_ppt': {v: 10, f: 'Oct'},
  '11_ppt': {v: 11, f: 'Nov'},
  '12_ppt': {v: 12, f: 'Dec'}
};

// Organize property information into objects for defining x properties and
// their tick labels.
var xPropValDict = {};  // Dictionary to codify x-axis property names as values.
var xPropLabels = [];   // Holds dictionaries that label codified x-axis values.
for (var key in precipInfo) {
  xPropValDict[key] = precipInfo[key].v;
  xPropLabels.push(precipInfo[key]);
}

// Define the chart and print it to the console.
var chart = ui.Chart.feature
                .byProperty({
                  features: ecoregions,
                  xProperties: xPropValDict,
                  seriesProperty: 'label'
                })
                .setChartType('AreaChart')
                .setOptions({
                  title: 'Average Ecoregion Precipitation by Month',
                  hAxis: {
                    title: 'Month',
                    titleTextStyle: {italic: false, bold: true},
                    ticks: xPropLabels
                  },
                  vAxis: {
                    title: 'Precipitation (mm)',
                    titleTextStyle: {italic: false, bold: true}
                  },
                  colors: ['f0af07', '0f8755', '76b349'],
                  lineSize: 5,
                  pointSize: 0,
                  curveType: 'function'
                });
print(chart);
Круговая диаграмма
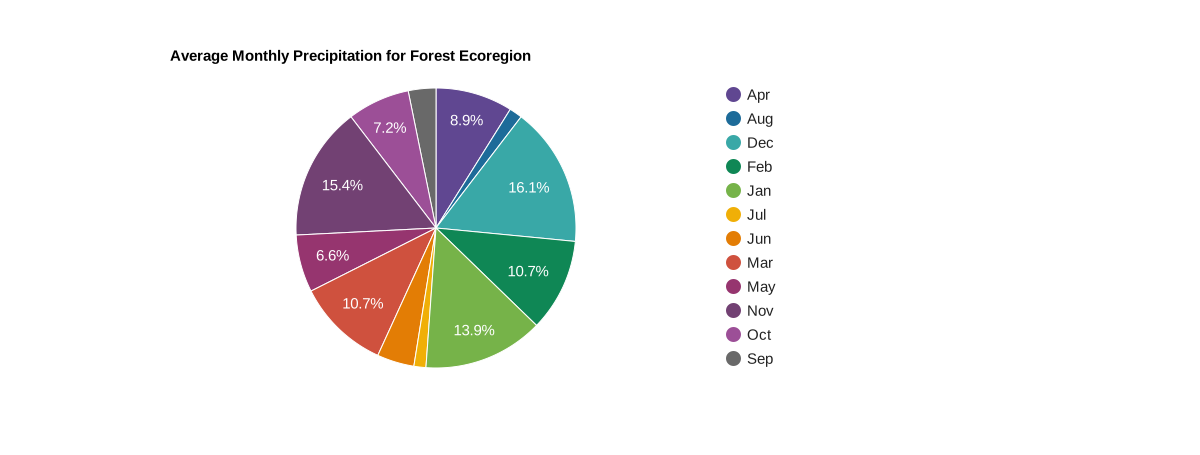
Круговая диаграмма – это объект, а каждый ее сектор – это ярлык свойства, значение которого выражено в процентах от суммы всех значений свойств, составляющих диаграмму.
Редактор кода (JavaScript)
// Import the example feature collection.
var ecoregions = ee.FeatureCollection('projects/google/charts_feature_example');

// Subset the forest ecoregion feature and select the monthly precipitation
// properties, rename them as abbreviated months.
var thisForest = ecoregions.filter(ee.Filter.eq('label', 'Forest'))
                     .select(Object.keys(precipInfo), [
                       'Jan', 'Feb', 'Mar', 'Apr', 'May', 'Jun', 'Jul', 'Aug',
                       'Sep', 'Oct', 'Nov', 'Dec'
                     ]);

// Define the chart and print it to the console.
var chart = ui.Chart.feature
                .byProperty({
                  features: thisForest,
                  xProperties: [
                    'Jan', 'Feb', 'Mar', 'Apr', 'May', 'Jun', 'Jul', 'Aug',
                    'Sep', 'Oct', 'Nov', 'Dec'
                  ]
                })
                .setChartType('PieChart')
                .setOptions({
                  title: 'Average Monthly Precipitation for Forest Ecoregion',
                  colors: [
                    '604791', '1d6b99', '39a8a7', '0f8755', '76b349', 'f0af07',
                    'e37d05', 'cf513e', '96356f', '724173', '9c4f97', '696969'
                  ]
                });
print(chart);
Кольцевая диаграмма
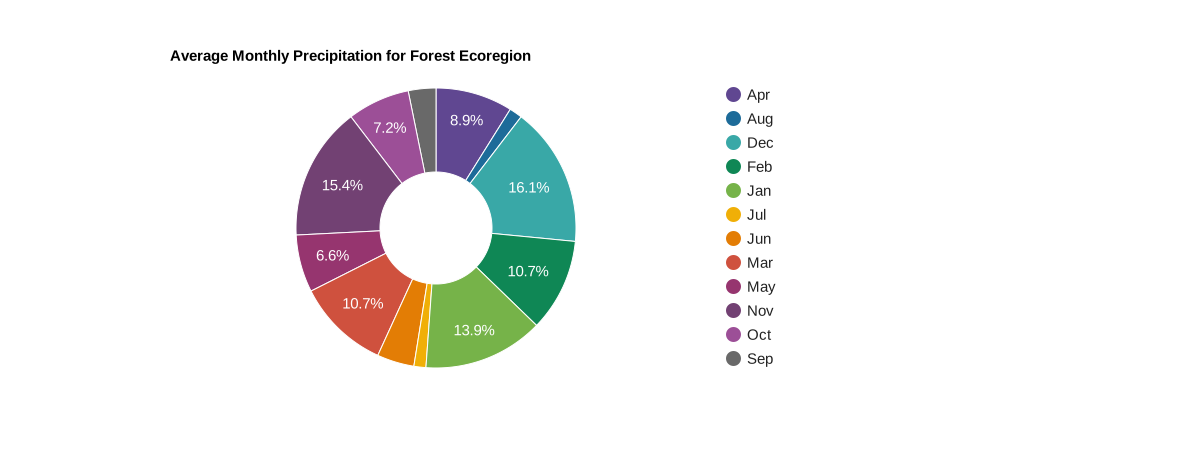
Чтобы преобразовать круговую диаграмму в кольцевую диаграмму, задайте параметр pieHole. Для большинства диаграмм лучше всего подходят значения от 0,4 до 0,6.
Редактор кода (JavaScript)
// Import the example feature collection.
var ecoregions = ee.FeatureCollection('projects/google/charts_feature_example');

// Subset the forest ecoregion feature and select the monthly precipitation
// properties, rename them as abbreviated months.
var thisForest = ecoregions.filter(ee.Filter.eq('label', 'Forest'))
                     .select(Object.keys(precipInfo), [
                       'Jan', 'Feb', 'Mar', 'Apr', 'May', 'Jun', 'Jul', 'Aug',
                       'Sep', 'Oct', 'Nov', 'Dec'
                     ]);

// Define the chart and print it to the console.
var chart = ui.Chart.feature
                .byProperty({
                  features: thisForest,
                  xProperties: [
                    'Jan', 'Feb', 'Mar', 'Apr', 'May', 'Jun', 'Jul', 'Aug',
                    'Sep', 'Oct', 'Nov', 'Dec'
                  ]
                })
                .setChartType('PieChart')
                .setOptions({
                  title: 'Average Monthly Precipitation for Forest Ecoregion',
                  colors: [
                    '604791', '1d6b99', '39a8a7', '0f8755', '76b349', 'f0af07',
                    'e37d05', 'cf513e', '96356f', '724173', '9c4f97', '696969'
                  ],
                  pieHole: 0.4,
                });
print(chart);
ui.Chart.feature.groups
Столбчатая
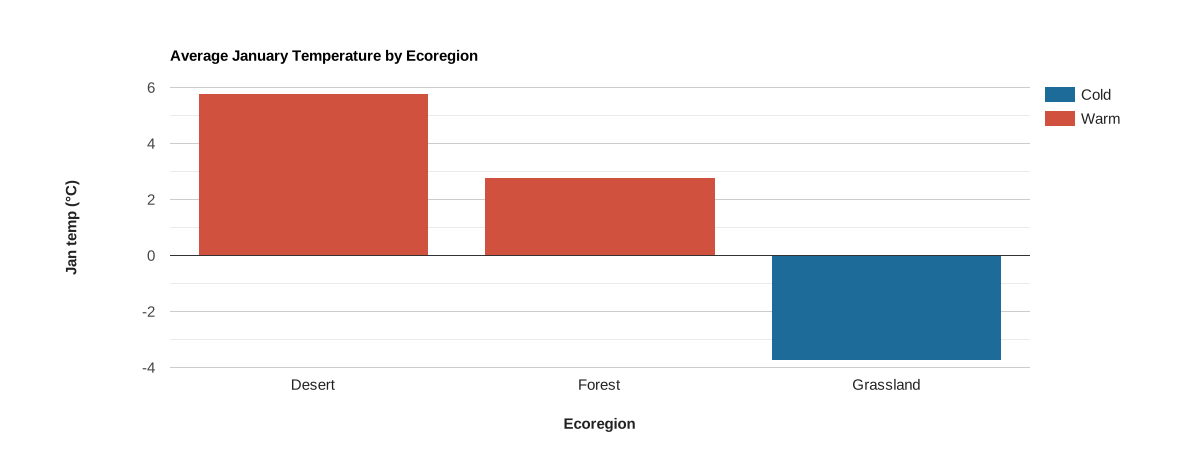
Объекты наносятся на ось X и помечаются значениями выбранного свойства.
Серии представлены столбцами, которые определяются набором уникальных значений заданного свойства. Положение оси Y определяется значением заданного свойства. Чтобы преобразовать график в точечную диаграмму, выберите тип 'ScatterChart' (.setChartType('ScatterChart')). Если по оси X откладывается время, лучше использовать график .setChartType('LineChart').
Редактор кода (JavaScript)
// Import the example feature collection.
var ecoregions = ee.FeatureCollection('projects/google/charts_feature_example');

// Define the chart and print it to the console.
var chart =
    ui.Chart.feature
        .groups({
          features: ecoregions,
          xProperty: 'label',
          yProperty: '01_tmean',
          seriesProperty: 'warm'
        })
        .setSeriesNames(['Warm', 'Cold'])
        .setChartType('ColumnChart')
        .setOptions({
          title: 'Average January Temperature by Ecoregion',
          hAxis:
              {title: 'Ecoregion', titleTextStyle: {italic: false, bold: true}},
          vAxis: {
            title: 'Jan temp (°C)',
            titleTextStyle: {italic: false, bold: true}
          },
          bar: {groupWidth: '80%'},
          colors: ['cf513e', '1d6b99'],
          isStacked: true
        });
print(chart);
ui.Chart.feature.histogram

Ось X определяется интервалами значений для диапазона значений выбранного свойства, а ось Y – количеством элементов в заданном интервале.
Редактор кода (JavaScript)
// Load PRISM climate normals image collection; convert images to bands.
var normClim = ee.ImageCollection('OREGONSTATE/PRISM/Norm91m').toBands();

// Make a point sample of climate variables for a region in western USA.
var region = ee.Geometry.Rectangle(-123.41, 40.43, -116.38, 45.14);
var climSamp = normClim.sample(region, 5000);

// Define the chart and print it to the console.
var chart =
    ui.Chart.feature
        .histogram({features: climSamp, property: '07_ppt', maxBuckets: 30})
        .setOptions({
          title: 'July Precipitation Distribution for NW USA',
          hAxis: {
            title: 'Precipitation (mm)',
            titleTextStyle: {italic: false, bold: true}
          },
          vAxis: {
            title: 'Pixel count',
            titleTextStyle: {italic: false, bold: true}
          },
          colors: ['1d6b99'],
          legend: {position: 'none'}
        });
print(chart);