Earth Engine has introduced noncommercial quota tiers to safeguard shared compute resources and ensure reliable performance for everyone. Noncommercial projects use the Community Tier by default, though you can change a project's tier at any time.
Gradients
Stay organized with collections
Save and categorize content based on your preferences.
Page Summary
You can compute the gradient of each band of an image using image.gradient().
The gradient() function outputs two bands: the gradient in the X-direction and the gradient in the Y-direction.
The X and Y gradients can be combined to calculate the gradient magnitude and direction.
You can compute the gradient of each band of an image with image.gradient().
For example, the following code computes the gradient magnitude and direction of the
Landsat 8 panchromatic band:
Note that gradient() outputs two bands: the gradient in the X-direction and the
gradient in the Y-direction. As shown in the example, the two directions can be combined to
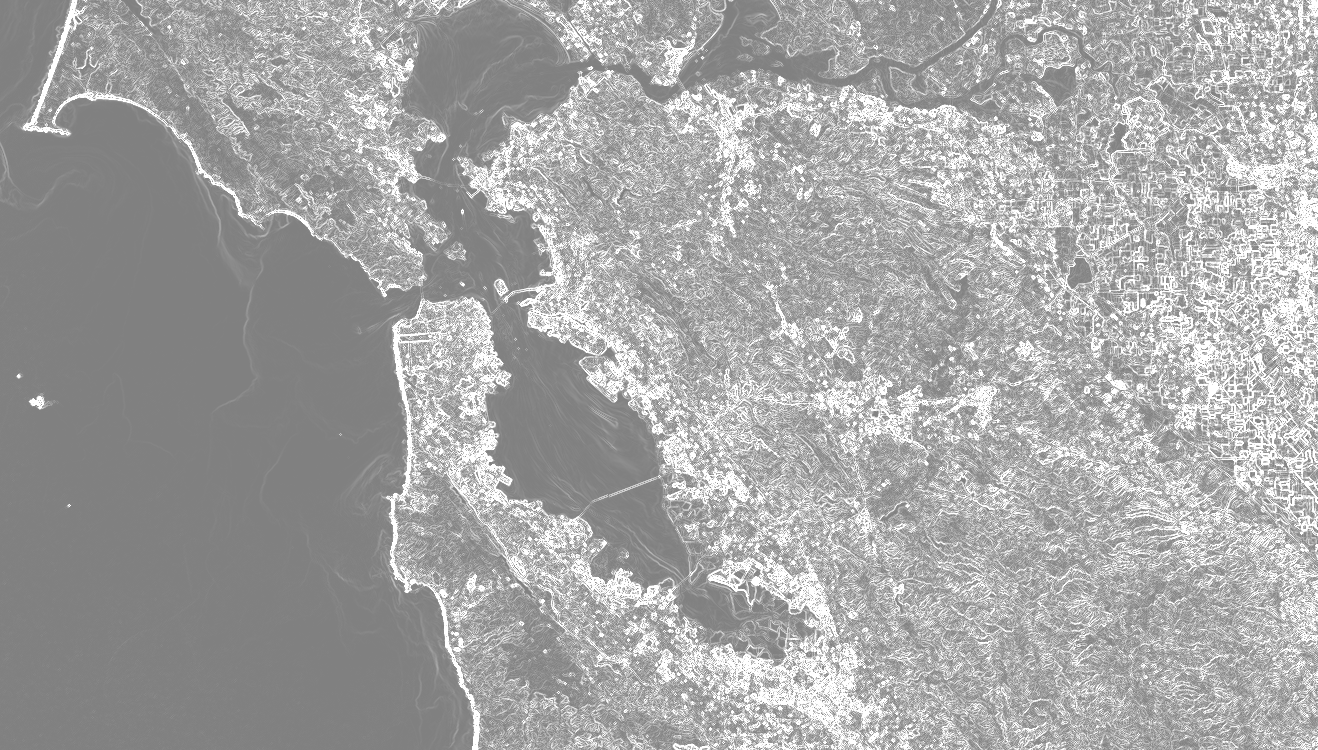
get gradient magnitude and direction. The magnitude should look something like Figure 1.
Figure 1. Panchromatic gradient magnitude for the Landsat 8 imagery over the
San Francisco Bay area, California, USA.
[[["Easy to understand","easyToUnderstand","thumb-up"],["Solved my problem","solvedMyProblem","thumb-up"],["Other","otherUp","thumb-up"]],[["Missing the information I need","missingTheInformationINeed","thumb-down"],["Too complicated / too many steps","tooComplicatedTooManySteps","thumb-down"],["Out of date","outOfDate","thumb-down"],["Samples / code issue","samplesCodeIssue","thumb-down"],["Other","otherDown","thumb-down"]],["Last updated 2023-10-06 UTC."],[],["The `image.gradient()` function computes the gradient of each image band, outputting X and Y-direction gradients. The example loads a Landsat 8 panchromatic band image, calculates the X and Y gradients, then determines the gradient's magnitude by combining the squared X and Y values and the gradient's direction using `atan2` function. Finally, it displays the gradient and its direction, centered on San Francisco. The image gradient magnitude is then illustrated.\n"]]