Page Summary
-
NDVI (Normalized Difference Vegetation Index) is a measure of vegetation photosynthetic activity calculated as (NIR - red) / (NIR + red).
-
In Earth Engine, NDVI can be computed for a single image using band selection and mathematical operations, or with a shortcut function
normalizedDifference. -
A function can be mapped over an image collection to add a new band, like NDVI, to every image.
-
The
qualityMosaic()function can create a composite image where each pixel is selected from the image with the highest value in a specified band, useful for creating a "greenest pixel" composite based on NDVI.
Previously, you learned how to get individual Landsat scenes by doing something like this,
where l8 and point are imports representing the Landsat 8 TOA
collection and an area-of-interest geometry:
Code Editor (JavaScript)
// Define a point of interest. Use the UI Drawing Tools to import a point
// geometry and name it "point" or set the point coordinates with the
// ee.Geometry.Point() function as demonstrated here.
var point = ee.Geometry.Point([-122.292, 37.9018]);

// Import the Landsat 8 TOA image collection.
var l8 = ee.ImageCollection('LANDSAT/LC08/C02/T1_TOA');

// Get the least cloudy image in 2015.
var image = ee.Image(
  l8.filterBounds(point)
    .filterDate('2015-01-01', '2015-12-31')
    .sort('CLOUD_COVER')
    .first()
);
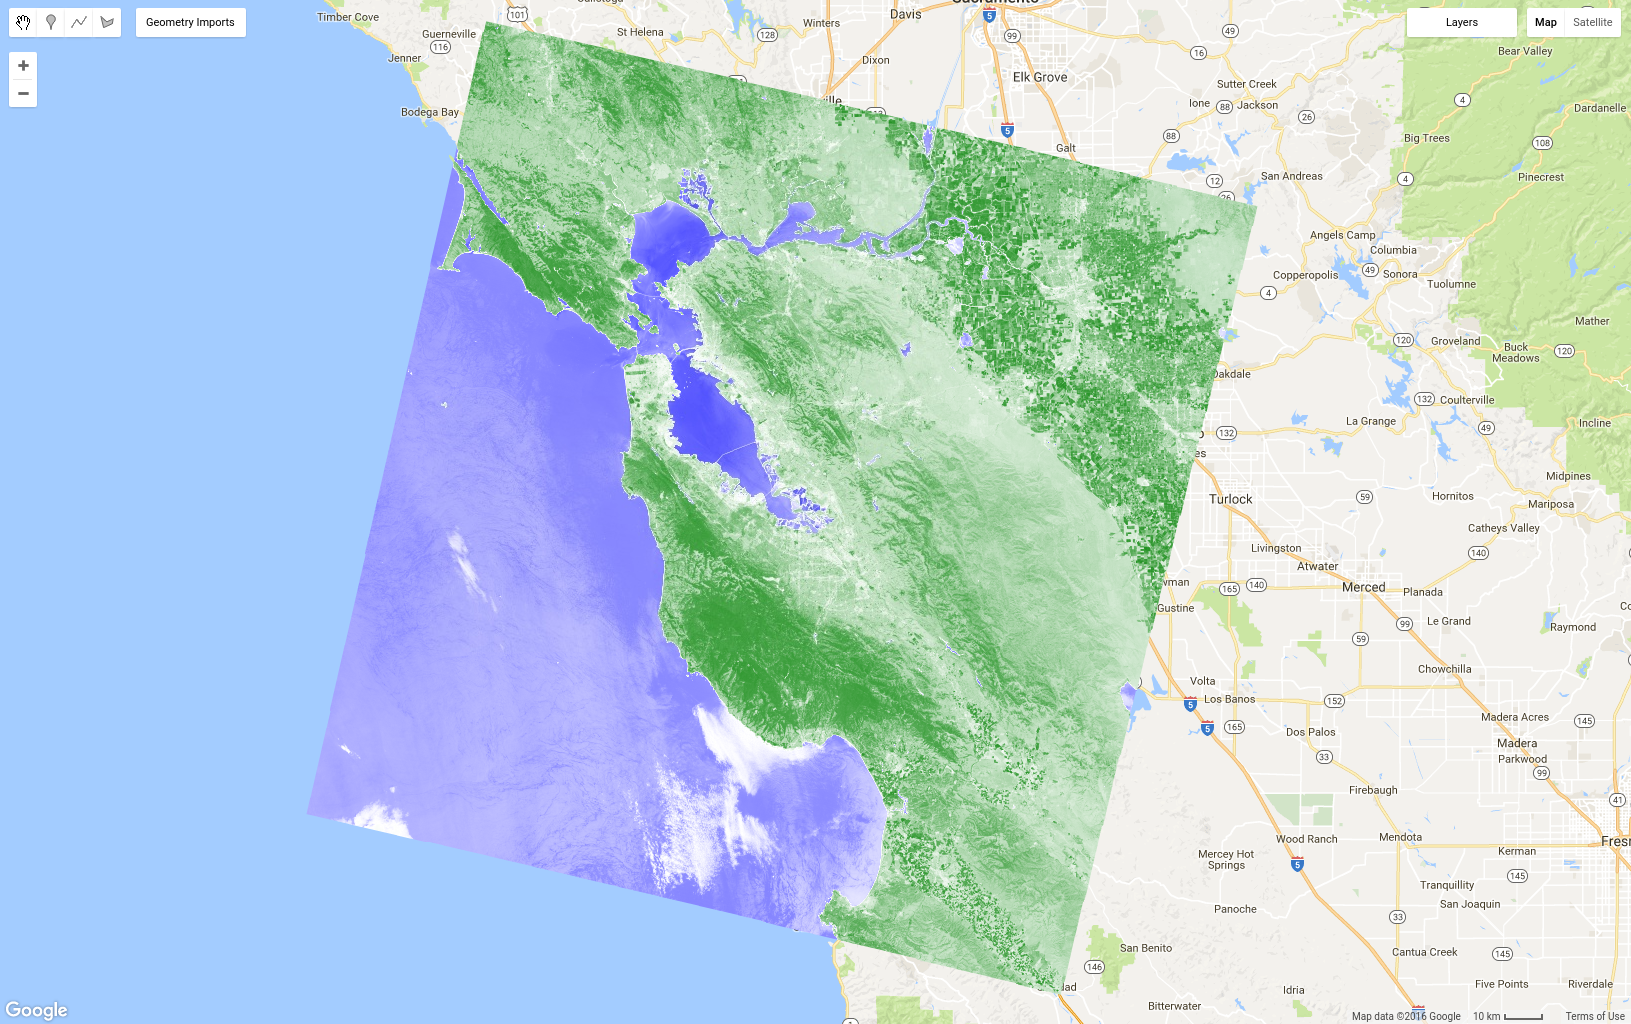
Suppose now that you want to compute a Normalized Difference Vegetation Index (NDVI) image from the Landsat image. Vegetation reflects light in the near-infrared (NIR) part of the electromagnetic spectrum and absorbs light in the red part (Learn more about NIR reflectance from vegetation). NDVI uses this to create a single value roughly reflecting the photosynthetic activity occurring at a pixel. The calculation is (NIR - red) / (NIR + red). This results in a number between 1 and -1, where pixels with high photosynthetic activity have a high NDVI. This is one way to compute NDVI in Earth Engine:
Code Editor (JavaScript)
// Compute the Normalized Difference Vegetation Index (NDVI).
var nir = image.select('B5');
var red = image.select('B4');
var ndvi = nir.subtract(red).divide(nir.add(red)).rename('NDVI');

// Display the result.
Map.centerObject(image, 9);
var ndviParams = {min: -1, max: 1, palette: ['blue', 'white', 'green']};
Map.addLayer(ndvi, ndviParams, 'NDVI image');
The result should look something like Figure 8. Note that we use the select()
function you learned about in the previous section on
masking to get the NIR and red bands, then compute NDVI using image mathematical
operators that that you have also seen before in
the section on Image math. Finally, display the image with a palette. Here
we used color names instead of hex strings in the palette. (See
this external
reference about CSS color for details.)
The normalized difference operation is so ubiquitous in remote sensing, there is a
shortcut function on an
ee.Image that is useful for simplifying the code in the previous example:
Code Editor (JavaScript)
var ndvi = image.normalizedDifference(['B5', 'B4']).rename('NDVI');
Mapping a Function over a Collection
Suppose now that you want to add NDVI to every image in an image collection. The
way to do that in Earth Engine is to map() a function over the collection.
Don't confuse map() with the Map object. The former is a method
on a collection, and uses map in the
parallel computing sense
of applying a function to every element in a collection. The function defines the
operations that will be applied to every element in the collection. You have seen
a simple function in the JavaScript tutorial, but
now we're going to make a function that includes Earth Engine functionality. For example,
copy the previous NDVI code into a function which returns the input image with an NDVI band:
Code Editor (JavaScript)
var addNDVI = function(image) {
  var ndvi = image.normalizedDifference(['B5', 'B4']).rename('NDVI');
  return image.addBands(ndvi);
};

// Test the addNDVI function on a single image.
var ndvi = addNDVI(image).select('NDVI');
This code might not be as efficient for computing NDVI for a single image, but this
function can be used as an argument to map() in order to add an NDVI band
to every image in the collection. It's often useful to first test a function on a single
image, to make sure the function is behaving as you expect. Once you've tested the function
on an individual image and have determined that it does what you want, you can map it
over the collection:
Code Editor (JavaScript)
var withNDVI = l8.map(addNDVI);
To verify that this is indeed putting an NDVI band in every image in this collection,
you can add the withNDVI collection to the map and query a random location
with the Inspector tab. You should notice that each image in the
collection now has a band called NDVI.
Make a greenest pixel composite
Now that you've made an image collection in which each image has an NDVI band, we can
explore a new way to make composites: qualityMosaic(). You may have noticed
discontinuities between Landsat paths, even in the median pixel composite. Part of the
reason for that may be due to differences in
phenology as a result of images in
adjacent paths being collected at different times (specifically, 8 days apart). One way to
minimize this is to try to set pixel values in the composite from roughly the same
phenological stage, for example the time of maximum greenness of plants (when the leaves
are on and photosynthetically active). If we let max greenness be defined by the maximum
NDVI, we can use
qualityMosaic() to
make a composite in which each pixel contains the maximum NDVI pixel from the collection.
Now you can make use of the added NDVI band in your withNDVI collection:
Code Editor (JavaScript)
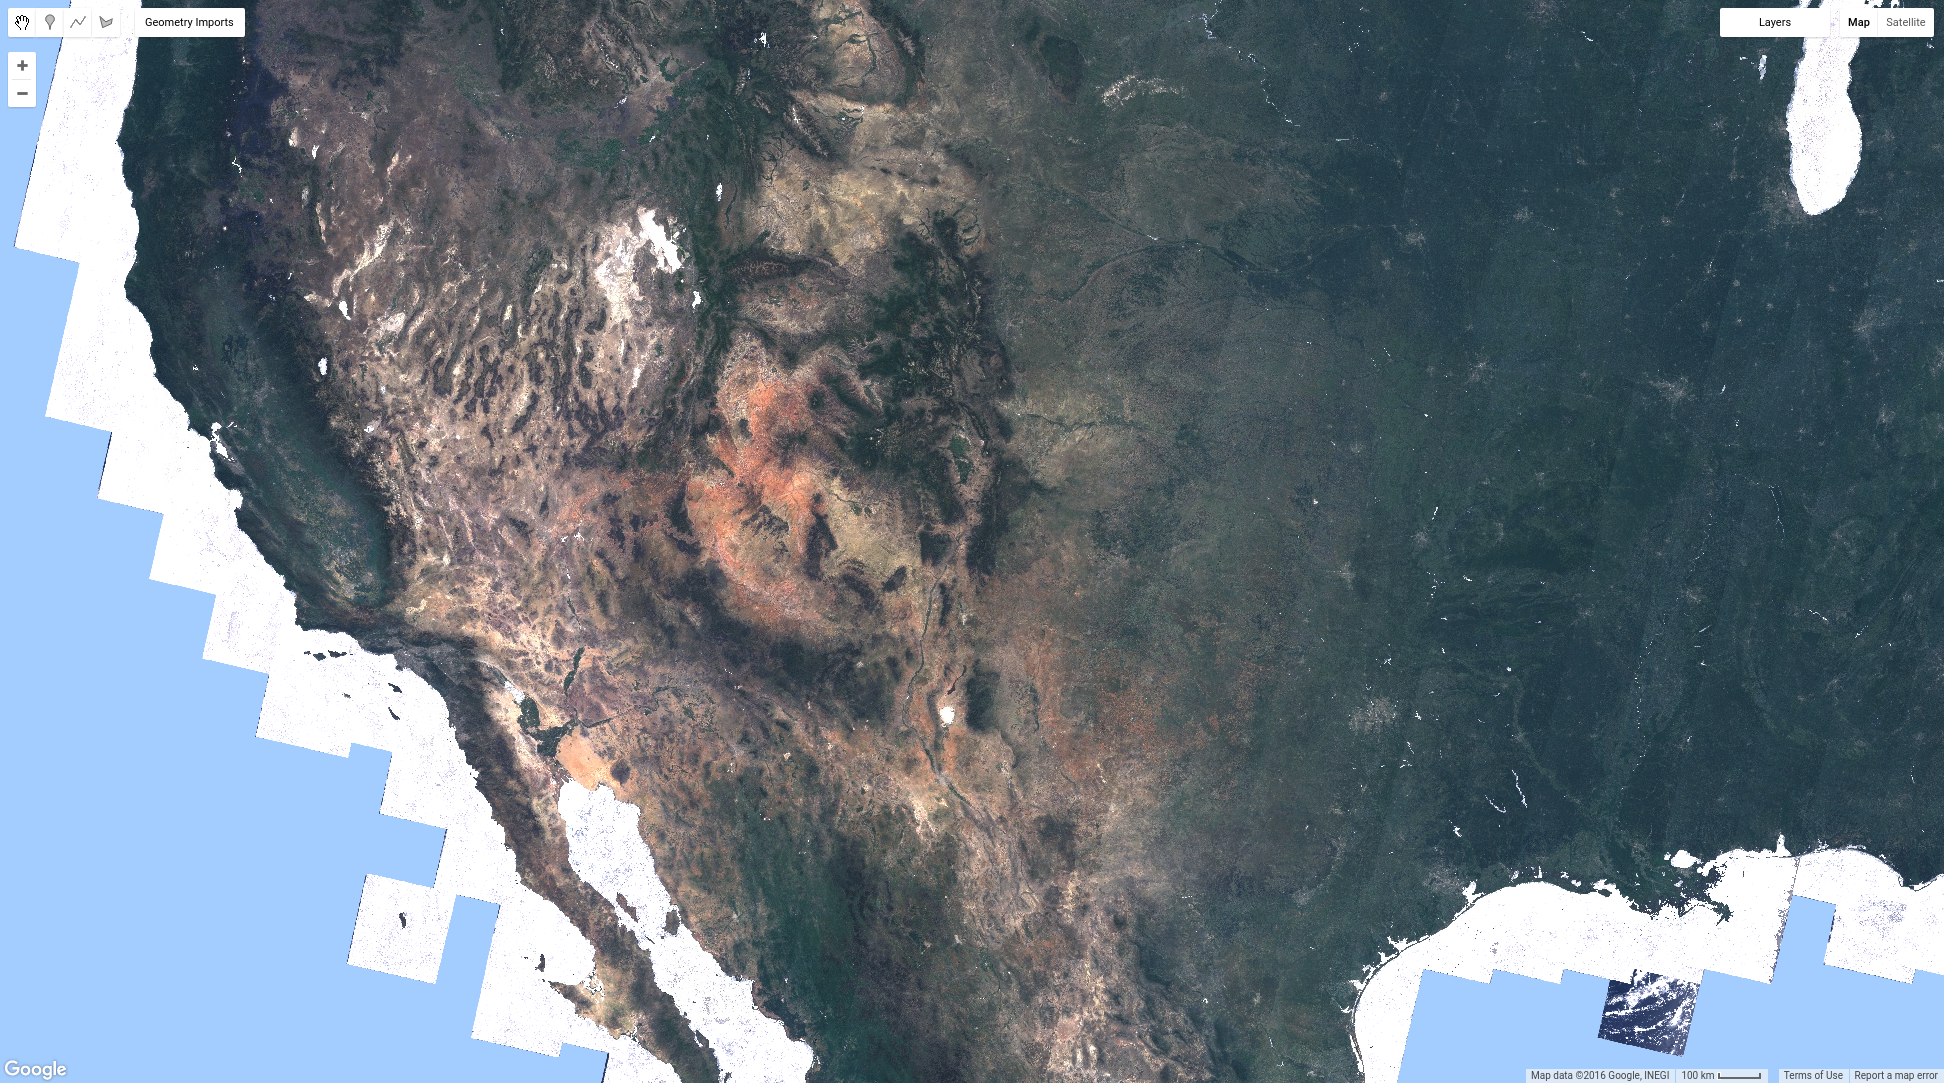
// Make a "greenest" pixel composite.
var greenest = withNDVI.qualityMosaic('NDVI');

// Display the result.
var visParams = {bands: ['B4', 'B3', 'B2'], max: 0.3};
Map.addLayer(greenest, visParams, 'Greenest pixel composite');
The result of this code should look something like Figure 9. Comparing Figure 9 to the
median composite shown in Figure 6,
observe that the greenest pixel composite is indeed much greener. However, close
examination of water bodies should make a different problem apparent. Specifically,
water bodies now appear cloudy. This is due to the way the qualityMosaic()
method works: at each location, the entire time series is examined and the pixel with the
maximum value in the NDVI band is set as the composite value. Because NDVI is higher over
clouds than water, water areas get cloudy pixels, while vegetated areas all appear green
because NDVI is highest when the vegetation in the pixel is photosynthetically active.
Now you've seen several ways to composite and mosaic images in Earth Engine. You can make recent-value, median, or greenest-pixel composites from images filtered by time and place or all images in the collection. You've learned how to do computations on the imagery and extract information. The next page covers ways to get information out of Earth Engine, for example as a chart or a dataset exported to your Google Drive folder.