Page Summary
-
This section focuses on visualizing the water occurrence layer of the GSW dataset, summarizing where and how often surface water appeared between March 1984 and October 2015.
-
The tutorial covers adding the water occurrence layer to the map, querying its values, applying custom styling, creating a binary water mask using a threshold, and centering the map on specific locations.
-
Code examples demonstrate how to select the occurrence band, add it to the map, inspect values using the inspector tab, improve visualization with custom parameters, and create a binary mask by thresholding the occurrence data.
-
Refactoring the code is shown to improve readability and maintainability by grouping similar statements and using named arguments for map layers.
-
You can center the map on various interesting locations by uncommenting provided
Map.setCenterstatements.
The GSW dataset contains many data layers that present the surface water data in different ways. We will start by visualizing the water occurrence layer, which provides a summary of where and how often surface water occurred over the entire time-period between March 1984 and October 2015.
This section of the tutorial will:
- add a map layer for visualizing surface water occurrence,
- show how to query values of the map layer,
- add custom styling to improve the visualization,
- create a binary water mask layer using a threshold value,
- center the map on interesting parts of the world, and
- show how to refactor the script to make it more readable and maintainable.
Creating a Basic Visualization
Start by copying the following statements into the Code Editor:
Code Editor (JavaScript)
var gsw = ee.Image('JRC/GSW1_0/GlobalSurfaceWater');
var occurrence = gsw.select('occurrence');
Map.addLayer(occurrence);
The first statement references the Earth Engine Image object for the GSW dataset, and
stores it in a variable named gsw.
The second statement selects a single layer of the GSW dataset, and stores it in a
variable called occurrence.
The third statement adds the occurrence image to the Code Editor's interactive map.
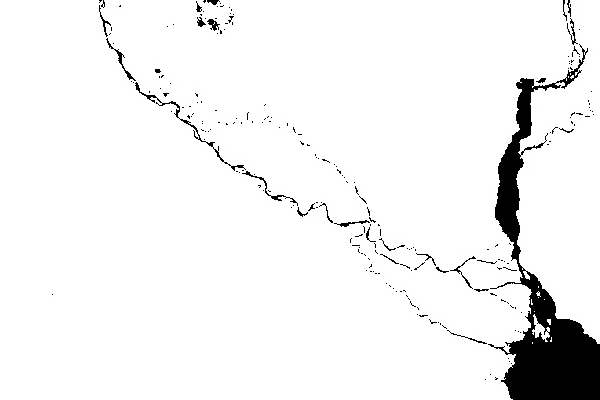
Click on the Code Editor's "Run" button, and after a few seconds you should see a map with grey coloring along the coastlines, similar to Figure 1.
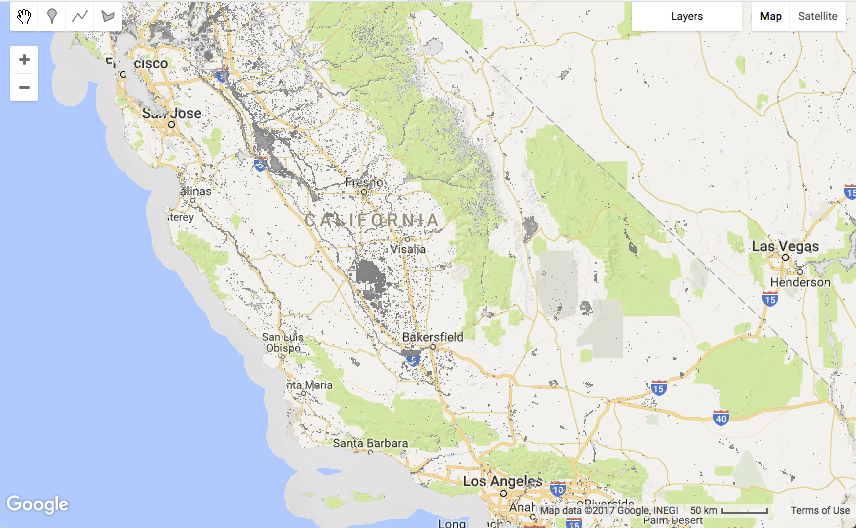
In most areas, the GSW dataset appears transparent, because locations where either Landsat images were not collected (i.e. ocean areas) or where water was not detected by any observations in the 32 years are masked out.
Inspecting Values
To explore values of the water occurrence layer, we will use the Code Editor's inspector tab. First click on the inspector tab, then click on the map to select a location. The inspector tab will display information on each of the layers that are present where you clicked.
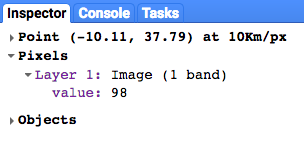
In the example above, the value of the layer named value is 98. The units are
percentage points, so approximately 98% of the time the location was classified as water covered.
The value is the average of each of the monthly surface water occurrence values, which
normalizes against seasonal variation, as described in the
Data Users Guide (v2)
.
Refactoring to Improve Your Code
Our script only contains two statements, but already we have an opportunity to refactor the
code so that our final script will be easier to read and maintain over time.
Currently, the Map.addLayer() statement passes a single argument
occurrence, which is the Earth Engine image object that we want to display on
the map. However, the Map.addLayer() method also allows for additional arguments
to be passed to it. To quickly see what arguments are available, place your cursor after the
opening parentheses and press the keyboard shortcut for "Show code suggestions" to bring up
the help document for the addLayer method. (Keyboard shortcuts can be viewed by
selecting the menu Help -> Shortcuts.)
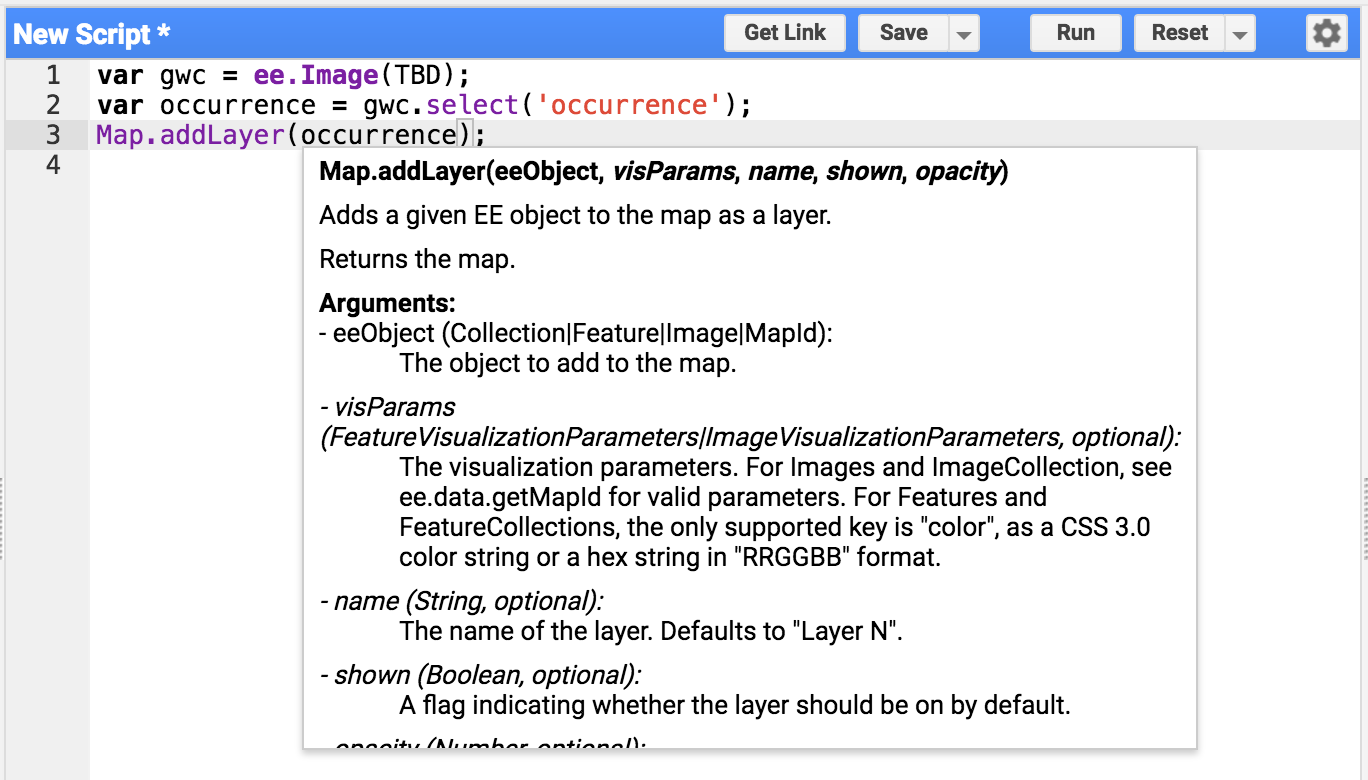
The keyboard shortcuts show that there are five arguments that can be passed to
Map.addLayer:
eeObject, visParams, name, shown, and
opacity.
In our current script we are passing a single variable occurrence which is
interpreted as the first argument, eeObject.
To pass both the variable object and an additional argument that names the layer, we can
refactor the code to use "named arguments" (eeObject and name)
where are passed within to the method from within a
JSON data structure
as shown below:
Code Editor (JavaScript)
Map.addLayer({eeObject: occurrence, name: 'Water Occurrence (1984-2015)'});
Run the code again to make sure it still works after the refactoring changes. The resulting map should remain unchanged.
Adding Visualization Parameters
Next, we will work on improving upon the default visualization parameters, which are making
our water appear gray. Add a new statement that creates a variable
VIS_OCCURRENCE and pass it as an additional argument to the addLayer method.
Code Editor (JavaScript)
var VIS_OCCURRENCE = {
  min: 0,
  max: 100,
  palette: ['red', 'blue']
};
Code Editor (JavaScript)
Map.addLayer({
  eeObject: occurrence.updateMask(occurrence.divide(100)),
  name: 'Water Occurrence (1984-2015)',
  visParams: VIS_OCCURRENCE
});
The visualization parameters stored in JSON structure VIS_OCCURRENCE indicate
that red should be used for a minimum value of 0% and blue for a maximum value of 100%.
The addition of .updateMask(occurrence.divide(100)) causes the
opacity/transparency of the pixels to be set based on the occurrence value.
Run the script again, and view the revised results from our styling changes.
The water areas are now blue! Progress!
Creating a Threshold Layer
The water occurrence image contains information on how often water is expected using a range of values from 0 to 100%. However, it is often useful to define a binary water layer (i.e. "water" vs. "non-water") based on a certain percentage of occurrence (i.e. a threshold value). We will use this simple binary layer as a clean background layer over which other GSW layers can be placed. Creating this threshold layer can be done using the following statements, which uses a threshold value of 90% to separate water and non-water.
First we define a new visualization variable VIS_WATER_MASK for holding styling
information for the water mask:
Code Editor (JavaScript)
var VIS_WATER_MASK = {
  palette: ['white', 'black']
};
Then we calculate a water mask layer using the greater than comparison operator
.gt(90) and then set the previously masked areas to zero using the
.unmask() method:
Code Editor (JavaScript)
// Create a water mask layer, and set the image mask so that non-water areas
// are opaque.
var water_mask = occurrence.gt(90).unmask(0);
And finally, add the layer to the map. In order to have this layer rendered under all
other layers, place the following statement before any other Map.addLayer
statements.
Code Editor (JavaScript)
Map.addLayer({
  eeObject: water_mask,
  visParams: VIS_WATER_MASK,
  name: '90% occurrence water mask'
});
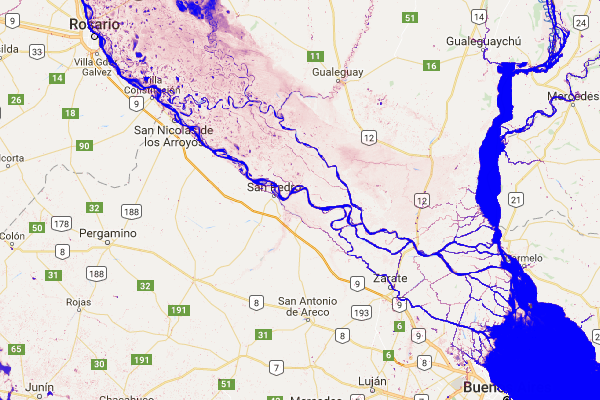
Going to Interesting Parts of the World
It is fun to explore the world by panning and zooming around, but the world is large and sometimes it helps to jump directly to a particular location. Here is a series of statements that provide a small sample of interesting locations, in terms of surface water. Just uncomment one of the statements at a time, and your script will go to that location when it is run.
Code Editor (JavaScript)
// Uncomment one of the following statements to center the map.
// Map.setCenter(-90.162, 29.8597, 10);   // New Orleans, USA
// Map.setCenter(-114.9774, 31.9254, 10); // Mouth of the Colorado River, Mexico
// Map.setCenter(-111.1871, 37.0963, 11); // Lake Powell, USA
// Map.setCenter(149.412, -35.0789, 11);  // Lake George, Australia
// Map.setCenter(105.26, 11.2134, 9);     // Mekong River Basin, SouthEast Asia
// Map.setCenter(90.6743, 22.7382, 10);   // Meghna River, Bangladesh
// Map.setCenter(81.2714, 16.5079, 11);   // Godavari River Basin Irrigation Project, India
// Map.setCenter(14.7035, 52.0985, 12);   // River Oder, Germany & Poland
// Map.setCenter(-59.1696, -33.8111, 9);  // Buenos Aires, Argentina
Map.setCenter(-74.4557, -8.4289, 11);  // Ucayali River, Peru
This is just a small sample of interesting locations. Feel free to add your own!
Refactoring, again...
Before we move on to the next layer of the GSW dataset, we are going to do a little more code refactoring. Specifically, we will group our similar statements together, and add some comments that will break up our code into sections for assets, constants, calculations, centering the map and adding map layers.
Here is the final refactored script:
Code Editor (JavaScript)
//////////////////////////////////////////////////////////////
// Asset List
//////////////////////////////////////////////////////////////

var gsw = ee.Image('JRC/GSW1_0/GlobalSurfaceWater');
var occurrence = gsw.select('occurrence');

//////////////////////////////////////////////////////////////
// Constants
//////////////////////////////////////////////////////////////

var VIS_OCCURRENCE = {
  min: 0,
  max: 100,
  palette: ['red', 'blue']
};
var VIS_WATER_MASK = {
  palette: ['white', 'black']
};

//////////////////////////////////////////////////////////////
// Calculations
//////////////////////////////////////////////////////////////

// Create a water mask layer, and set the image mask so that non-water areas
// are opaque.
var water_mask = occurrence.gt(90).unmask(0);

//////////////////////////////////////////////////////////////
// Initialize Map Location
//////////////////////////////////////////////////////////////

// Uncomment one of the following statements to center the map.
// Map.setCenter(-90.162, 29.8597, 10);   // New Orleans, USA
// Map.setCenter(-114.9774, 31.9254, 10); // Mouth of the Colorado River, Mexico
// Map.setCenter(-111.1871, 37.0963, 11); // Lake Powell, USA
// Map.setCenter(149.412, -35.0789, 11);  // Lake George, Australia
// Map.setCenter(105.26, 11.2134, 9);     // Mekong River Basin, SouthEast Asia
// Map.setCenter(90.6743, 22.7382, 10);   // Meghna River, Bangladesh
// Map.setCenter(81.2714, 16.5079, 11);   // Godavari River Basin Irrigation Project, India
// Map.setCenter(14.7035, 52.0985, 12);   // River Oder, Germany & Poland
// Map.setCenter(-59.1696, -33.8111, 9);  // Buenos Aires, Argentina
Map.setCenter(-74.4557, -8.4289, 11);  // Ucayali River, Peru

//////////////////////////////////////////////////////////////
// Map Layers
//////////////////////////////////////////////////////////////

Map.addLayer({
  eeObject: water_mask,
  visParams: VIS_WATER_MASK,
  name: '90% occurrence water mask',
  shown: false
});
Map.addLayer({
  eeObject: occurrence.updateMask(occurrence.divide(100)),
  name: 'Water Occurrence (1984-2015)',
  visParams: VIS_OCCURRENCE
});
In the next section, you explore how water occurrence has changed over time.