Page Summary
-
Earth Engine analysis results can be exported for use in reports and publications.
-
Charts of data over time for a specific location can be created and displayed in Earth Engine.
-
Cloud masking can be applied to improve the clarity of time series data like NDVI.
-
Images, such as composites, can be exported to Google Drive for external use.
Earth Engine is a powerful analytical tool, but you may have need to export the results
of your analysis in order to embed charts, images, maps, etc. into reports or
publications. In this section, you will learn how to create charts and images
that can be exported and viewed in other software. Recall that in the
previous section, you used code like the following to add an
NDVI band to every image in a collection, where the l8 variable references the
Landsat 8 TOA reflectance
collection:
Code Editor (JavaScript)
// Import the Landsat 8 TOA image collection.
var l8 = ee.ImageCollection('LANDSAT/LC08/C02/T1_TOA');

// Map a function over the Landsat 8 TOA collection to add an NDVI band.
var withNDVI = l8.map(function(image) {
  var ndvi = image.normalizedDifference(['B5', 'B4']).rename('NDVI');
  return image.addBands(ndvi);
});
Charting
Suppose that what you want is actually a chart of NDVI over time at a given location. To
make such a chart, the first step is to choose a location of interest. Create a point
by getting the point drawing tool ( )
and make a single point geometry in your area of interest. (If you already have imports,
hover on Geometry Imports and click + new layer first).
Locate the point in an area of agriculture, deciduous forest, annual grassland or some
other land cover with an annual cycle). Name the import
)
and make a single point geometry in your area of interest. (If you already have imports,
hover on Geometry Imports and click + new layer first).
Locate the point in an area of agriculture, deciduous forest, annual grassland or some
other land cover with an annual cycle). Name the import roi. (See
this page for information about creating geometries
programmatically).
Now let's use the roi point to make a chart of NDVI over time in the pixel
under that point. The way to make charts in Earth Engine is with the ui.Chart
package. (Learn more about making charts in Earth Engine).
Specifically, to make a chart over time, you can use the
ui.Chart.image.series() method:
Code Editor (JavaScript)
// Create a chart.
var chart = ui.Chart.image.series({
  imageCollection: withNDVI.select('NDVI'),
  region: roi,
  reducer: ee.Reducer.first(),
  scale: 30
}).setOptions({title: 'NDVI over time'});

// Display the chart in the console.
print(chart);
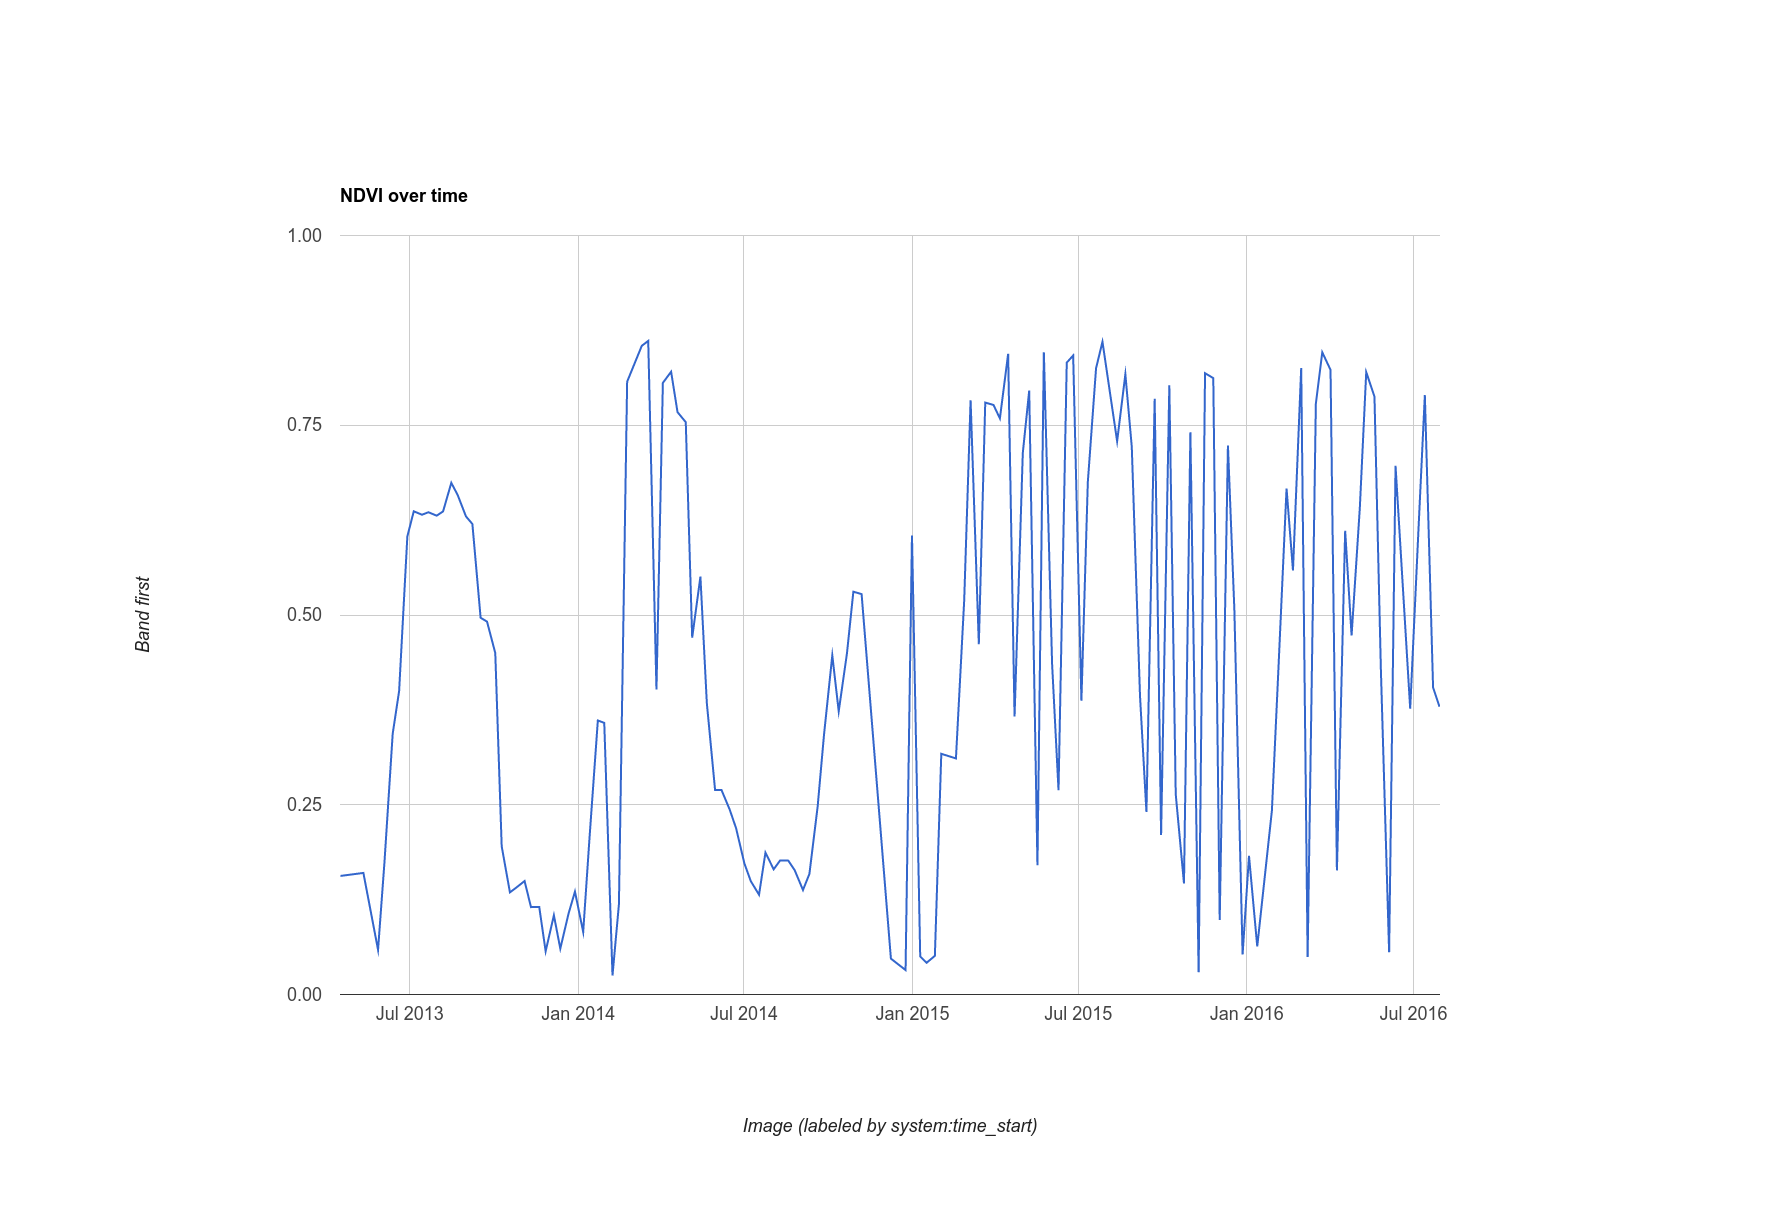
For the roi geometry, we chose a point in an agricultural area, resulting
in a chart that looks something like Figure 10. Note that the parameters to the chart
constructor include a reducer and scale like reduceRegion(). Since the
point we are providing as a region can only intersect one pixel, it suffices to use the
'first' reducer. If you have a larger region, you should use a 'mean' or other reducer
that specifies how to aggregate pixels. Also note that to visualize a chart, all you
have to do is print it.
Digression: Simple Cloud Masking for Landsat
Something you may have noticed about this chart is that the time series of NDVI values
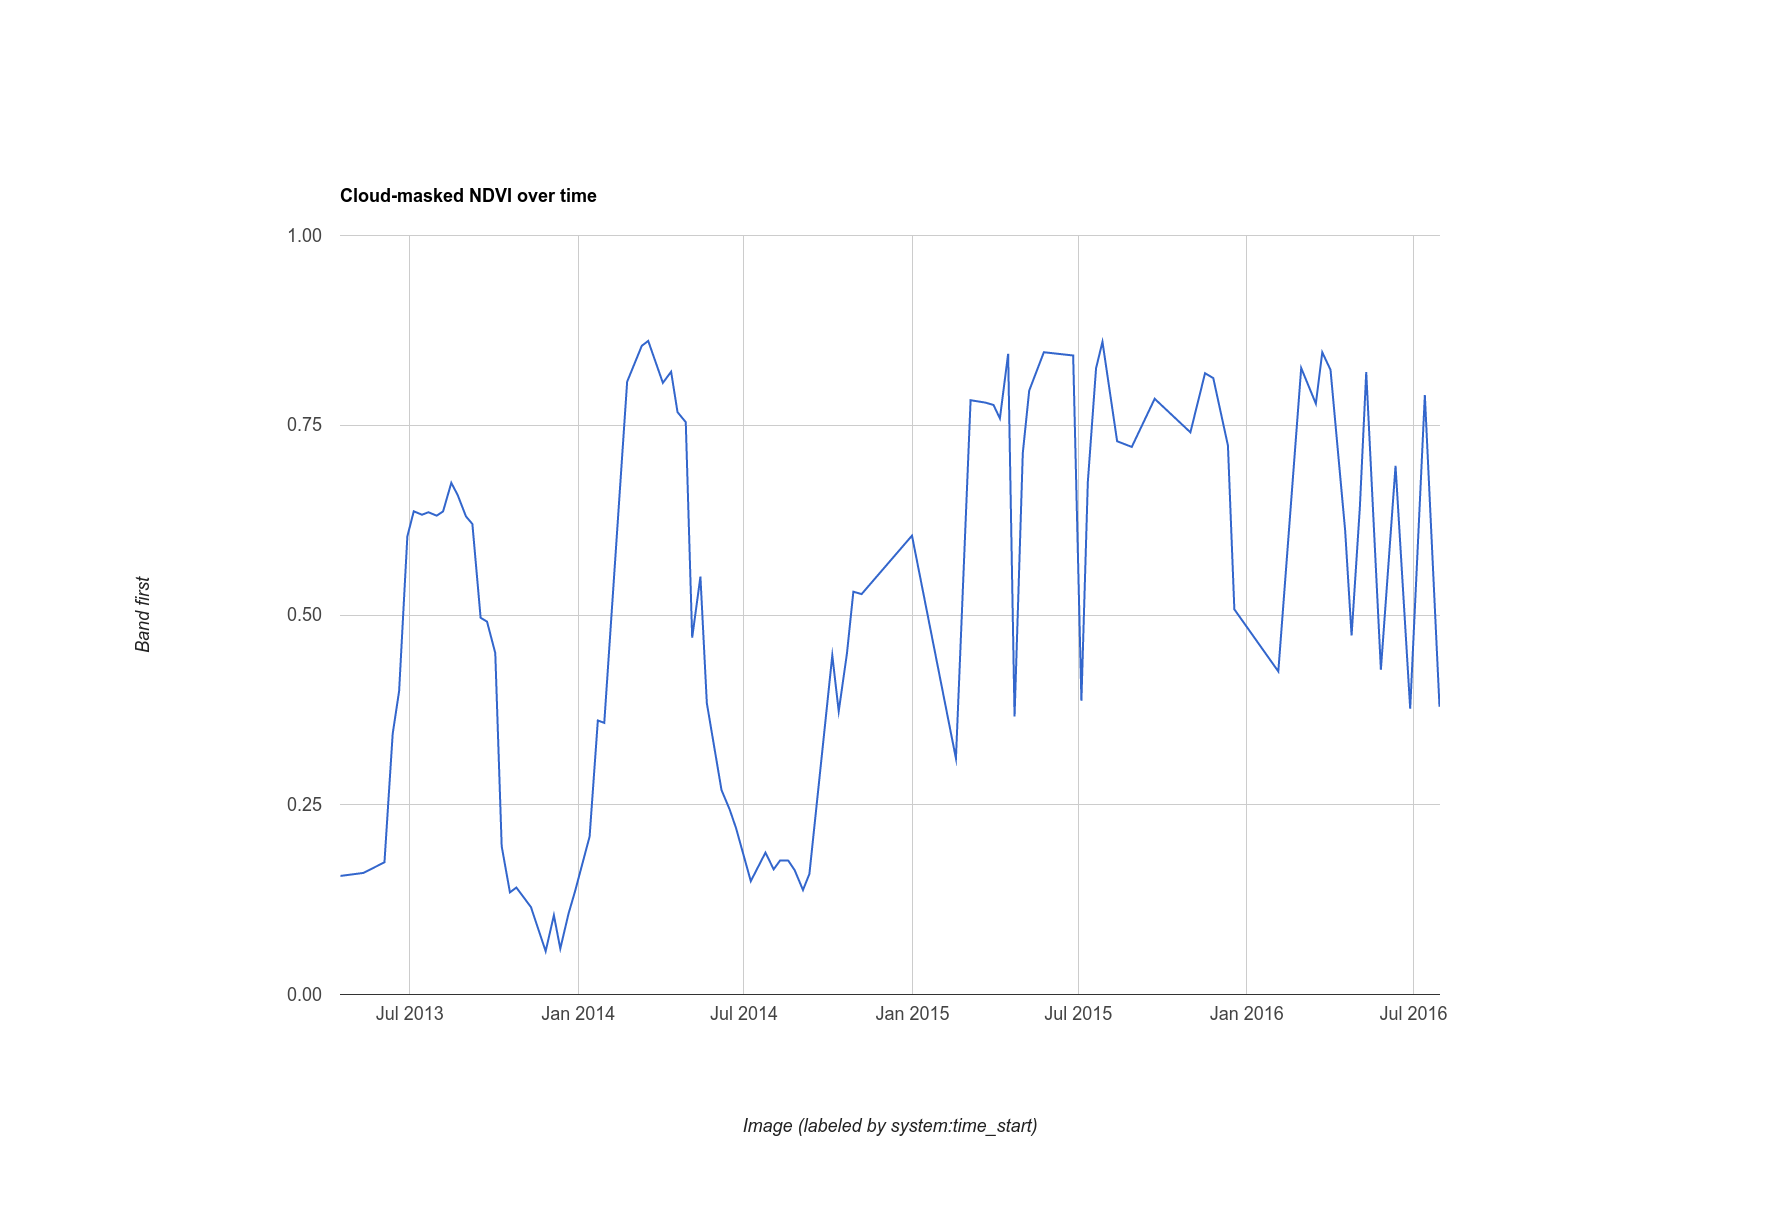
at the point looks a little noisy. This is likely due to clouds. To ameliorate this
effect, Earth Engine includes a cloud-masking algorithm for Landsat sensors with a
thermal band: ee.Algorithms.Landsat.simpleCloudScore(). It takes a Landsat TOA
reflectance image as input and adds a band named cloud which is an index
of cloudiness in the pixel from zero to 100, from least to most cloudy, respectively. By
modifying the function you mapped over the collection, you can use an arbitrary
threshold (20) on the cloud index to clean up the chart a bit:
Code Editor (JavaScript)
var cloudlessNDVI = l8.map(function(image) {
  // Get a cloud score in [0, 100].
  var cloud = ee.Algorithms.Landsat.simpleCloudScore(image).select('cloud');

  // Create a mask of cloudy pixels from an arbitrary threshold.
  var mask = cloud.lte(20);

  // Compute NDVI.
  var ndvi = image.normalizedDifference(['B5', 'B4']).rename('NDVI');

  // Return the masked image with an NDVI band.
  return image.addBands(ndvi).updateMask(mask);
});

print(ui.Chart.image.series({
  imageCollection: cloudlessNDVI.select('NDVI'),
  region: roi,
  reducer: ee.Reducer.first(),
  scale: 30
}).setOptions({title: 'Cloud-masked NDVI over time'}));
The cloud-masked result is illustrated in Figure 11. Note that the time series looks a little smoother, but may still contain pixels affected by clouds. Adjust the threshold on the cloud index and observe the charted time series to learn how this threshold can affect your results.
Exporting Images
You have seen a way to export a chart of data computed by Earth Engine, but what about a whole image? Suppose, for example that you have built a greenest-pixel composite as discussed in the previous section:
Code Editor (JavaScript)
var greenest = cloudlessNDVI.qualityMosaic('NDVI');
The only difference in this code from what you did previously is that now we're using
the cloud masked collection. You can export a subset (defined by a region) of this
using the Export package. (Learn more about exporting
raster and vector data from Earth Engine.) For example, to export an image that can be
easily embedded in other docs, let's create a visualization image,
as you've done previously, an Export it to your
Google Drive folder:
Code Editor (JavaScript)
// Create a 3-band, 8-bit, color-IR composite to export.
var visualization = greenest.visualize({
  bands: ['B5', 'B4', 'B3'],
  max: 0.4
});

// Create a task that you can launch from the Tasks tab.
Export.image.toDrive({
  image: visualization,
  description: 'Greenest_pixel_composite',
  scale: 30
});
When you run this code, note that a new task is created in the Tasks tab. To launch the export configuration dialog, click the RUN button in the Tasks tab. Once you've configured the task, click the Run button in the dialog to start the export. But before you do that, be warned:
The reason you should exercise caution when exporting without a region
argument is that if you set a relatively small value for scale, and the
Map is zoomed out to large area, then you will export a potentially very large
image to your Drive folder. See the Export.image.toDrive() docs in the
Docs tab for more details and a list of possible configuration parameters.
That concludes this introduction to the Earth Engine API! You have now seen much of the most common Earth Engine functionality and should be able to confidently proceed to more complex analyses. Be sure to read the docs and search the forum for answers to other questions. Happy coding!