프로젝션 문서에 설명된 대로 Earth Engine은 재프로젝션 중에 기본적으로 가장 가까운 이웃 리샘플링을 실행합니다. resample() 또는 reduceResolution() 메서드를 사용하여 이 동작을 변경할 수 있습니다. 구체적으로 이러한 메서드 중 하나가 입력 이미지에 적용되면 입력의 필요한 재프로젝션이 표시된 리샘플링 또는 집계 메서드를 사용하여 실행됩니다.
리샘플링
resample()를 사용하면 다음 재프로젝션 시 지정된 리샘플링 메서드 ('bilinear' 또는 'bicubic')가 사용됩니다. 입력은 출력 프로젝션에서 요청되므로 입력에 대한 다른 작업 전에 암시적 재프로젝션이 발생할 수 있습니다. 따라서 입력 이미지에서 resample()를 직접 호출합니다. 다음의 간단한 예시를 살펴보세요.
코드 편집기 (JavaScript)
// Load a Landsat image over San Francisco, California, UAS.
var landsat = ee.Image('LANDSAT/LC08/C02/T1_TOA/LC08_044034_20160323');

// Set display and visualization parameters.
Map.setCenter(-122.37383, 37.6193, 15);
var visParams = {bands: ['B4', 'B3', 'B2'], max: 0.3};

// Display the Landsat image using the default nearest neighbor resampling.
// when reprojecting to Mercator for the Code Editor map.
Map.addLayer(landsat, visParams, 'original image');

// Force the next reprojection on this image to use bicubic resampling.
var resampled = landsat.resample('bicubic');

// Display the Landsat image using bicubic resampling.
Map.addLayer(resampled, visParams, 'resampled');
import ee
import geemap.core as geemap
Colab (Python)
# Load a Landsat image over San Francisco, California, UAS.
landsat = ee.Image('LANDSAT/LC08/C02/T1_TOA/LC08_044034_20160323')

# Set display and visualization parameters.
m = geemap.Map()
m.set_center(-122.37383, 37.6193, 15)
vis_params = {'bands': ['B4', 'B3', 'B2'], 'max': 0.3}

# Display the Landsat image using the default nearest neighbor resampling.
# when reprojecting to Mercator for the Code Editor map.
m.add_layer(landsat, vis_params, 'original image')

# Force the next reprojection on this image to use bicubic resampling.
resampled = landsat.resample('bicubic')

# Display the Landsat image using bicubic resampling.
m.add_layer(resampled, vis_params, 'resampled')
'bicubic' 리샘플링을 사용하면 출력 픽셀이 원본 이미지에 비해 부드럽게 표시됩니다 (그림 1).


이 코드 샘플의 작업 순서는 그림 2에 나와 있습니다. 특히 지도 메르카토르 투영으로의 암시적 재프로젝션은 입력 이미지에 지정된 리샘플링 메서드로 실행됩니다.

그림 2. 코드 편집기에 표시되기 전에 입력 이미지에서 resample()가 호출될 때의 작업 플로우 차트입니다. 곡선은 재프로젝션으로의 정보 흐름을 나타냅니다. 특히 사용할 출력 프로젝션, 크기, 리샘플링 방법을 나타냅니다.
해상도 낮추기
재프로젝션 중에 리샘플링하는 대신 다른 프로젝션에서 픽셀을 더 큰 픽셀로 집계하는 것이 목표라고 가정해 보겠습니다. 이는 다양한 크기의 이미지 데이터 세트를 비교할 때 유용합니다(예: Landsat 기반 제품의 30미터 픽셀과 MODIS 기반 제품의 대략적인 픽셀(더 큰 크기)). reduceResolution() 메서드를 사용하여 이 집계 프로세스를 제어할 수 있습니다. resample()와 마찬가지로 이미지의 다음 재프로젝션에 영향을 주려면 입력에서 reduceResolution()를 호출합니다. 다음 예에서는 reduceResolution()를 사용하여 30m 해상도의 숲 덮음 데이터를 500m 해상도의 식생 지수와 비교합니다.
코드 편집기 (JavaScript)
// Load a MODIS EVI image.
var modis = ee.Image(ee.ImageCollection('MODIS/061/MOD13A1').first())
    .select('EVI');

// Display the EVI image near La Honda, California.
Map.setCenter(-122.3616, 37.5331, 12);
Map.addLayer(modis, {min: 2000, max: 5000}, 'MODIS EVI');

// Get information about the MODIS projection.
var modisProjection = modis.projection();
print('MODIS projection:', modisProjection);

// Load and display forest cover data at 30 meters resolution.
var forest = ee.Image('UMD/hansen/global_forest_change_2023_v1_11')
    .select('treecover2000');
Map.addLayer(forest, {max: 80}, 'forest cover 30 m');

// Get the forest cover data at MODIS scale and projection.
var forestMean = forest
    // Force the next reprojection to aggregate instead of resampling.
    .reduceResolution({
      reducer: ee.Reducer.mean(),
      maxPixels: 1024
    })
    // Request the data at the scale and projection of the MODIS image.
    .reproject({
      crs: modisProjection
    });

// Display the aggregated, reprojected forest cover data.
Map.addLayer(forestMean, {max: 80}, 'forest cover at MODIS scale');
import ee
import geemap.core as geemap
Colab (Python)
# Load a MODIS EVI image.
modis = ee.Image(ee.ImageCollection('MODIS/006/MOD13A1').first()).select('EVI')

# Display the EVI image near La Honda, California.
m.set_center(-122.3616, 37.5331, 12)
m.add_layer(modis, {'min': 2000, 'max': 5000}, 'MODIS EVI')

# Get information about the MODIS projection.
modis_projection = modis.projection()
display('MODIS projection:', modis_projection)

# Load and display forest cover data at 30 meters resolution.
forest = ee.Image('UMD/hansen/global_forest_change_2015').select(
    'treecover2000'
)
m.add_layer(forest, {'max': 80}, 'forest cover 30 m')

# Get the forest cover data at MODIS scale and projection.
forest_mean = (
    forest
    # Force the next reprojection to aggregate instead of resampling.
    .reduceResolution(reducer=ee.Reducer.mean(), maxPixels=1024)
    # Request the data at the scale and projection of the MODIS image.
    .reproject(crs=modis_projection)
)

# Display the aggregated, reprojected forest cover data.
m.add_layer(forest_mean, {'max': 80}, 'forest cover at MODIS scale')
이 예시에서 출력 프로젝션은 reproject()로 명시적으로 설정됩니다. MODIS 사인파 투영으로 재투영하는 동안 리샘플링이 아닌 지정된 리듀서 (예: ee.Reducer.mean())를 사용하여 더 작은 픽셀이 집계됩니다. 이러한 연산 시퀀스는 그림 3에 나와 있습니다. 이 예에서는 reduceResolution()의 효과를 시각화하는 데 reproject()를 사용하지만 대부분의 스크립트는 명시적으로 다시 투영할 필요가 없습니다. 여기에서 경고를 참고하세요.

그림 3. reproject() 전에 입력 이미지에서 reduceResolution()가 호출될 때의 작업 플로우 차트입니다. 곡선은 재프로젝션으로의 정보 흐름을 나타냅니다. 구체적으로는 사용할 출력 프로젝션, 크기, 픽셀 집계 방법을 나타냅니다.
ReduceResolution의 픽셀 두께
reduceResolution() 집계 프로세스 중에 사용되는 픽셀의 가중치는 집계되는 작은 픽셀과 출력 투영에서 지정된 큰 픽셀 간의 겹침을 기반으로 합니다. 이는 그림 4에 나와 있습니다.
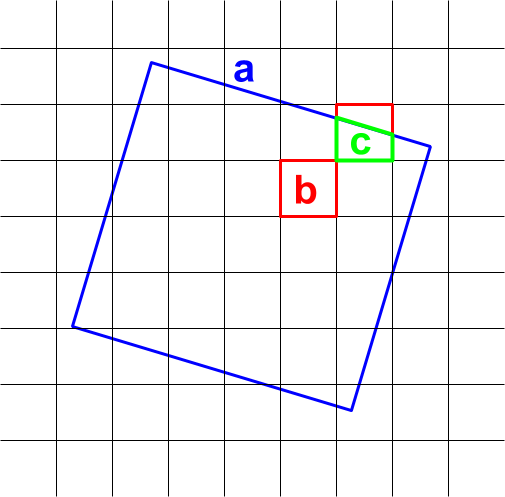
그림 4. reduceResolution()의 입력 픽셀 (검은색) 및 출력 픽셀 (파란색)
기본 동작은 입력 픽셀 가중치가 입력 픽셀로 덮인 출력 픽셀 영역의 비율로 계산됩니다. 다이어그램에서 출력 픽셀의 면적은 a이고 교차 영역이 b인 입력 픽셀의 가중치는 b/a로 계산되며 교차 영역이 c인 입력 픽셀의 가중치는 c/a로 계산됩니다. 이 동작으로 인해 평균 리듀서 이외의 리듀서를 사용할 때 예기치 않은 결과가 발생할 수 있습니다. 예를 들어 픽셀당 숲 지역을 계산하려면 평균 감소기를 사용하여 덮인 픽셀의 비율을 계산한 다음 면적으로 곱합니다 (작은 픽셀의 면적을 계산한 다음 합 감소기로 더하는 대신).
코드 편집기 (JavaScript)
// Compute forest area per MODIS pixel.
var forestArea = forest.gt(0)
    // Force the next reprojection to aggregate instead of resampling.
    .reduceResolution({
      reducer: ee.Reducer.mean(),
      maxPixels: 1024
    })
    // The reduce resolution returns the fraction of the MODIS pixel
    // that's covered by 30 meter forest pixels.  Convert to area
    // after the reduceResolution() call.
    .multiply(ee.Image.pixelArea())
    // Request the data at the scale and projection of the MODIS image.
    .reproject({
      crs: modisProjection
    });
Map.addLayer(forestArea, {max: 500 * 500}, 'forested area at MODIS scale');
import ee
import geemap.core as geemap
Colab (Python)
# Compute forest area per MODIS pixel.
forest_area = (
    forest.gt(0)
    # Force the next reprojection to aggregate instead of resampling.
    .reduceResolution(reducer=ee.Reducer.mean(), maxPixels=1024)
    # The reduce resolution returns the fraction of the MODIS pixel
    # that's covered by 30 meter forest pixels.  Convert to area
    # after the reduceResolution() call.
    .multiply(ee.Image.pixelArea())
    # Request the data at the scale and projection of the MODIS image.
    .reproject(crs=modis_projection)
)
m.add_layer(forest_area, {'max': 500 * 500}, 'forested area at MODIS scale')
m