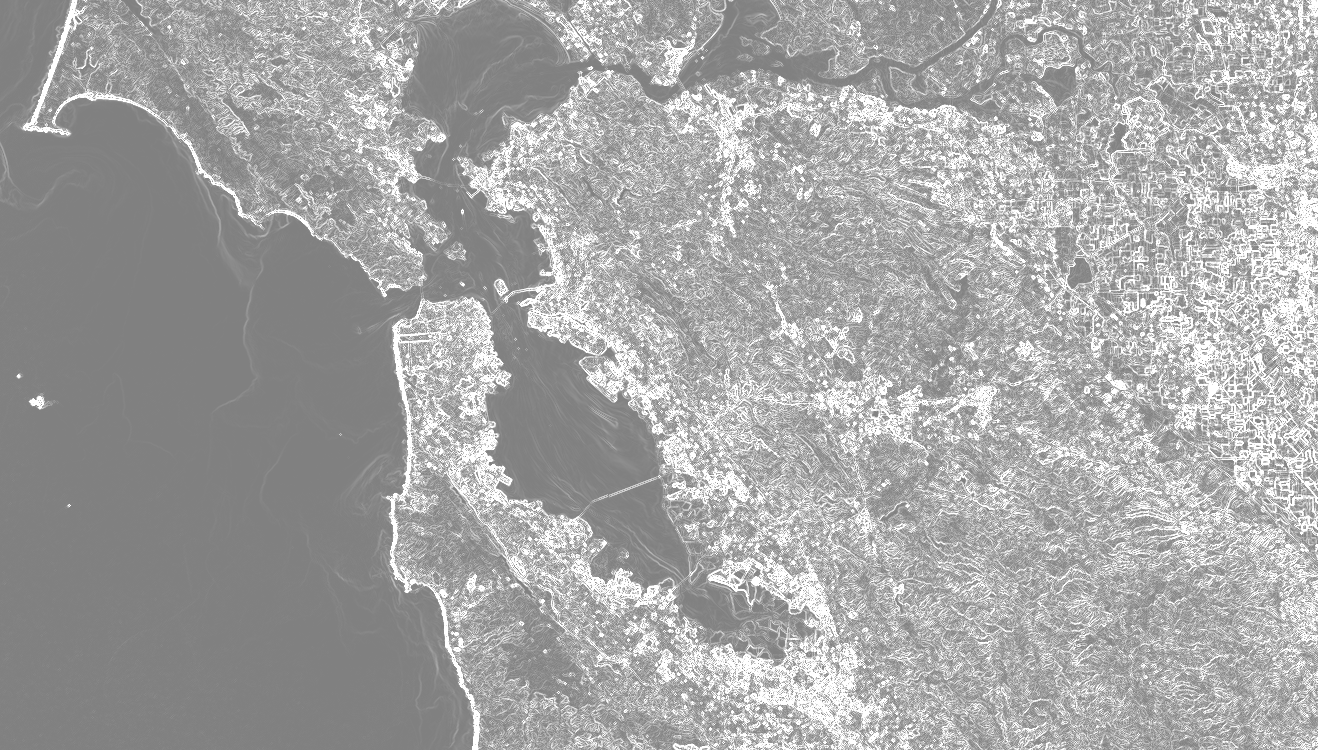
[[["เข้าใจง่าย","easyToUnderstand","thumb-up"],["แก้ปัญหาของฉันได้","solvedMyProblem","thumb-up"],["อื่นๆ","otherUp","thumb-up"]],[["ไม่มีข้อมูลที่ฉันต้องการ","missingTheInformationINeed","thumb-down"],["ซับซ้อนเกินไป/มีหลายขั้นตอนมากเกินไป","tooComplicatedTooManySteps","thumb-down"],["ล้าสมัย","outOfDate","thumb-down"],["ปัญหาเกี่ยวกับการแปล","translationIssue","thumb-down"],["ตัวอย่าง/ปัญหาเกี่ยวกับโค้ด","samplesCodeIssue","thumb-down"],["อื่นๆ","otherDown","thumb-down"]],["อัปเดตล่าสุด 2025-07-25 UTC"],[],["The `image.gradient()` function computes the gradient of each image band, outputting X and Y-direction gradients. The example loads a Landsat 8 panchromatic band image, calculates the X and Y gradients, then determines the gradient's magnitude by combining the squared X and Y values and the gradient's direction using `atan2` function. Finally, it displays the gradient and its direction, centered on San Francisco. The image gradient magnitude is then illustrated.\n"]]