Page Summary
-
A
ui.Panelis a container for arranging widgets, controlling their layout with aui.Panel.Layoutobject. -
The
ui.rootis a fixedui.Panelinstance for the Code Editor content below the horizontal bar, initially containing the default map. -
Layouts, either flow or absolute, determine how widgets are arranged within a panel and are specified with the
ui.Panel.Layoutclass. -
The
widgets()method returns a panel'sui.data.ActiveList, allowing for manipulation of the widgets within the panel.
Panels
A ui.Panel is an upper-level UI container in which to arrange widgets. Each
ui.Panel has a ui.Panel.Layout object that controls how its
widgets are arranged on the screen. Learn more in the Layouts
section. Panels also maintain a list of widgets (which could include other panels)
that have been added to them. To manage widgets in the panel, either add()
or remove() them from the panel, or retrieve the list of widgets by calling
widgets() on the panel. The widgets list is an instance of
ui.data.ActiveList, which means that you can configure the panel by manipulating
the list and the widgets in it.
ui.root
The ui.root is a fixed instance of a ui.Panel for everything
in the Code Editor below the horizontal bar. By default, it contains only a single
widget: the default map. Specifically, the item at ui.root.widgets().get(0)
is the Map object (an instance of ui.Map) that is displayed
by default in the Code Editor). In addition to the Map alias, the only
other special thing about the default Map is that it has geometry editing tools in it. To
obtain an empty canvas in which to build your UI, clear() the default map
out of ui.root:
Code Editor (JavaScript)
ui.root.clear();
Alternatively, it's possible to modify the default map in the root panel by adding widgets to it. Specifically, think of a map as a panel with an absolute layout (see the Layouts section for details). The following example illustrates a modification of the default map:
Code Editor (JavaScript)
// Load a VIIRS surface reflectance image and display on the map.
var image = ee.Image('NOAA/VIIRS/001/VNP09GA/2022_06_05').select('M.*');
Map.addLayer(image, {bands: ['M5', 'M4', 'M3'], min: 0, max: 4e3, gamma: 1.5});

// Create the title label.
var title = ui.Label('Click to inspect');
title.style().set('position', 'top-center');
Map.add(title);

// Create a panel to hold the chart.
var panel = ui.Panel();
panel.style().set({
  width: '400px',
  position: 'bottom-right'
});
Map.add(panel);

// Register a function to draw a chart when a user clicks on the map.
Map.style().set('cursor', 'crosshair');
Map.onClick(function(coords) {
  panel.clear();
  var point = ee.Geometry.Point(coords.lon, coords.lat);
  var chart = ui.Chart.image.regions(image, point, null, 30);
  chart.setOptions({title: 'Band values'});
  panel.add(chart);
});
Note that the example modifies the default map (which is Map) by treating
it as a panel and adding widgets to it. Because maps have absolute layout, the position
of a widget on a map is determined by a position property of the
style property of the widget. See the absolute
layout section for details.
When you share a Code Editor link with another user, by default the ui.root
takes up most of the window, and the text editor, docs panel, and console are hidden. By
controlling the ui.root layout, you can control how other users experience
your script.
Layouts
Layouts control how widgets in a panel are arranged for display. There are two layout
options, described below: flow layout and absolute layout. Layouts are specified with
the ui.Panel.Layout class. Set a panel's layout either in the constructor
or with setLayout(). The order in which widgets are added determines
how widgets are arranged in a panel with flow layout. The position property
each widget's style determines how a widget will be arranged in a panel
with absolute layout. If the style on a widget is irrelevant for the layout in which
the widget is placed, it's ignored.
Flow
A flow layout displays widgets in a row ('horizontal') or a column
('vertical'). The widgets are arranged according to the order in which
they are added to the panel. For example, consider the following buttons added to a panel:
Code Editor (JavaScript)
// Create a panel with vertical flow layout.
var panel = ui.Panel({
  layout: ui.Panel.Layout.flow('vertical'),
  style: {width: '300px'}
});

// Add a bunch of buttons.
for (var i = 0; i < 30; i++) {
  panel.add(ui.Button({label: 'Button ' + i, style: {stretch: 'horizontal'}}));
}

ui.root.clear();
ui.root.add(panel);
The vertical layout should look something like:
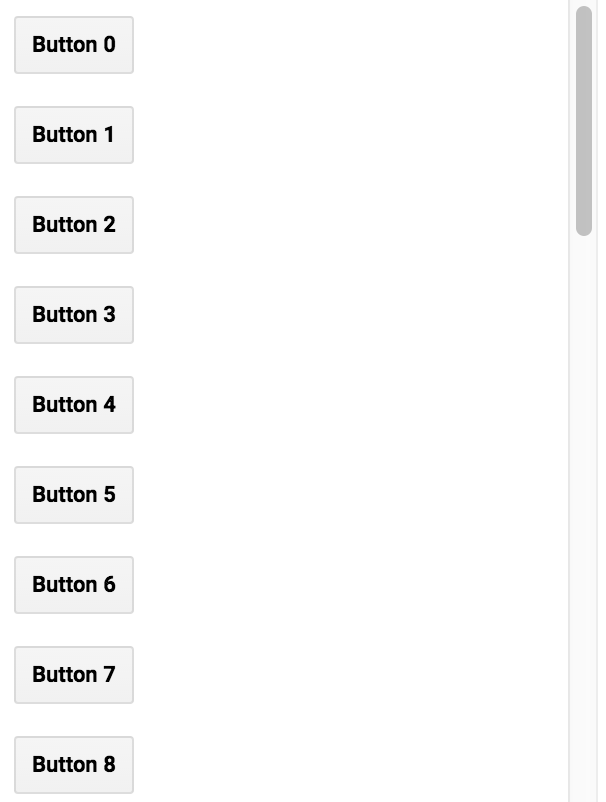
Note that the width of the panel is set to 300 pixels and the
stretch is set to 'horizontal' with the style
property. The stretch style property applies to widgets in a panel with
flow layout. For example, {stretch: 'horizontal'} means the widget will
expand to fill available horizontal space within the panel. In the previous example,
change the flow layout type to 'horizontal' to see the buttons arranged
in a row instead of a column.
In a horizontal flow panel, a horizontally stretched widget expands to fill the space available after all other widgets have taken up their natural widths. If more than one widget is stretched horizontally, then the available horizontal space is split among them. A vertically stretched widget expands to fill the height of the panel.
In a vertical flow panel, a vertically stretched widget expands to fill the space available after all other widgets have taken up their natural heights. If more than one widget is stretched vertically, then the available vertical space is split among them. A horizontally stretched widget expands to fill the width of the panel.
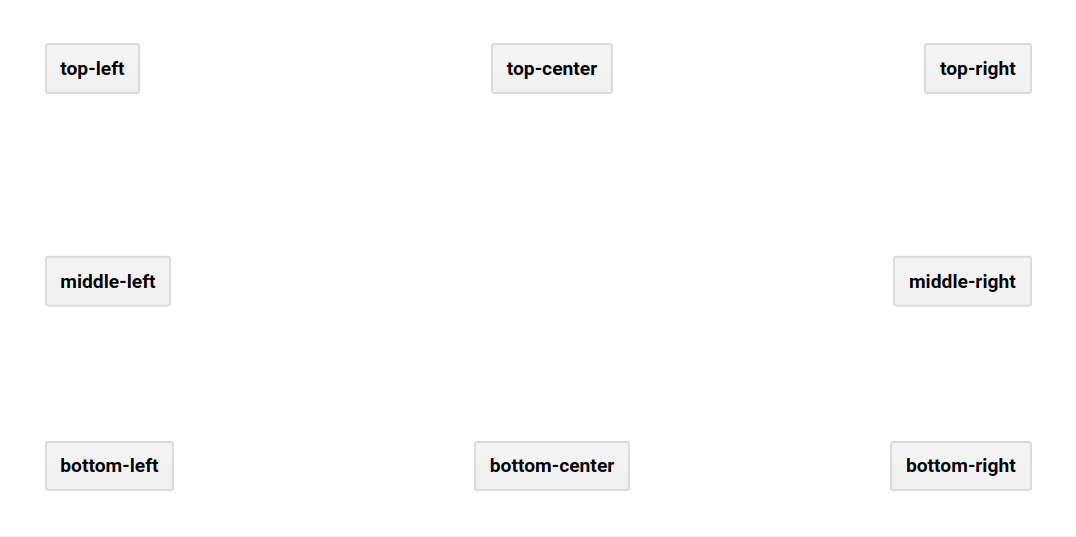
Absolute
An absolute layout positions widgets according to positions in the panel. Unlike the
flow layout, the position of a widget is determined by the position property
of the widget's style property, not the order in which it is added to
the panel. The following example demonstrates using the root.ui panel with
an absolute layout (the root panel's layout is a horizontal flow by default, but can be
set with ui.root.setLayout()):
Code Editor (JavaScript)
ui.root.clear();
ui.root.setLayout(ui.Panel.Layout.absolute());

// A function to make buttons labeled by position.
function makeButton(position) {
  return ui.Button({
    label: position,
    style: {position: position}
  });
}

// Add labeled buttons to the panel.
ui.root.add(makeButton('top-left'));
ui.root.add(makeButton('top-center'));
ui.root.add(makeButton('top-right'));
ui.root.add(makeButton('middle-left'));
ui.root.add(makeButton('middle-right'));
ui.root.add(makeButton('bottom-left'));
ui.root.add(makeButton('bottom-center'));
ui.root.add(makeButton('bottom-right'));
The absolute layout panel should look something like:
widgets()
When you add a widget to a panel, it adds the widget to the panel's list of
widgets. Calling widgets() on the panel returns the
ui.data.ActiveList which you can use to manipulate the widgets in the
panel. Consider the following example, which adds widgets to a panel, adds the panel
to the root panel, then updates a chart when the user clicks on the map:
Code Editor (JavaScript)
// Load and display NDVI data.
var ndvi = ee.ImageCollection('NOAA/VIIRS/001/VNP13A1')
    .filterDate('2021-01-01', '2022-01-01').select('NDVI');
Map.addLayer(
  ndvi.median(), {min: 0, max: 10000, palette: ['99c199', '006400']}, 'NDVI');

// Configure the map.
Map.setCenter(-94.84497, 39.01918, 8);
Map.style().set('cursor', 'crosshair');

// Create an empty panel in which to arrange widgets.
// The layout is vertical flow by default.
var panel = ui.Panel({style: {width: '400px'}})
    .add(ui.Label('Click on the map'));

// Set a callback function for when the user clicks the map.
Map.onClick(function(coords) {
  // Create or update the location label (the second widget in the panel)
  var location = 'lon: ' + coords.lon.toFixed(2) + ' ' +
                 'lat: ' + coords.lat.toFixed(2);
  panel.widgets().set(1, ui.Label(location));

  // Add a red dot to the map where the user clicked.
  var point = ee.Geometry.Point(coords.lon, coords.lat);
  Map.layers().set(1, ui.Map.Layer(point, {color: 'FF0000'}));

  // Create a chart of NDVI over time.
  var chart = ui.Chart.image.series(ndvi, point, ee.Reducer.mean(), 200)
      .setOptions({
        title: 'NDVI Over Time',
        vAxis: {title: 'NDVI'},
        lineWidth: 1,
        pointSize: 3,
      });

  // Add (or replace) the third widget in the panel by
  // manipulating the widgets list.
  panel.widgets().set(2, chart);
});

// Add the panel to the ui.root.
ui.root.add(panel);
In this example, observe that first, widgets are added to panel using
add(). In the callback function registered to map clicks, panel's
list of widgets is modified instead. Specifically, the third widget (which may or may
not exist) is set such that a new chart is displayed of NDVI over time. Learn more about
event handling functions on the Events page.