首先,我們要計算出一個範圍,顯示 Hansen 等人資料中同時出現損失和增益的像素。
Hansen 等人的資料集有兩個波段,其中一個波段的像素值為 1 (表示發生損失),否則為 0 (loss);另一個波段的像素值為 1 (表示發生增益),否則為 0 (gain)。如要建立波段,讓 loss 和 gain 波段中的像素值都為 1,可以在圖片上使用 and() 邏輯方法。and() 方法的呼叫方式類似 image1.and(image2),並會傳回圖片,其中像素為 1 的位置是 image1 和 image2 均為 1 的位置,其他位置則為 0:
程式碼編輯器 (JavaScript)
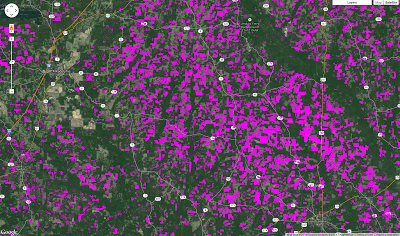
// Load the data and select the bands of interest.
var gfc2014 = ee.Image('UMD/hansen/global_forest_change_2015');
var lossImage = gfc2014.select(['loss']);
var gainImage = gfc2014.select(['gain']);

// Use the and() method to create the lossAndGain image.
var gainAndLoss = gainImage.and(lossImage);

// Show the loss and gain image.
Map.addLayer(gainAndLoss.updateMask(gainAndLoss),
    {palette: 'FF00FF'}, 'Gain and Loss');
結果應如圖 1 所示,顯示衛星檢視模式下的阿肯色州。
將這個範例與上一節的結果合併,現在可以重新建立本教學課程開頭的圖表:
程式碼編輯器 (JavaScript)
// Displaying forest, loss, gain, and pixels where both loss and gain occur.
var gfc2014 = ee.Image('UMD/hansen/global_forest_change_2015');
var lossImage = gfc2014.select(['loss']);
var gainImage = gfc2014.select(['gain']);
var treeCover = gfc2014.select(['treecover2000']);

// Use the and() method to create the lossAndGain image.
var gainAndLoss = gainImage.and(lossImage);

// Add the tree cover layer in green.
Map.addLayer(treeCover.updateMask(treeCover),
    {palette: ['000000', '00FF00'], max: 100}, 'Forest Cover');

// Add the loss layer in red.
Map.addLayer(lossImage.updateMask(lossImage),
    {palette: ['FF0000']}, 'Loss');

// Add the gain layer in blue.
Map.addLayer(gainImage.updateMask(gainImage),
    {palette: ['0000FF']}, 'Gain');

// Show the loss and gain image.
Map.addLayer(gainAndLoss.updateMask(gainAndLoss),
    {palette: 'FF00FF'}, 'Gain and Loss');
量化感興趣區域的森林變化
現在您已進一步瞭解 Hansen 等人資料集中的波段,可以運用目前所學的概念,計算感興趣區域的森林增益和損失統計資料。為此,我們需要使用向量資料 (點、線和多邊形)。向量資料集在 Earth Engine 中會以 FeatureCollection 表示。(進一步瞭解特徵集合和如何匯入向量資料)。
在本節中,我們將比較 2012 年剛果共和國境內的森林損失總量,以及該國保護區在同一時間的森林損失量。
如您在 Earth Engine API 教學課程中所學,計算圖片區域統計資料的主要方法是 reduceRegion()。(進一步瞭解如何減少圖像區域)。舉例來說,假設我們要計算研究期間預估的森林面積損失 (以像素為單位)。為此,請考慮使用下列程式碼:
程式碼編輯器 (JavaScript)
// Load country features from Large Scale International Boundary (LSIB) dataset.
var countries = ee.FeatureCollection('USDOS/LSIB_SIMPLE/2017');

// Subset the Congo Republic feature from countries.
var congo = countries.filter(ee.Filter.eq('country_na', 'Rep of the Congo'));

// Get the forest loss image.
var gfc2014 = ee.Image('UMD/hansen/global_forest_change_2015');
var lossImage = gfc2014.select(['loss']);

// Sum the values of forest loss pixels in the Congo Republic.
var stats = lossImage.reduceRegion({
  reducer: ee.Reducer.sum(),
  geometry: congo,
  scale: 30
});
print(stats);
這個範例使用 ee.Reducer.sum() 縮減器,加總 congo 特徵中 lossImage 內像素的值。由於 lossImage 由值為 1 或 0 的像素組成 (分別代表遺失或未遺失),因此這些值的總和等同於區域中遺失的像素數量。
很遺憾,直接執行指令碼會導致類似以下的錯誤:
預設的像素數量上限為 1,000 萬個。reduceRegion()這則錯誤訊息表示剛果共和國涵蓋約 3.83 億個 Landsat 像素。幸好,reduceRegion() 採用許多參數,其中一個參數 (maxPixels) 可讓您控制計算中使用的像素數量。指定這項參數可讓運算成功:
程式碼編輯器 (JavaScript)
// Load country features from Large Scale International Boundary (LSIB) dataset.
var countries = ee.FeatureCollection('USDOS/LSIB_SIMPLE/2017');

// Subset the Congo Republic feature from countries.
var congo = countries.filter(ee.Filter.eq('country_na', 'Rep of the Congo'));

// Get the forest loss image.
var gfc2014 = ee.Image('UMD/hansen/global_forest_change_2015');
var lossImage = gfc2014.select(['loss']);

// Sum the values of forest loss pixels in the Congo Republic.
var stats = lossImage.reduceRegion({
  reducer: ee.Reducer.sum(),
  geometry: congo,
  scale: 30,
  maxPixels: 1e9
});
print(stats);
展開列印至控制台的物件,觀察結果為 4897933 像素的森林消失。您可以標記輸出內容,並從 reduceRegion() 傳回的字典中取得感興趣的結果,稍微清理控制台中的列印內容:
程式碼編輯器 (JavaScript)
print('pixels representing loss: ', stats.get('loss'));
計算像素區域
您即將回答剛果共和國損失的面積,以及其中有多少位於保護區。剩下的部分是將像素轉換成實際面積。這項轉換非常重要,因為我們不一定知道輸入 reduceRegion() 的像素大小。為協助計算面積,Earth Engine 提供 ee.Image.pixelArea() 方法,可產生圖片,其中每個像素的值都是該像素的面積 (以平方公尺為單位)。將損失圖片與這個區域圖片相乘,然後加總結果,即可取得區域的測量值:
程式碼編輯器 (JavaScript)
// Load country features from Large Scale International Boundary (LSIB) dataset.
var countries = ee.FeatureCollection('USDOS/LSIB_SIMPLE/2017');

// Subset the Congo Republic feature from countries.
var congo = countries.filter(ee.Filter.eq('country_na', 'Rep of the Congo'));

// Get the forest loss image.
var gfc2014 = ee.Image('UMD/hansen/global_forest_change_2015');
var lossImage = gfc2014.select(['loss']);
var areaImage = lossImage.multiply(ee.Image.pixelArea());

// Sum the values of forest loss pixels in the Congo Republic.
var stats = areaImage.reduceRegion({
  reducer: ee.Reducer.sum(),
  geometry: congo,
  scale: 30,
  maxPixels: 1e9
});
print('pixels representing loss: ', stats.get('loss'), 'square meters');
現在的結果是研究期間損失了 4,372,575,052 平方公尺。
現在,您已準備好回答本節開頭的問題:剛果共和國在 2012 年損失了多少森林面積?其中有多少位於保護區?
程式碼編輯器 (JavaScript)
// Load country features from Large Scale International Boundary (LSIB) dataset.
var countries = ee.FeatureCollection('USDOS/LSIB_SIMPLE/2017');

// Subset the Congo Republic feature from countries.
var congo = ee.Feature(
  countries
    .filter(ee.Filter.eq('country_na', 'Rep of the Congo'))
    .first()
);

// Subset protected areas to the bounds of the congo feature
// and other criteria. Clip to the intersection with congo.
var protectedAreas = ee.FeatureCollection('WCMC/WDPA/current/polygons')
  .filter(ee.Filter.and(
    ee.Filter.bounds(congo.geometry()),
    ee.Filter.neq('IUCN_CAT', 'VI'),
    ee.Filter.neq('STATUS', 'proposed'),
    ee.Filter.lt('STATUS_YR', 2010)
  ))
  .map(function(feat){
    return congo.intersection(feat);
  });

// Get the loss image.
var gfc2014 = ee.Image('UMD/hansen/global_forest_change_2015');
var lossIn2012 = gfc2014.select(['lossyear']).eq(12);
var areaImage = lossIn2012.multiply(ee.Image.pixelArea());

// Calculate the area of loss pixels in the Congo Republic.
var stats = areaImage.reduceRegion({
  reducer: ee.Reducer.sum(),
  geometry: congo.geometry(),
  scale: 30,
  maxPixels: 1e9
});
print(
  'Area lost in the Congo Republic:',
  stats.get('lossyear'),
  'square meters'
);

// Calculate the area of loss pixels in the protected areas.
var stats = areaImage.reduceRegion({
  reducer: ee.Reducer.sum(),
  geometry: protectedAreas.geometry(),
  scale: 30,
  maxPixels: 1e9
});
print(
  'Area lost in protected areas:',
  stats.get('lossyear'),
  'square meters'
);
輸出內容指出,2012 年在剛果共和國消失的 348,036,295 平方公尺森林中,有 11,880,976 平方公尺位於保護區,如世界保護區資料庫表格所示。
這個指令碼與前一個指令碼的唯一差異,是新增了受保護區域資訊,以及將指令碼從查看整體損失改為查看 2012 年的損失。這需要進行兩項變更。首先,新的 lossIn2012 圖片會顯示 1 (2012 年有損失) 或 0 (其他情況)。其次,由於樂團名稱不同 (lossyear 而非 loss),因此列印陳述式中的屬性名稱也必須變更。
在下一個部分中,我們會探討一些進階方法,計算並繪製每年森林面積減少的圖表,而不是像本節一樣只計算一年。