Page Summary
-
Earth Engine JavaScript code can be run in the Code Editor using the
ee.Image()constructor to load image data. -
The map can be centered on a specific location using
Map.setCenter()with longitude, latitude, and zoom level. -
Images are displayed on the map using the
Map.addLayer()method. -
Image visualization can be customized by providing visualization parameters (
visParams) toMap.addLayer()to control value stretching and color palettes.
Now that you're ready to begin writing Earth Engine JavaScript, start by copying the following code into the Code Editor:
Code Editor (JavaScript)
// Instantiate an image with the Image constructor.
var image = ee.Image('CGIAR/SRTM90_V4');

// Zoom to a location.
Map.setCenter(-112.8598, 36.2841, 9); // Center on the Grand Canyon.

// Display the image on the map.
Map.addLayer(image);
Click the Run button at the top of the Code Editor and observe that a very gray image appears on the map. Don't worry, you'll make it look better soon. If the syntax of any part of this example in unfamiliar, be sure to review the JavaScript for Earth Engine tutorial.
Image Constructor
The first new thing in this example is the image constructor
ee.Image(). The argument provided to the constructor is the string ID of an
image in the Earth Engine data catalog. (See the Docs tab, at the left
of the Code Editor, to see a full list of possible arguments to the image constructor. The
Docs tab represents the most up to date information about what Earth Engine
can do.)
To discover an image ID, search in the Earth Engine data catalog using the search tool at the top of the Code Editor. For example, type 'elevation' into the search field and note that a list of rasters is returned. Click the 'SRTM Digital Elevation Data Version 4' entry to see more information about that dataset. On the right side of the dataset description is an Image ID field. Observe that the image ID in the example is copied from the image ID shown in the dataset description.
An alternative to copying and pasting image IDs is to use the Import button on the dataset description or the import link at the right side of the search results. If you click the import link or button, a variable is automatically created in a special section, named 'Imports', at the top of your script. You can rename the variable by clicking on its name in the imports section.
Configuring the Map
The second new part of this example is the Map.setCenter() call. This
method on the Map object, which represents the Map display in the Code
Editor, centers the map at the given longitude, latitude (in decimal degrees) and
zoom
level where 1 is zoomed out so that the map shows the entire Earth's surface. Larger
numbers zoom in from there. Discover all the methods on the Map object by
checking the Map section in the Docs tab
on the left side of the Code Editor.
Adding a layer to the Map
The last line in the example says: use the Mapobject's addLayer()
method to add an image to the map display in the Code Editor.
Congratulations! You've created your first Earth Engine script. In the next section, you'll learn how to make that image look a little better.
Digression: Images in Earth Engine
Images in Earth Engine (see this page for more details) are made up of one or more bands. Each band in an image has its own name, pixel values, pixel resolution, and projection. As you'll soon discover, the SRTM image has one band: 'elevation'.
When you add an image to a map using Map.addLayer(), Earth Engine needs to
determine how to map the values in the image band(s) to colors on the display. If a
single-band image is added to a map, by default Earth Engine displays the band in grayscale,
where the minimum value is assigned to black, and the maximum value is assigned to white.
If you don't specify what the minimum and maximum should be, Earth Engine will use
default values. For example, the image you just added to the map is displayed as a
grayscale image stretched to the full range of the data, or signed 16-bit integer
[-32768, 32767]. (float bands are stretched to [0, 1] and byte
bands are stretched to [0, 255] by default).
You can discover the data type of the image by printing it and inspecting the image object in the Console tab. For example, paste the following after the previous code:
Code Editor (JavaScript)
print('SRTM image', image);
When you click run, note that an object appears in the console. To investigate the object
properties, expand it by clicking on the zippy
( ) to the left of the
object or property. Expand the image object, the 'bands' property, the 'elevation' band
at index '0' and the 'data_type' property of the 'elevation' band to discover that it is a
) to the left of the
object or property. Expand the image object, the 'bands' property, the 'elevation' band
at index '0' and the 'data_type' property of the 'elevation' band to discover that it is a
signed int16 data type.
Customizing layer visualization
To change the way the data are stretched, you can provide another parameter to the
Map.addLayer() call. Specifically, the second parameter,
visParams, lets you specify the minimum and maximum values to display. To
discover what values to use, activate the
Inspector tab and click around on
the map to get an idea of the range of pixel values. Alternatively, use the
Layer manager to interactively stretch the data,
then observe the minimum and maximum corresponding to percentiles or standard deviation
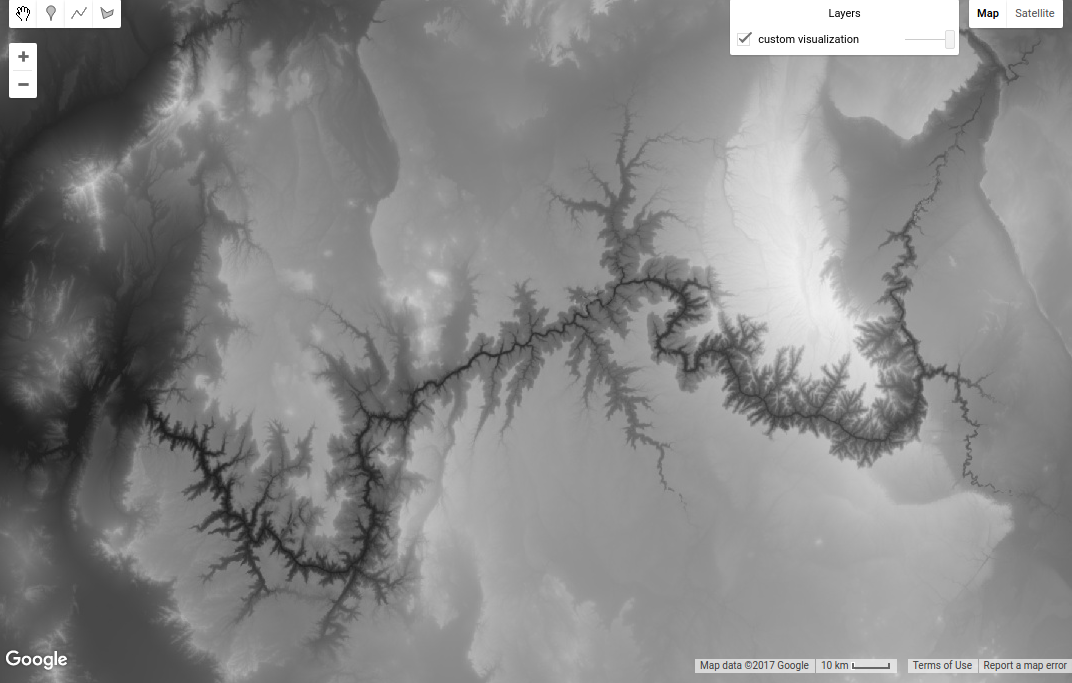
stretches. Suppose that through such experimentation, you determine that the data
should be stretched to [0, 3000]. To display the image using this range, use:
Code Editor (JavaScript)
Map.addLayer(image, {min: 0, max: 3000}, 'custom visualization');
Note that the visParams parameter is an object, with properties specifying
the min and the max. (Learn more about JavaScript objects from
the JavaScript tutorial or
this
external reference). Note that the third parameter for Map.addLayer()
is the name of the layer that is displayed in the Layer
manager. The result should look something like Figure 1. Hover the mouse over the
Layers box on the right to see the effect of renaming that layer.
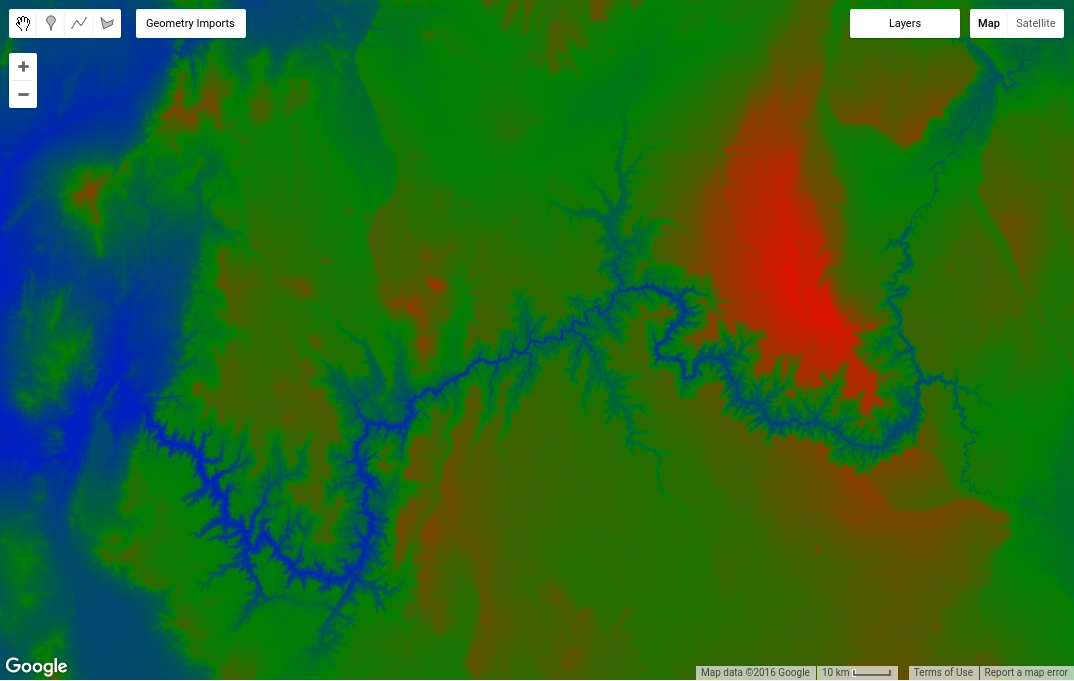
To display a single band using a color palette, add a palette property
to the visParams object:
Code Editor (JavaScript)
Map.addLayer(image, {min: 0, max: 3000, palette: ['blue', 'green', 'red']},
    'custom palette');
The result should look something like Figure 2.
Digression: Palettes
Palettes let you set the color scheme for single-band images. A palette is a comma delimited list of color strings which are linearly interpolated between the maximum and minimum values in the visualization parameters (or defaults according to the band type, as described previously). For example, pixels less than or equal to the minimum will be displayed with the first color in the list; pixels greater than or equal to the maximum will be displayed with the last color in the list. Intermediate colors are linearly stretched to intermediate pixel values.
The colors are defined using the web standard CSS color value scheme (see this external reference to learn more). Colors can be specified by name or as hexadecimal strings indicating the combination of red, green and blue. The lowest value in any of the three positions is 00 (representing the decimal number 0), while the highest is FF (representing the decimal number 255). The string '000000' represents the color black, 'FFFFFF' is white, 'FF0000' is red, '00FF00' is green, and '0000FF' is blue. See the Color palettes section for more detail. Other stretches are possible by using Styled Layer Descriptors, as described in this section.
Later in this tutorial, you'll learn how to display multi-band imagery. But first, visit the next page to learn about performing computations with images.