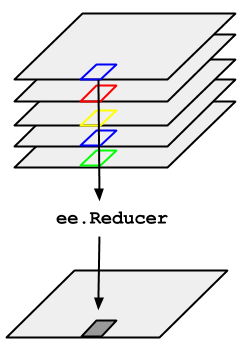
舉例來說,您需要針對 ImageCollection 所代表的圖片時間序列計算中位數。如要減少 ImageCollection,請使用 imageCollection.reduce()。這樣一來,圖片集合就會縮減為單一圖片,如圖 1 所示。具體來說,系統會逐像素計算輸出內容,也就是說,輸出內容中的每個像素都由該位置集合中所有圖片的中位數值組成。如要取得其他統計資料 (例如平均值、加總、變異數、任意百分位數等),請選取並套用適當的縮減器。(如要查看目前所有可用的縮減器清單,請參閱 程式碼編輯器中的「Docs」分頁標籤)。如要取得最小值、最大值、平均值等基本統計資料,ImageCollection 有 min()、max()、mean() 等快速鍵方法,這些方法的運作方式與呼叫 reduce() 完全相同,只是產生的頻道名稱不會附加縮減器名稱。
舉例來說,假設您想減少 ImageCollection,可以考慮使用以路徑和列篩選的 Landsat 5 圖像集合。下列程式碼使用 reduce() 將集合縮減為一個 Image (為了說明方便,這裡使用了中位數縮減器):
程式碼編輯器 (JavaScript)
// Load an image collection, filtered so it's not too much data.
var collection = ee.ImageCollection('LANDSAT/LT05/C02/T1')
  .filterDate('2008-01-01', '2008-12-31')
  .filter(ee.Filter.eq('WRS_PATH', 44))
  .filter(ee.Filter.eq('WRS_ROW', 34));

// Compute the median in each band, each pixel.
// Band names are B1_median, B2_median, etc.
var median = collection.reduce(ee.Reducer.median());

// The output is an Image.  Add it to the map.
var vis_param = {bands: ['B4_median', 'B3_median', 'B2_median'], gamma: 1.6};
Map.setCenter(-122.3355, 37.7924, 9);
Map.addLayer(median, vis_param);
import ee
import geemap.core as geemap
Colab (Python)
# Load an image collection, filtered so it's not too much data.
collection = (
    ee.ImageCollection('LANDSAT/LT05/C02/T1')
    .filterDate('2008-01-01', '2008-12-31')
    .filter(ee.Filter.eq('WRS_PATH', 44))
    .filter(ee.Filter.eq('WRS_ROW', 34))
)

# Compute the median in each band, each pixel.
# Band names are B1_median, B2_median, etc.
median = collection.reduce(ee.Reducer.median())

# The output is an Image.  Add it to the map.
vis_param = {'bands': ['B4_median', 'B3_median', 'B2_median'], 'gamma': 1.6}
m = geemap.Map()
m.set_center(-122.3355, 37.7924, 9)
m.add_layer(median, vis_param)
m
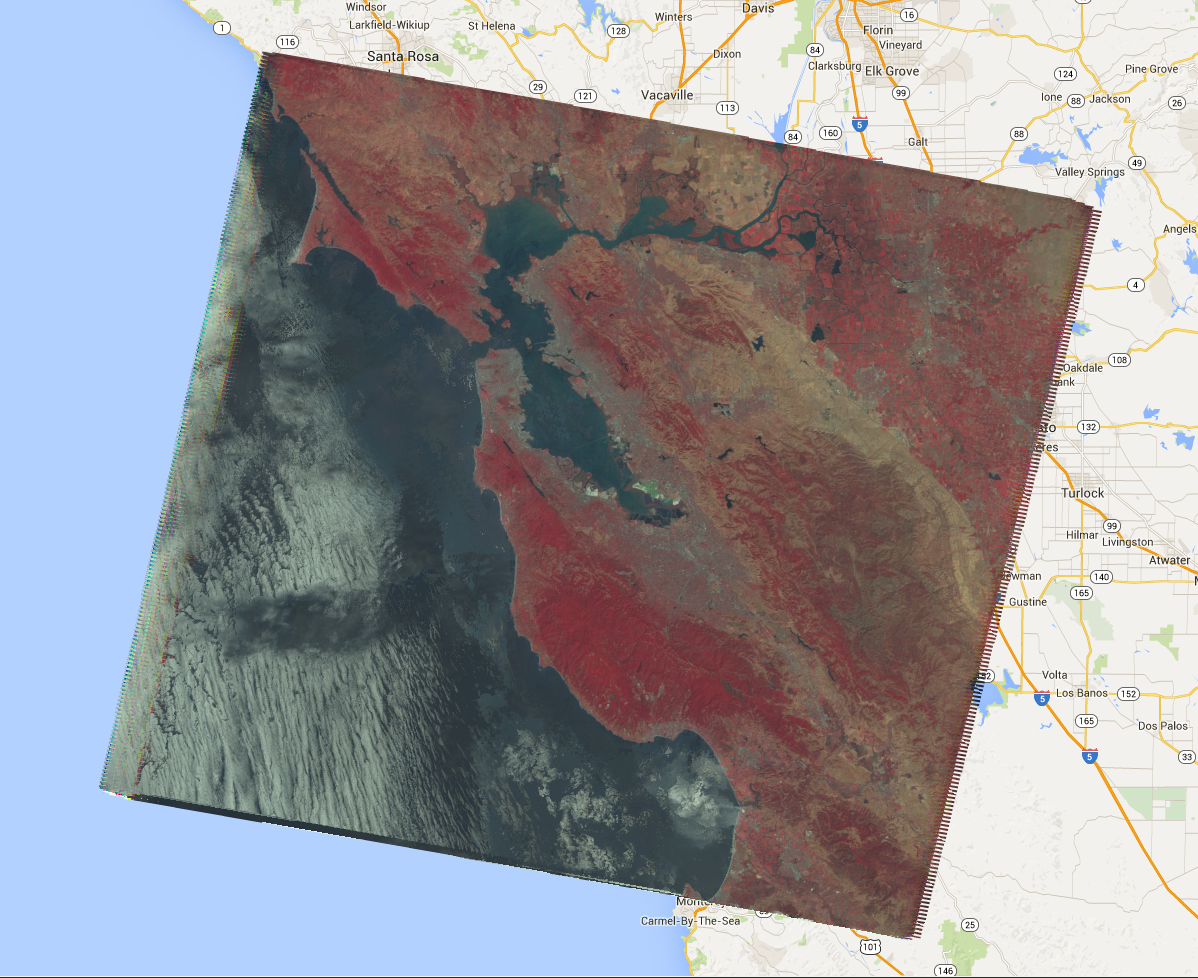
這會傳回多頻帶 Image,其中每個像素都是該像素位置 ImageCollection 中所有未遮罩像素的中位數。具體來說,系統會針對輸入影像的每個頻帶重複執行縮減器,也就是說,系統會在每個頻帶中獨立計算中位數。請注意,頻帶名稱會加上縮減器名稱:'B1_median'、'B2_median' 等。輸出內容應類似圖 2 所示。
如要進一步瞭解如何縮減圖片集,請參閱 ImageCollection 說明文件中的「縮減」一節。特別注意,透過縮減 ImageCollection 產生的圖片沒有投影。也就是說,您應明確設定涉及計算圖像輸出的任何運算,並透過 ImageCollection 減少。