 前往 GitHub 查看來源
ee.Image 物件具有一組關聯、條件和布林方法,可用於建構決策運算式。這些方法的結果可用於透過遮罩、開發分類地圖和重新指派值,將分析範圍限制在特定像素或區域。
關係和布林運算子
關聯方法包括:
eq()、gt()、gte()、lt() 和 lte()
布林值方法包括:
程式碼編輯器 (JavaScript)
and()、or() 和 not()
Colab (Python)
And()、Or() 和 Not()
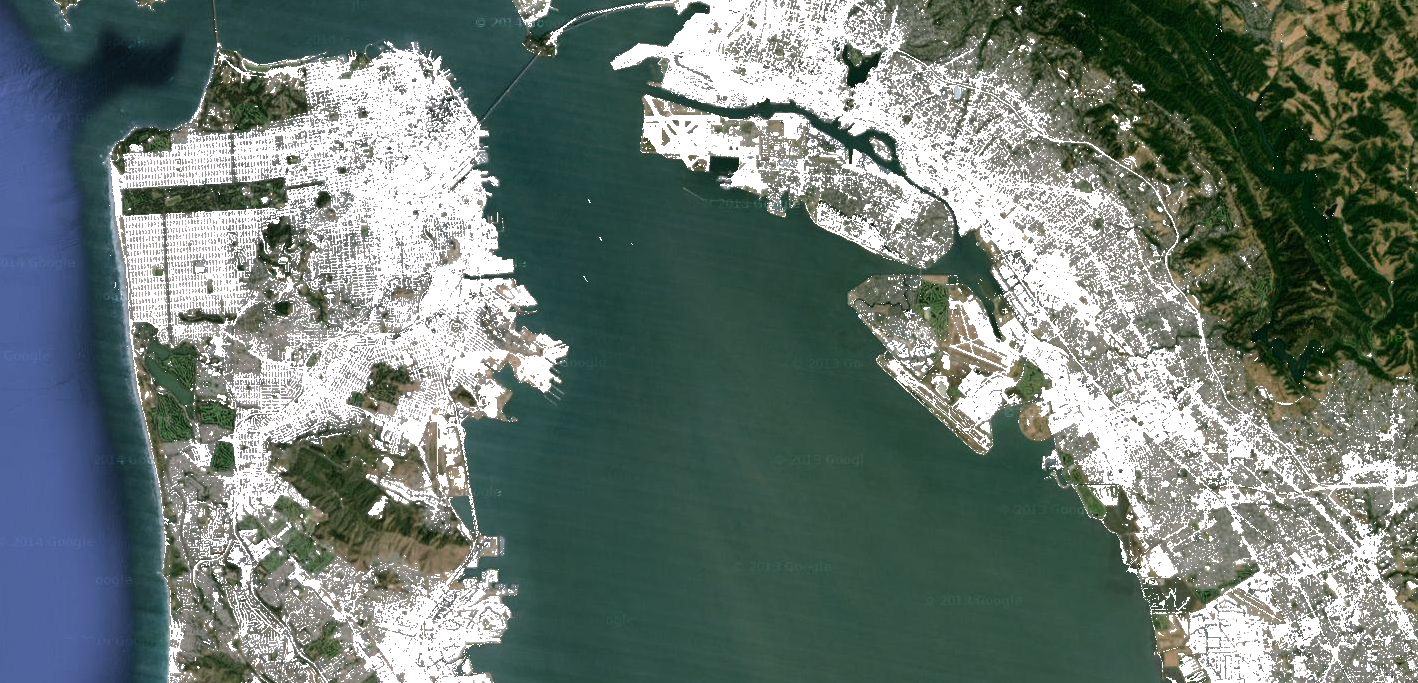
如要比較圖像的每個像素,請使用關係運算子。為了擷取圖片中的都市化區域,本範例使用關係運算子來設定光譜指數的閾值,並將閾值與 and 運算子結合:
程式碼編輯器 (JavaScript)
// Load a Landsat 8 image.
var image = ee.Image('LANDSAT/LC08/C02/T1_TOA/LC08_044034_20140318');

// Create NDVI and NDWI spectral indices.
var ndvi = image.normalizedDifference(['B5', 'B4']);
var ndwi = image.normalizedDifference(['B3', 'B5']);

// Create a binary layer using logical operations.
var bare = ndvi.lt(0.2).and(ndwi.lt(0));

// Mask and display the binary layer.
Map.setCenter(-122.3578, 37.7726, 12);
Map.setOptions('satellite');
Map.addLayer(bare.selfMask(), {}, 'bare');
import ee
import geemap.core as geemap
Colab (Python)
# Load a Landsat 8 image.
image = ee.Image('LANDSAT/LC08/C02/T1_TOA/LC08_044034_20140318')

# Create NDVI and NDWI spectral indices.
ndvi = image.normalizedDifference(['B5', 'B4'])
ndwi = image.normalizedDifference(['B3', 'B5'])

# Create a binary layer using logical operations.
bare = ndvi.lt(0.2).And(ndwi.lt(0))

# Define a map centered on San Francisco Bay.
map_bare = geemap.Map(center=[37.7726, -122.3578], zoom=12)

# Add the masked image layer to the map and display it.
map_bare.add_layer(bare.selfMask(), None, 'bare')
display(map_bare)
如這個範例所示,關係運算子和布林運算子的輸出值為 true (1) 或 false (0)。如要遮蓋 0,您可以使用 selfMask() 將產生的二進位圖片遮蓋住。
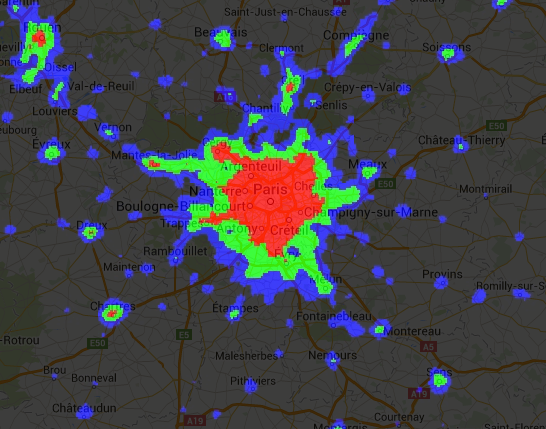
關係運算子和布林運算子傳回的二進位圖片可搭配數學運算子使用。本範例會使用關聯運算子和 add(),在夜間燈光圖像中建立都市化區域:
程式碼編輯器 (JavaScript)
// Load a 2012 nightlights image.
var nl2012 = ee.Image('NOAA/DMSP-OLS/NIGHTTIME_LIGHTS/F182012');
var lights = nl2012.select('stable_lights');

// Define arbitrary thresholds on the 6-bit stable lights band.
var zones = lights.gt(30).add(lights.gt(55)).add(lights.gt(62));

// Display the thresholded image as three distinct zones near Paris.
var palette = ['000000', '0000FF', '00FF00', 'FF0000'];
Map.setCenter(2.373, 48.8683, 8);
Map.addLayer(zones, {min: 0, max: 3, palette: palette}, 'development zones');
import ee
import geemap.core as geemap
Colab (Python)
# Load a 2012 nightlights image.
nl_2012 = ee.Image('NOAA/DMSP-OLS/NIGHTTIME_LIGHTS/F182012')
lights = nl_2012.select('stable_lights')

# Define arbitrary thresholds on the 6-bit stable lights band.
zones = lights.gt(30).add(lights.gt(55)).add(lights.gt(62))

# Define a map centered on Paris, France.
map_zones = geemap.Map(center=[48.8683, 2.373], zoom=8)

# Display the thresholded image as three distinct zones near Paris.
palette = ['000000', '0000FF', '00FF00', 'FF0000']
map_zones.add_layer(
    zones, {'min': 0, 'max': 3, 'palette': palette}, 'development zones'
)
display(map_zones)
條件運算子
請注意,前述範例中的程式碼等同於使用 expression() 實作的三元運算子:
程式碼編輯器 (JavaScript)
// Create zones using an expression, display.
var zonesExp = nl2012.expression(
    "(b('stable_lights') > 62) ? 3" +
      ": (b('stable_lights') > 55) ? 2" +
        ": (b('stable_lights') > 30) ? 1" +
          ": 0"
);
Map.addLayer(zonesExp,
             {min: 0, max: 3, palette: palette},
             'development zones (ternary)');
import ee
import geemap.core as geemap
Colab (Python)
# Create zones using an expression, display.
zones_exp = nl_2012.expression(
    "(b('stable_lights') > 62) ? 3 "
    ": (b('stable_lights') > 55) ? 2 "
    ": (b('stable_lights') > 30) ? 1 "
    ': 0'
)

# Define a map centered on Paris, France.
map_zones_exp = geemap.Map(center=[48.8683, 2.373], zoom=8)

# Add the image layer to the map and display it.
map_zones_exp.add_layer(
    zones_exp, {'min': 0, 'max': 3, 'palette': palette}, 'zones exp'
)
display(map_zones_exp)
請注意,在先前的運算式範例中,系統使用 b() 函式參照感興趣的頻帶,而不是變數名稱字典。如要進一步瞭解圖片表情符號,請參閱這個頁面。使用數學運算子或運算式都會產生相同的結果。
另一種在圖片上執行條件式作業的方式,是使用 where() 運算子。請考量是否需要以其他資料取代遮罩的像素。在以下範例中,使用 where() 將雲層像素取代為無雲圖像的像素:
程式碼編輯器 (JavaScript)
// Load a cloudy Sentinel-2 image.
var image = ee.Image(
  'COPERNICUS/S2_SR/20210114T185729_20210114T185730_T10SEG');
Map.addLayer(image,
             {bands: ['B4', 'B3', 'B2'], min: 0, max: 2000},
             'original image');

// Load another image to replace the cloudy pixels.
var replacement = ee.Image(
  'COPERNICUS/S2_SR/20210109T185751_20210109T185931_T10SEG');

// Set cloudy pixels (greater than 5% probability) to the other image.
var replaced = image.where(image.select('MSK_CLDPRB').gt(5), replacement);

// Display the result.
Map.setCenter(-122.3769, 37.7349, 11);
Map.addLayer(replaced,
             {bands: ['B4', 'B3', 'B2'], min: 0, max: 2000},
             'clouds replaced');
import ee
import geemap.core as geemap
Colab (Python)
# Load a cloudy Sentinel-2 image.
image = ee.Image('COPERNICUS/S2_SR/20210114T185729_20210114T185730_T10SEG')

# Load another image to replace the cloudy pixels.
replacement = ee.Image(
    'COPERNICUS/S2_SR/20210109T185751_20210109T185931_T10SEG'
)

# Set cloudy pixels (greater than 5% probability) to the other image.
replaced = image.where(image.select('MSK_CLDPRB').gt(5), replacement)

# Define a map centered on San Francisco Bay.
map_replaced = geemap.Map(center=[37.7349, -122.3769], zoom=11)

# Display the images on a map.
vis_params = {'bands': ['B4', 'B3', 'B2'], 'min': 0, 'max': 2000}
map_replaced.add_layer(image, vis_params, 'original image')
map_replaced.add_layer(replaced, vis_params, 'clouds replaced')
display(map_replaced)