 GitHub에서 소스 보기
이미지 객체는 동일한 정수 값을 갖는 연결된 픽셀의 집합입니다. 카테고리, 비닝된, 불리언 이미지 데이터는 객체 분석에 적합합니다.
Earth Engine은 각 객체에 고유한 ID를 지정하고, 객체를 구성하는 픽셀 수를 집계하고, 객체와 교차하는 픽셀 값의 통계를 계산하는 메서드를 제공합니다.
connectedComponents(): 각 객체에 고유한 식별자로 라벨을 지정합니다.connectedPixelCount(): 각 객체의 픽셀 수를 계산합니다.reduceConnectedComponents(): 각 객체의 픽셀에 대한 통계를 계산합니다.
열 핫스팟
다음 섹션에서는 Landsat 8 지표면 온도에 적용된 객체 기반 메서드의 예를 제공하며 각 섹션은 이전 섹션을 기반으로 합니다. 다음 스니펫을 실행하여 샌프란시스코의 작은 지역의 열 핫스팟(303K 이상)에 관한 기본 이미지를 생성합니다.
코드 편집기 (JavaScript)
// Make an area of interest geometry centered on San Francisco.
var point = ee.Geometry.Point(-122.1899, 37.5010);
var aoi = point.buffer(10000);

// Import a Landsat 8 image, subset the thermal band, and clip to the
// area of interest.
var kelvin = ee.Image('LANDSAT/LC08/C02/T1_TOA/LC08_044034_20140318')
  .select(['B10'], ['kelvin'])
  .clip(aoi);

// Display the thermal band.
Map.centerObject(point, 13);
Map.addLayer(kelvin, {min: 288, max: 305}, 'Kelvin');

// Threshold the thermal band to set hot pixels as value 1, mask all else.
var hotspots = kelvin.gt(303)
  .selfMask()
  .rename('hotspots');

// Display the thermal hotspots on the Map.
Map.addLayer(hotspots, {palette: 'FF0000'}, 'Hotspots');
import ee
import geemap.core as geemap
Colab (Python)
# Make an area of interest geometry centered on San Francisco.
point = ee.Geometry.Point(-122.1899, 37.5010)
aoi = point.buffer(10000)

# Import a Landsat 8 image, subset the thermal band, and clip to the
# area of interest.
kelvin = (
    ee.Image('LANDSAT/LC08/C02/T1_TOA/LC08_044034_20140318')
    .select(['B10'], ['kelvin'])
    .clip(aoi)
)

# Threshold the thermal band to set hot pixels as value 1, mask all else.
hotspots = kelvin.gt(303).selfMask().rename('hotspots')

# Define a map centered on Redwood City, California.
map_objects = geemap.Map(center=[37.5010, -122.1899], zoom=13)

# Add the image layers to the map.
map_objects.add_layer(kelvin, {'min': 288, 'max': 305}, 'Kelvin')
map_objects.add_layer(hotspots, {'palette': 'FF0000'}, 'Hotspots')
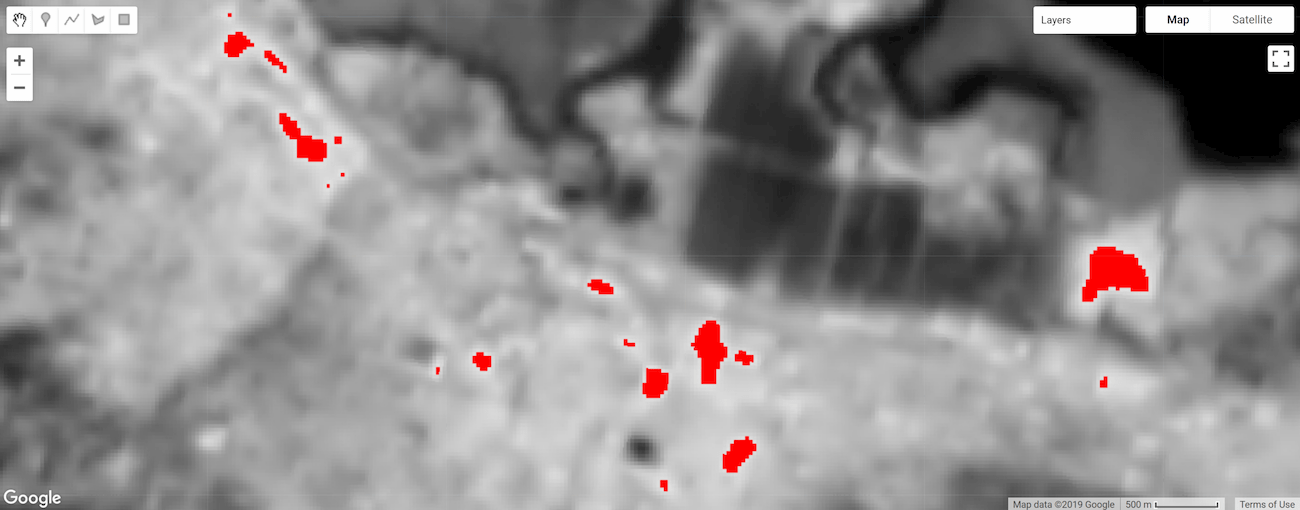
그림 1. 샌프란시스코 지역의 기온입니다. 온도가 303켈빈을 초과하는 픽셀은 빨간색 (열 핫스팟)으로 구분됩니다.
객체 라벨
객체 라벨링은 객체 분석의 첫 번째 단계인 경우가 많습니다. 여기서 connectedComponents() 함수는 이미지 객체를 식별하고 각각에 고유한 ID를 할당하는 데 사용됩니다. 객체에 속한 모든 픽셀에는 동일한 정수 ID 값이 할당됩니다. 결과는 이미지의 첫 번째 밴드에 있는 픽셀의 연결성을 기반으로 픽셀을 객체 ID 값과 연결하는 추가 '라벨' 밴드가 있는 입력 이미지의 사본입니다.
코드 편집기 (JavaScript)
// Uniquely label the hotspot image objects.
var objectId = hotspots.connectedComponents({
  connectedness: ee.Kernel.plus(1),
  maxSize: 128
});

// Display the uniquely ID'ed objects to the Map.
Map.addLayer(objectId.randomVisualizer(), null, 'Objects');
import ee
import geemap.core as geemap
Colab (Python)
# Uniquely label the hotspot image objects.
object_id = hotspots.connectedComponents(
    connectedness=ee.Kernel.plus(1), maxSize=128
)

# Add the uniquely ID'ed objects to the map.
map_objects.add_layer(object_id.randomVisualizer(), None, 'Objects')
최대 패치 크기는 128픽셀로 설정됩니다. 픽셀로 구성된 객체는 마스킹됩니다. 연결은 4개 인접 노드 연결을 정의하는 ee.Kernel.plus(1) 커널로 지정됩니다. 8개 인접 노드의 경우 ee.Kernel.square(1)을 사용하세요.
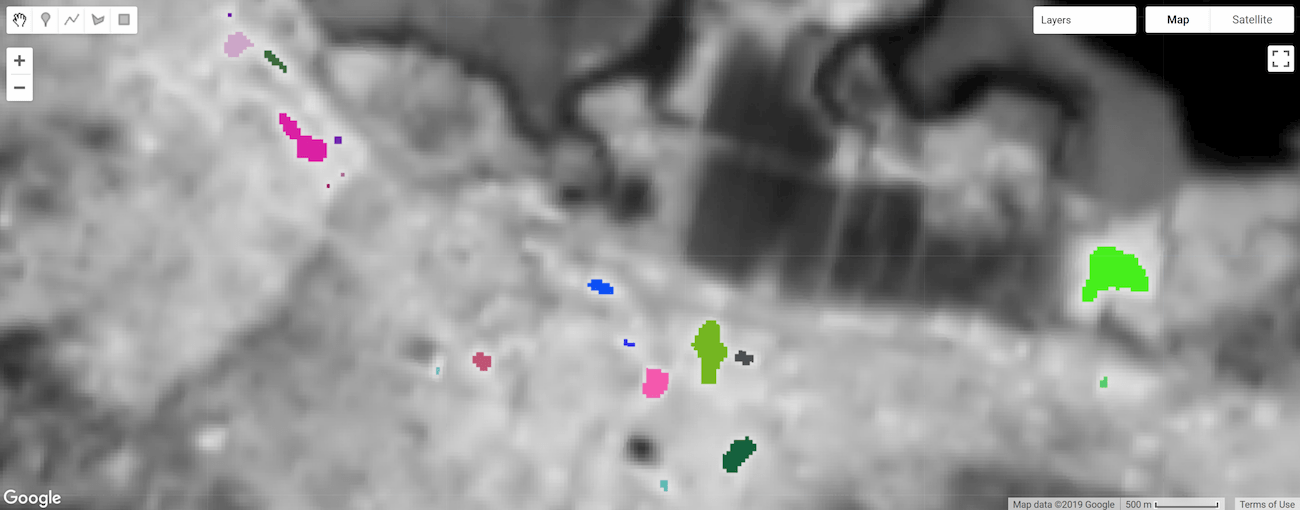
그림 2 고유 ID로 라벨이 지정되고 스타일이 지정된 열 핫스팟 객체입니다.
객체 크기
픽셀 수
connectedPixelCount() 이미지 메서드를 사용하여 객체를 구성하는 픽셀 수를 계산합니다. 객체의 픽셀 수를 알면 크기별로 객체를 마스킹하고 객체 영역을 계산하는 데 도움이 될 수 있습니다. 다음 스니펫은 이전 섹션에 정의된 objectId 이미지의 '라벨' 밴드에 connectedPixelCount()를 적용합니다.
코드 편집기 (JavaScript)
// Compute the number of pixels in each object defined by the "labels" band.
var objectSize = objectId.select('labels')
  .connectedPixelCount({
    maxSize: 128, eightConnected: false
  });

// Display object pixel count to the Map.
Map.addLayer(objectSize, null, 'Object n pixels');
import ee
import geemap.core as geemap
Colab (Python)
# Compute the number of pixels in each object defined by the "labels" band.
object_size = object_id.select('labels').connectedPixelCount(
    maxSize=128, eightConnected=False
)

# Add the object pixel count to the map.
map_objects.add_layer(object_size, None, 'Object n pixels')
connectedPixelCount()는 각 밴드의 각 픽셀에 eightConnected 매개변수에 전달된 불리언 인수에 의해 결정된 4개 또는 8개 인접 연결 규칙에 따라 연결된 인접 픽셀 수를 포함하는 입력 이미지의 사본을 반환합니다. 연결성은 입력 이미지의 각 밴드에 대해 독립적으로 결정됩니다. 이 예에서는 객체 ID를 나타내는 단일 밴드 이미지 (objectId)가 입력으로 제공되었으므로 단일 밴드 이미지가 '라벨' 밴드(입력 이미지에 라벨로 표시됨)와 함께 반환되었지만 이제 값은 객체를 구성하는 픽셀 수를 나타냅니다. 각 객체의 모든 픽셀은 동일한 픽셀 수 값을 갖습니다.
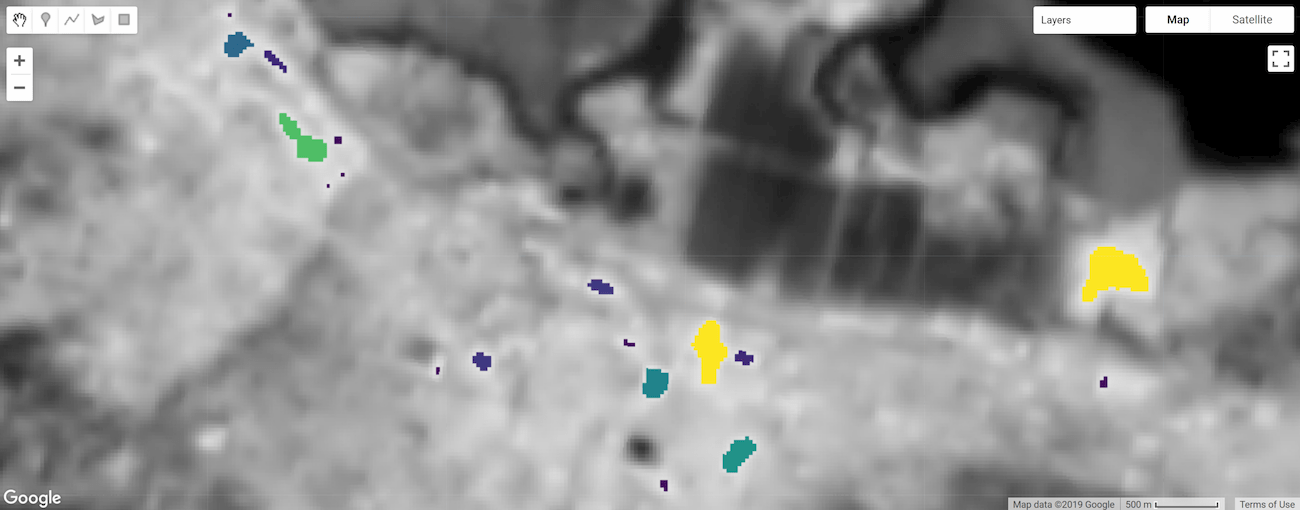
그림 3 크기별로 라벨이 지정되고 스타일이 지정된 열 핫스팟 객체
지역
단일 픽셀의 면적에 객체를 구성하는 픽셀 수 (connectedPixelCount()로 결정됨)를 곱하여 객체 영역을 계산합니다. 픽셀 영역은 ee.Image.pixelArea()에서 생성된 이미지에서 제공됩니다.
코드 편집기 (JavaScript)
// Get a pixel area image.
var pixelArea = ee.Image.pixelArea();

// Multiply pixel area by the number of pixels in an object to calculate
// the object area. The result is an image where each pixel
// of an object relates the area of the object in m^2.
var objectArea = objectSize.multiply(pixelArea);

// Display object area to the Map.
Map.addLayer(objectArea,
             {min: 0, max: 30000, palette: ['0000FF', 'FF00FF']},
             'Object area m^2');
import ee
import geemap.core as geemap
Colab (Python)
# Get a pixel area image.
pixel_area = ee.Image.pixelArea()

# Multiply pixel area by the number of pixels in an object to calculate
# the object area. The result is an image where each pixel
# of an object relates the area of the object in m^2.
object_area = object_size.multiply(pixel_area)

# Add the object area to the map.
map_objects.add_layer(
    object_area,
    {'min': 0, 'max': 30000, 'palette': ['0000FF', 'FF00FF']},
    'Object area m^2',
)
그 결과 객체의 각 픽셀이 객체의 면적(m2)과 관련된 이미지가 만들어집니다. 이 예에서 objectSize 이미지에는 단일 밴드가 포함되어 있습니다. 멀티 밴드인 경우 곱셈 연산이 이미지의 각 밴드에 적용됩니다.
크기별 객체 필터링
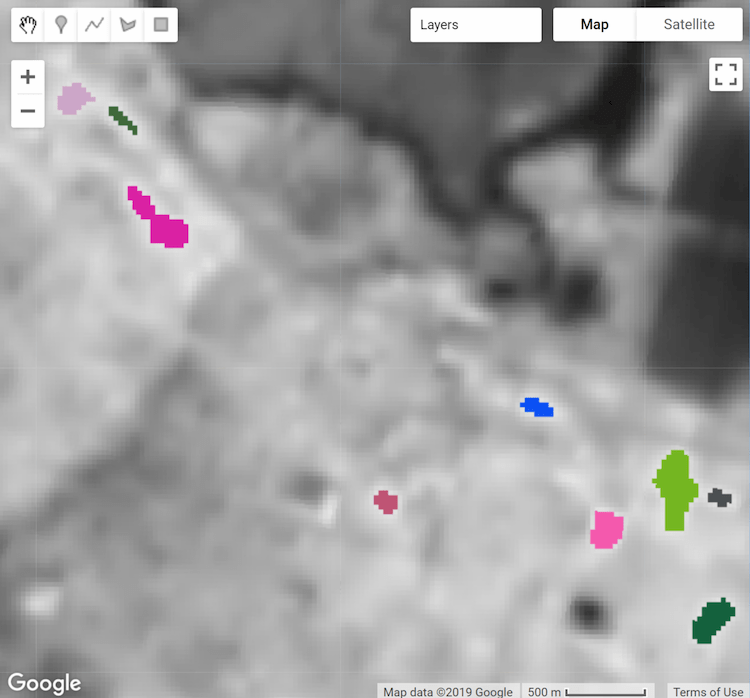
객체 크기는 특정 크기의 객체에 분석을 집중하기 위한 마스크 조건으로 사용할 수 있습니다 (예: 너무 작은 객체를 마스크 처리). 여기서 이전 단계에서 계산된 objectArea 이미지는 면적이 1헥타르 미만인 객체를 삭제하기 위한 마스크로 사용됩니다.
코드 편집기 (JavaScript)
// Threshold the `objectArea` image to define a mask that will mask out
// objects below a given size (1 hectare in this case).
var areaMask = objectArea.gte(10000);

// Update the mask of the `objectId` layer defined previously using the
// minimum area mask just defined.
objectId = objectId.updateMask(areaMask);
Map.addLayer(objectId, null, 'Large hotspots');
import ee
import geemap.core as geemap
Colab (Python)
# Threshold the `object_area` image to define a mask that will mask out
# objects below a given size (1 hectare in this case).
area_mask = object_area.gte(10000)

# Update the mask of the `object_id` layer defined previously using the
# minimum area mask just defined.
object_id = object_id.updateMask(area_mask)
map_objects.add_layer(object_id, None, 'Large hotspots')
결과는 1헥타르 미만의 객체가 마스크 처리된 objectId 이미지의 사본입니다.
 |
 |
|---|---|
| 그림 4a. 고유 ID로 라벨이 지정되고 스타일이 지정된 열 핫스팟 객체입니다. | 그림 4b. 최소 면적 (1헥타르)으로 필터링된 열 핫스팟 객체 |
영역별 통계
reduceConnectedComponents() 메서드는 고유한 객체를 구성하는 픽셀에 리듀서를 적용합니다. 다음 스니펫에서는 이를 사용하여 핫스팟 객체의 평균 온도를 계산합니다. reduceConnectedComponents()에는 줄일 밴드가 있는 입력 이미지와 객체 라벨을 정의하는 밴드가 필요합니다. 여기에서는 objectID '라벨' 이미지 밴드를 kelvin 온도 이미지에 추가하여 적절한 입력 이미지를 구성합니다.
코드 편집기 (JavaScript)
// Make a suitable image for `reduceConnectedComponents()` by adding a label
// band to the `kelvin` temperature image.
kelvin = kelvin.addBands(objectId.select('labels'));

// Calculate the mean temperature per object defined by the previously added
// "labels" band.
var patchTemp = kelvin.reduceConnectedComponents({
  reducer: ee.Reducer.mean(),
  labelBand: 'labels'
});

// Display object mean temperature to the Map.
Map.addLayer(
  patchTemp,
  {min: 303, max: 304, palette: ['yellow', 'red']},
  'Mean temperature'
);
import ee
import geemap.core as geemap
Colab (Python)
# Make a suitable image for `reduceConnectedComponents()` by adding a label
# band to the `kelvin` temperature image.
kelvin = kelvin.addBands(object_id.select('labels'))

# Calculate the mean temperature per object defined by the previously added
# "labels" band.
patch_temp = kelvin.reduceConnectedComponents(
    reducer=ee.Reducer.mean(), labelBand='labels'
)

# Add object mean temperature to the map and display it.
map_objects.add_layer(
    patch_temp,
    {'min': 303, 'max': 304, 'palette': ['yellow', 'red']},
    'Mean temperature',
)
display(map_objects)
결과는 객체를 정의하는 데 사용된 밴드가 없는 입력 이미지의 사본이며, 여기서 픽셀 값은 밴드별 객체당 감소 결과를 나타냅니다.
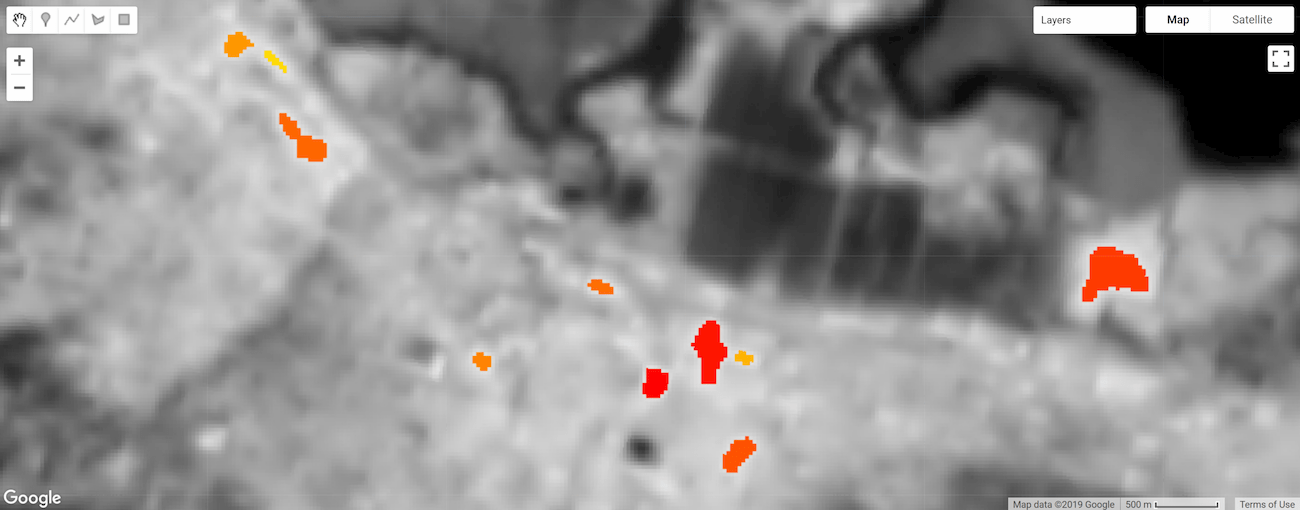
그림 5. 평균 온도별로 요약되고 스타일이 지정된 열 핫스팟 객체 픽셀입니다.