您可以在代碼管理工具中預覽伺服器端容器並進行偵錯。
瞭解預覽版面配置
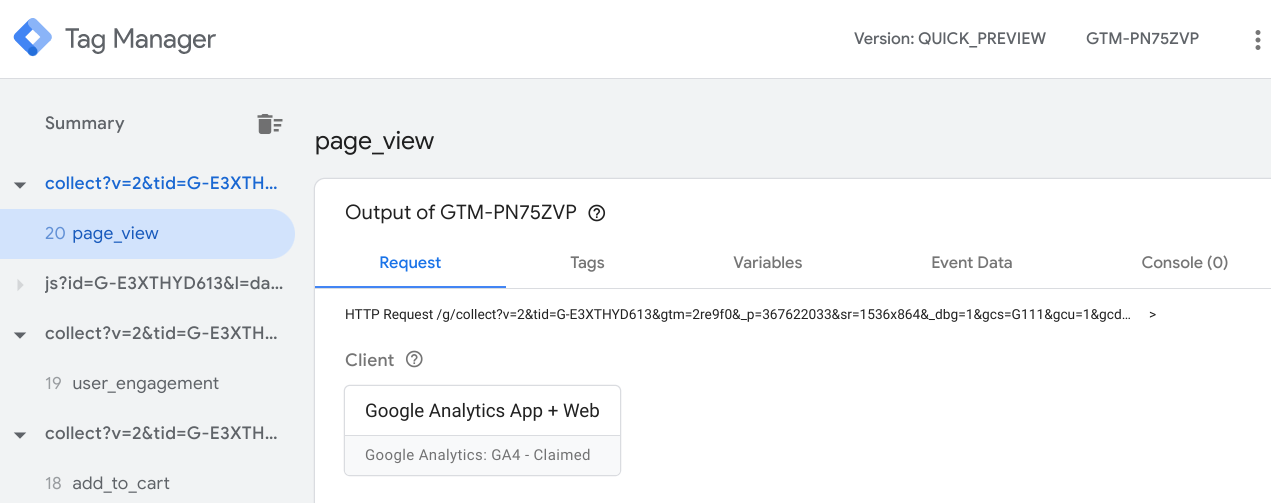
如要開啟偵錯工具,請在代碼管理工具中選取伺服器容器,然後按一下「預覽」。
左側面板會列出收到的 HTTP 要求,例如 collect?v=2&....。如果聲明要求的用戶端建立了事件資料物件 (例如 scroll、page_view、add_to_cart),這個事件會在要求下方顯示為子項目。
右側分頁標籤會提供左側面板中所選項目的詳細資料。 每個分頁標籤都會在獨立的章節中討論。
偵錯要求
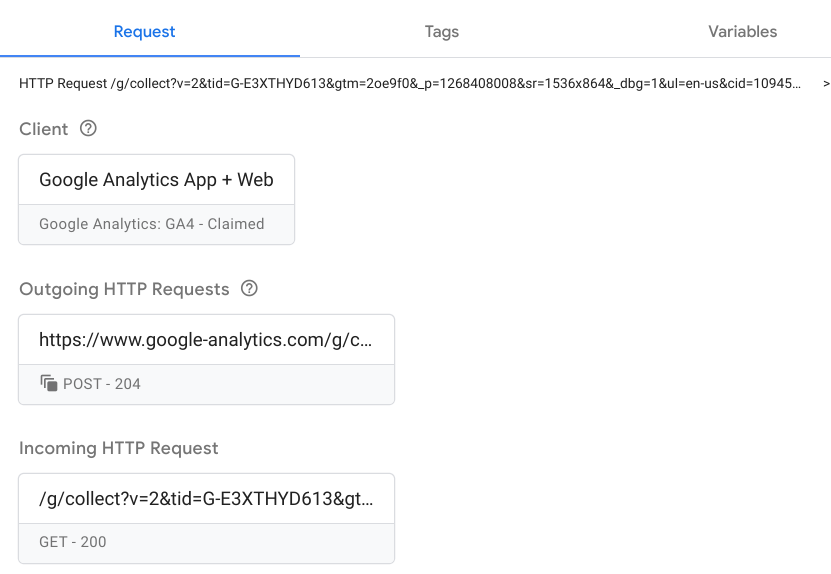
「Request」分頁中包含下列方塊:
- 已聲明要求的用戶端
- 傳出 HTTP 要求
- 傳入 HTTP 要求
確認正確的客戶已聲明要求擁有權
伺服器容器可以有多個用戶端,但只有一個用戶端可以認領要求。正確的用戶端可以辨識瀏覽器發出的要求格式,並在有相符項目時聲明其擁有權。
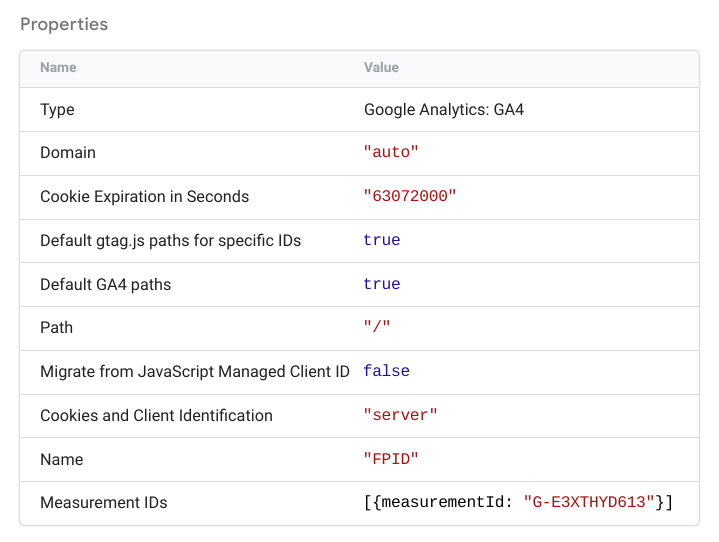
按一下「客戶」方塊,勾選客戶的詳細資料。這項資訊應與「Clients」(用戶端) >「Client name」(用戶端名稱) 中的用戶端設定對應。
查看傳入要求
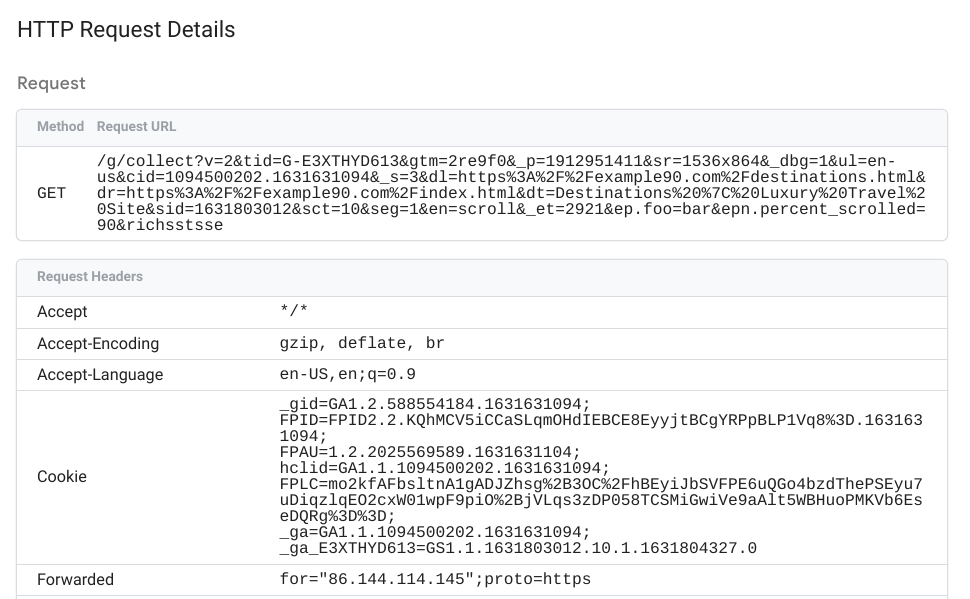
按一下「傳入 HTTP 要求」方塊,查看傳入要求的完整詳細資料。
要求 (collect?v=...) 應採用 1:1 的表示法,代表 Chrome 網路分頁顯示的內容。確認瀏覽器中顯示的內容相符,且伺服器容器接收的是正確的參數。
查看傳出要求
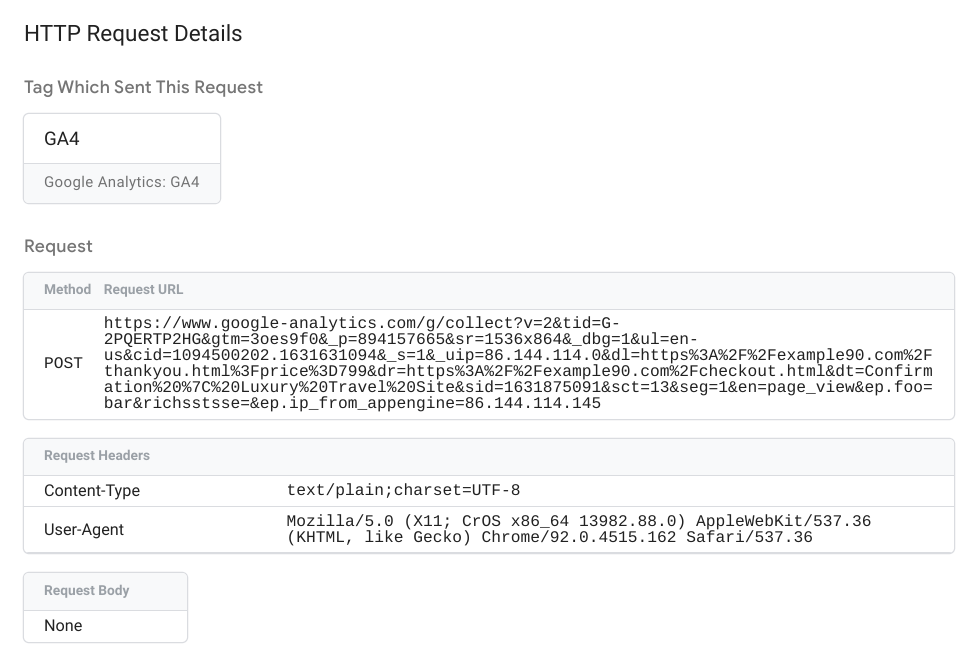
按一下任一「傳出 HTTP 要求」方塊,查看下列資訊:
- 產生要求的代碼
- 傳出要求
- 供應商端點傳回的 HTTP 回應
傳出要求詳細資料會顯示伺服器容器傳送至供應商端點的資料。
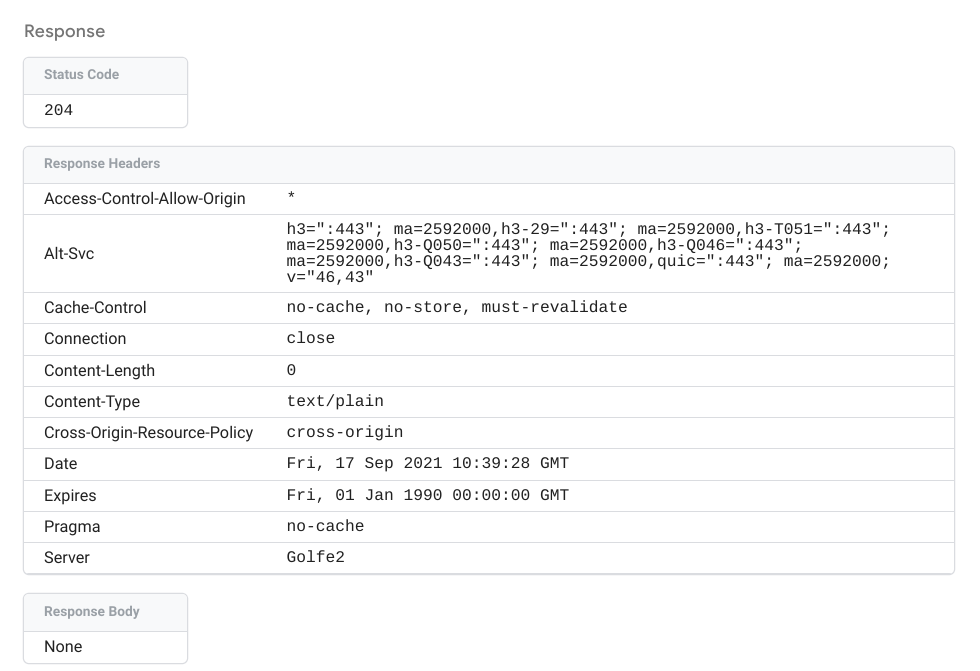
「回應」會顯示供應商端點傳回的狀態碼、標頭和主體 (如有)。
偵錯標記
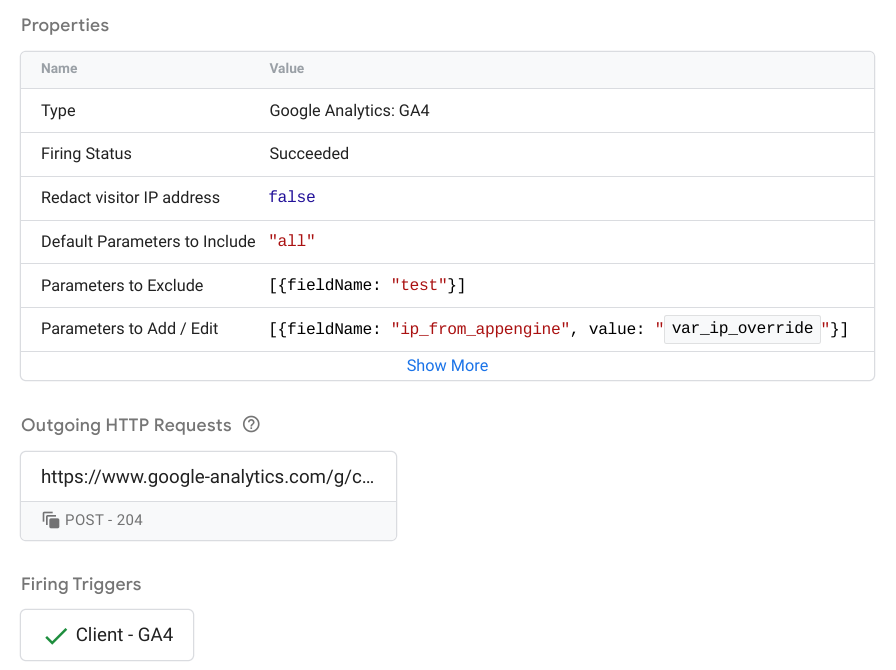
「代碼」分頁會列出所有已設定的代碼:
- 已觸發的代碼:由事件觸發的代碼。每個方塊都會指出代碼是否成功或觸發,以及代碼觸發的次數。
- 未觸發的代碼:可用的代碼未觸發。
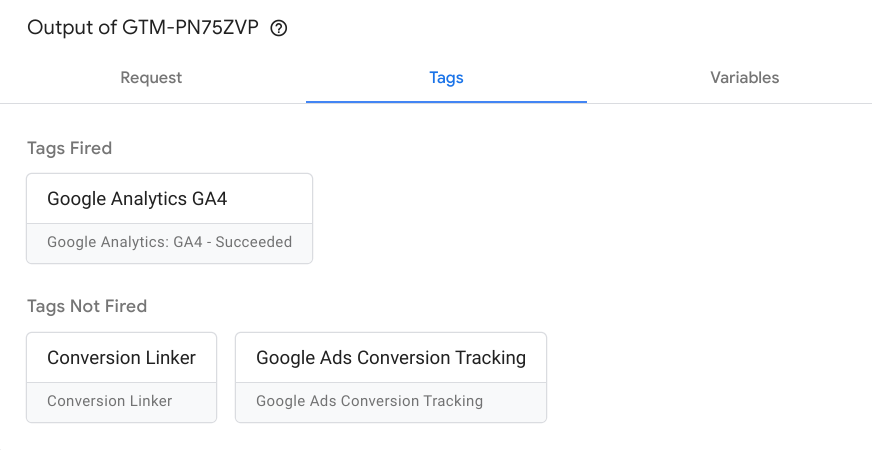
按一下任一方塊,即可查看代碼屬性、傳出 HTTP 要求和啟動觸發條件。
如要進一步瞭解如何設定及導入伺服器標記,請參閱「如何建構伺服器標記」。
偵錯變數
「Variables」代碼會列出事件的變數,包括變數類型、傳回類型和值。舉例來說,下方 user-engagement 事件的螢幕截圖顯示設為「1536x864」的 var_screen_resolution 變數。
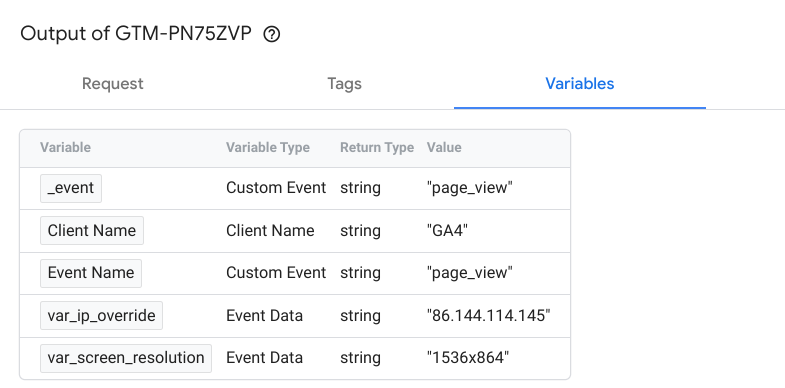
用於設定變數值的資料會顯示在「事件資料」分頁中。
請參閱「變數」一文,進一步瞭解如何設定內建變數和使用者定義的變數。
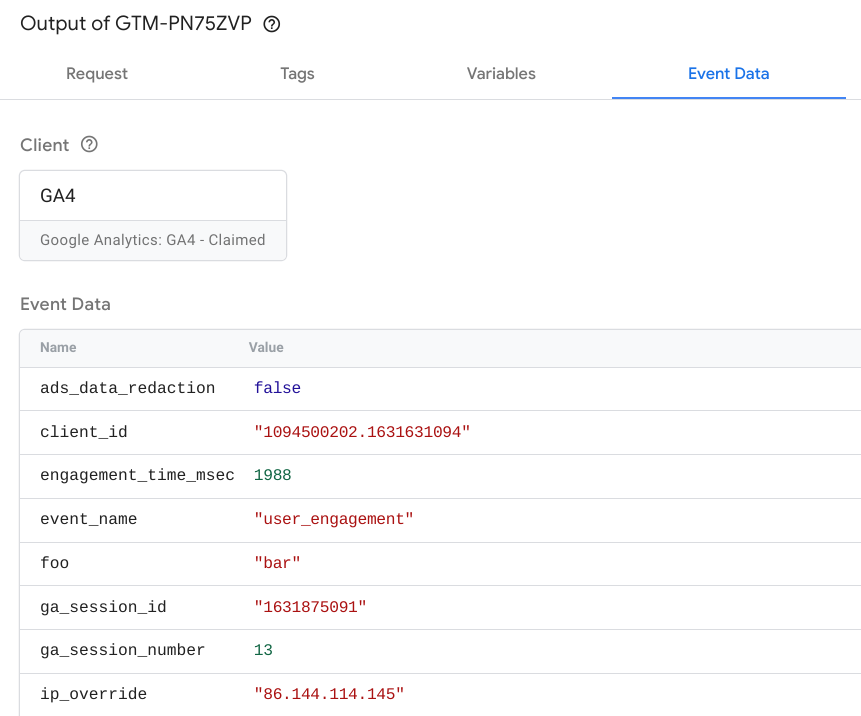
偵錯事件資料
「事件資料」分頁會顯示事件的完整詳細資料,這項資料可用於設定「Variables」(變數) 分頁中的變數值。
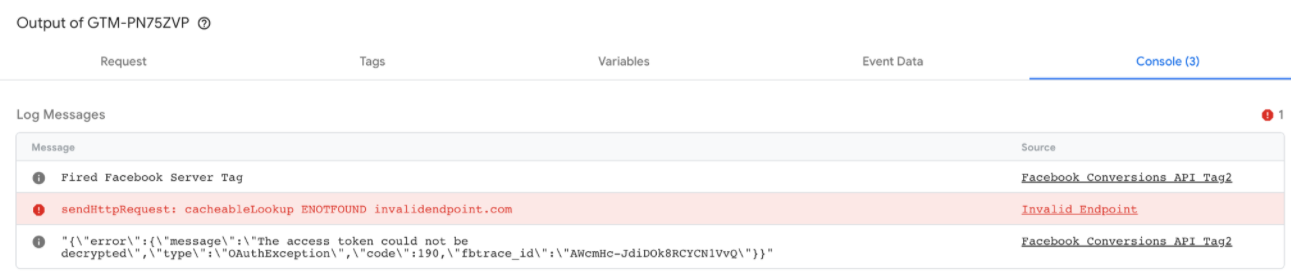
控制台
「Console」(控制台) 分頁會顯示所有來自已觸發代碼的錯誤。記錄會包含每則錯誤訊息及其來源,例如無效的端點或目標 API 呼叫。