
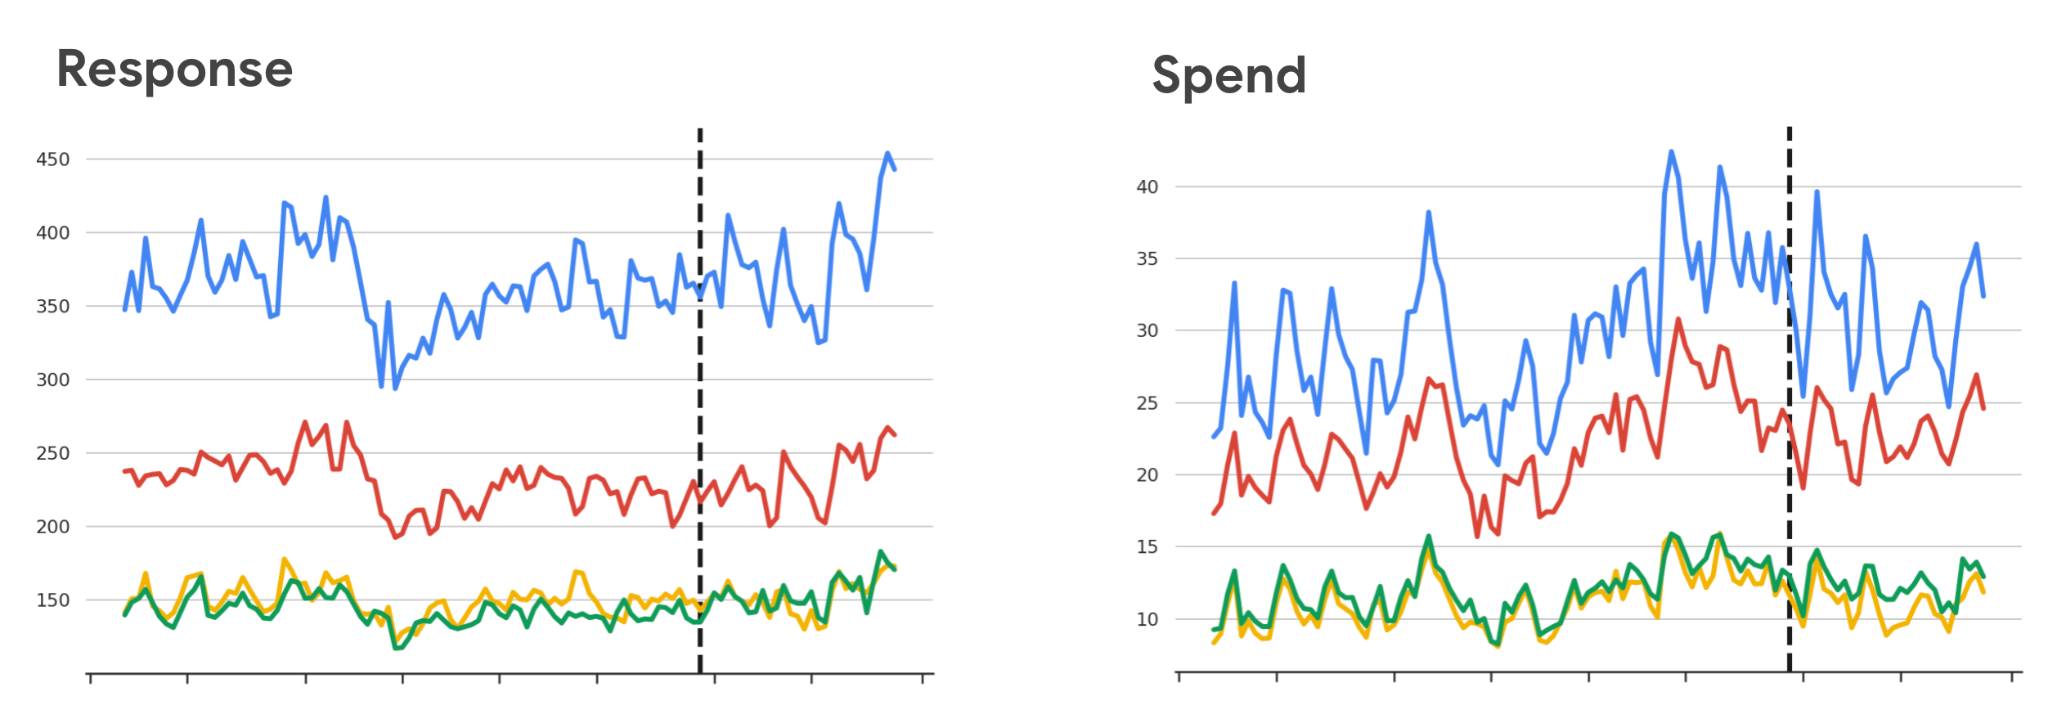
The data used in Meridian GeoX are daily time series of spend and response, such as conversion counts or revenue, for each geo respectively.
In the following graphs, the x-axis corresponds to the dates, and the y-axis represents the metric value, which is response and spend. Each line corresponds to one geo. The vertical dotted lines represent the split between pretest and test periods, and the intervention on ads happens in the test period.
General data requirements
Refer to the following sections for information on the data requirements for your geo experiments.
Spend data
For experiments involving go-dark or heavy-up designs—including treatment cells within multi-cell studies assigned to these types—the provision of spend time series data is mandatory. For holdback experiments, or holdback cells in multi-cell studies, spend is not required.
Conversion metric
Identifying an appropriate conversion metric is a fundamental requirement for the effective configuration and evaluation of geo experiments. A suitable metric should adhere to specific commercial and methodological standards:
- Business criteria: Your selected conversion definition should closely align with the primary KPI that informs strategic actions. This metric should reflect the specific influence of the media channel being evaluated. For example, prioritizing upper-funnel indicators when testing brand awareness tactics.
- Technical criteria: Conversion data must be accessible at the geographic level utilized for the experiment. It's advisable to exclude metrics with significant sparsity or large proportion of null entries, as these can complicate the statistical modeling process.
- Metric type and attribution: The conversion metric must be absolute, such as revenue or conversion count. Ratio metrics such as ROAS aren't supported by GeoX. Additionally, you should use raw, unfiltered conversion time series instead of attributed conversions. This prevents the results from being skewed by predefined attribution logic, which can misrepresent the actual causal incrementality.
Geo-level data
You should create a pretest geo-level time series data before designing a geo experiment. At this step, you'll provide a minimum of 3*N days worth of response data, such as revenue or conversion counts, where N is equals to the duration of the actual test period of your experiment. If your business experiences strong seasonality or cyclical patterns, you should prepare a longer historical period—such as one year or more—to train the model effectively and avoid introducing bias in the counterfactual estimation.
For experiment types that involve existing campaigns, such as go-dark or heavy-up, it's necessary to prepare daily geo-level spend series data as well, since they'll be used to calculate the required experiment budget with your existing campaign stats. This spend data can usually be retrieved from the Google Ads account or from publisher APIs.
Data structure
Your pretest dataset must be a Pandas DataFrame, and should contain the following columns:
- date
- location: Different market areas.
- conversions: Recent conversion data is usually raw unfiltered conversions or revenue data typically from the advertiser's CRM. The conversion data should reflect a business-as-usual (BAU) situation.
- spend: Spend data for campaigns included in the study. This is an optional column.
For multi-cell studies, you should provide separate spend columns mapped to each cell's specific intervention. Use cases include:
- Testing different strategies on the same channel or campaign: Compare different strategies—such as pausing ads completely versus heavily increasing spend—within the exact same platform, like YouTube. Because both cells modify the same underlying campaign pool, the spend cells such as spend_cell_1 and spend_cell_2 will have identical values.
- Testing different channels or tactics: Compare entirely separate approaches, such as YouTube ads versus Demand Gen ads, or prospecting versus retargeting. Since each cell is linked to a distinct campaign, the spend values will be different. Cell 1 should reflect the spend for the first tactic, while cell 2 should reflect the spend for the second.
Responses such as columns transactions or revenue data, plus spend data, should be prepared in the following format. Within the range of the pre-test period, each pair of date and location would appear exactly once in this table.
Here's an example of data upload for designing a single-cell go-dark experiment:
| date | location | conversions | spend |
|---|---|---|---|
| 2026-01-01 | LOC1 | 1104.88 | 142.55 |
| 2026-01-01 | LOC2 | 242.24 | 210.18 |
| 2026-01-01 | LOC3 | 339.95 | 325.25 |
| 2026-01-01 | LOC4 | 60.99 | 95.62 |
| 2026-01-01 | LOC5 | 173.20 | 178.62 |
| … | … | … | … |
Here's an example of data upload for designing a two-cell experiment. The first treatment cell should be go-dark, while the second treatment cell should be heavy-up during the experiment period:
| date | location | conversions | spend_cell_1 | spend_cell_2 |
|---|---|---|---|---|
| 2026-05-01 | Region_A | 45 | 120 | 150 |
| 2026-05-01 | Region_B | 30 | 80 | 100 |
| 2026-05-02 | Region_A | 50 | 125 | 155 |
| 2026-05-02 | Region_B | 35 | 85 | 105 |
| 2026-05-03 | Region_A | 48 | 122 | 152 |
Best practices
Follow these best practices to ensure your geo experiment is statistically robust.
Metrics with negative values
Don't use metrics that can contain negative values, such as net revenue after refunds. Negative values disrupt the design randomization and statistical modeling.
You should always use non-negative, absolute values like gross revenue or gross conversion counts. If refunds are significant, run the design and analysis on gross sales, and apply a historical net-to-gross ratio post-test.
Daily data volatilty
Don't aggregate your data weekly. GeoX strictly requires daily time-series and weekly data isn't supported. If your daily data is highly volatile:
- Extend the test duration—such as changing from four weeks to six or eight weeks—to accumulate more data.
- Use a shallower KPI such as add-to-cart instead of purchase to increase volume and reduce zero-count days.
- Increase the target treatment group size or adjusting
max_conversions_percentin design constraints.
KPI optimization
The library supports only one primary conversion KPI per run. You can't optimize a design for multiple metrics simultaneously, such as new buyers and returning buyers.
Run the design engine and optimize your primary KPI to ensure the study is
sufficiently powered. You may proceed cautiously to analyze secondary KPIs
post-test by running the analyze function on their respective data.