

Questa pagina mostra come accedere in modo programmatico a un set di dati e applicare stili alle relative caratteristiche, oltre a fornire esempi di stili per le caratteristiche dei dati basate su geometrie di punti, poligoni e polilinee.
Gli stili basati sui dati per i set di dati eseguono il rendering delle caratteristiche dei dati in base alle coordinate di latitudine e longitudine fornite dal file di dati geospaziali utilizzato per creare il set di dati.
Esempio di stile dei dati dei punti
Questo esempio mostra un approccio per applicare stili alle caratteristiche dei dati basate sulla geometria dei punti.

Informazioni sul set di dati
Il set di dati utilizzato in questo esempio è il risultato di un
sondaggio sugli scoiattoli del 2018
a Central Park, New York City.
Nel seguente estratto del file di dati CSV, vediamo che le colonne x e y vengono utilizzate per la geografia; è inclusa una colonna LatLng, ma non viene utilizzata in questo esempio perché i set di dati supportano il formato WKT solo se la colonna è denominata WKT. Per saperne di più sui formati supportati per la località, consulta i requisiti dei file CSV.
Il set di dati del censimento degli scoiattoli contiene una bella varietà di punti dati diversi relativi al colore della pelliccia e al comportamento osservati degli scoiattoli (scorri in orizzontale per visualizzarli tutti).
| X | Y | UniqueSquirrelID | Ettaro | Maiusc | Data | Hectare SquirrelNumber | Età | PrimaryFurColor | HighlightFurColor | CombinationofPrimaryandHighlightColor | Colornotes | Località | Misurazione AboveGroundSighter | SpecificLocation | In esecuzione | All'inseguimento | Arrampicata | Mangiare | Foraggiamento | Altre attività | Kuks | Quaas | Gemiti | Tailflags | Tailtwitches | Approcci | Indifferente | Runsfrom | OtherInteractions | LatLng |
|---|---|---|---|---|---|---|---|---|---|---|---|---|---|---|---|---|---|---|---|---|---|---|---|---|---|---|---|---|---|---|
| -73.9561344937861 | 40.7940823884086 | 37F-PM-1014-03 | 37F | PM | 10142018 | 3 | + | false | false | false | false | false | false | false | false | false | false | false | false | false | POINT (-73.9561344937861 40.7940823884086) | |||||||||
| -73.9688574691102 | 40.7837825208444 | 21B-AM-1019-04 | 21 mld | AM | 10192018 | 4 | + | false | false | false | false | false | false | false | false | false | false | false | false | false | POINT (-73.9688574691102 40.7837825208444) | |||||||||
| -73.9742811484852 | 40.775533619083 | 11B-PM-1014-08 | 11B | PM | 10142018 | 8 | Grigio | Grigio+ | Fuori terra | 10 | false | true | false | false | false | false | false | false | false | false | false | false | false | POINT (-73.97428114848522 40.775533619083) | ||||||
| -73.9596413903948 | 40.7903128889029 | 32E-PM-1017-14 | 32E | PM | 10172018 | 14 | Adulto | Grigio | Grigio+ | Nessun elemento selezionato come principale. Grigio selezionato come colore di evidenziazione. Apportato modifiche esecutive. | false | false | false | true | true | false | false | false | false | false | false | false | true | POINT (-73.9596413903948 40.7903128889029) | ||||||
| -73.9702676472613 | 40.7762126854894 | 13E-AM-1017-05 | 13E | AM | 10172018 | 5 | Adulto | Grigio | Cannella | Grigio + cannella | Fuori terra | su un ceppo d'albero | false | false | false | false | true | false | false | false | false | false | false | false | false | POINT (-73.9702676472613 40.7762126854894) | ||||
| -73.9683613516225 | 40.7725908847499 | 11H-AM-1010-03 | 11H | AM | 10102018 | 3 | Adulto | Cannella | Bianco | Cannella + bianco | false | false | false | false | true | false | false | false | false | true | false | true | false | POINT (-73.9683613516225 40.7725908847499) | ||||||
| -73.9541201789795 | 40.7931811701082 | 36H-AM-1010-02 | 36H | AM | 10102018 | 2 | Adulto | Grigio | Grigio+ | just outside hectare | Piano di massa | FALSO | false | false | false | false | true | false | false | false | false | false | false | false | false | POINT (-73.9541201789795 40.7931811701082) |
Applica uno stile alle caratteristiche dei dati puntuali
Il codice in questo esempio adotta l'approccio di applicare uno stile al colore di riempimento e al colore del tratto per ogni punto in base all'attributo CombinationofPrimaryandHighlightColor, che combina i colori della pelliccia principale e secondaria di ogni scoiattolo.
Swift
let options = GMSMapViewOptions()
options.mapID = GMSMapID(identifier: "YOUR_MAP_ID")
options.camera = GMSCameraPosition(latitude: 40.7, longitude: -74.0, zoom: 12)
let mapView = GMSMapView(options: options)

let layer = mapView.datasetFeatureLayer(of: "YOUR_DATASET_ID")

// Define a point style with fill and radius.
// Apply the style to the datasets features.
layer.style = { feature in
    switch(feature.datasetAttributes["CombinationofPrimaryandHighlightColor"]){
      case "Black+"  :
        let style = MutableFeatureStyle()
        style.fillColor = .black;
        style.pointRadius = 8;
        return style
      case "Cinnamon+"  :
        let style = MutableFeatureStyle()
        style.fillColor = UIColor(red: 139/255, green: 0, blue: 0, alpha: 1);
        style.pointRadius = 8;
        return style
      ...
      default :
        let style = MutableFeatureStyle()
        style.fillColor = .yellow;
        style.pointRadius = 8;
        return style
    }
}
Objective-C
GMSMapViewOptions *options = [[GMSMapViewOptions alloc] init];
options.camera = [GMSCameraPosition cameraWithLatitude:40.7 longitude:-74.0 zoom:12];
options.mapID = [GMSMapID mapIDWithIdentifier:@"MAP_ID"];
GMSMapView *mapView = [[GMSMapView alloc] initWithOptions:options];

GMSDatasetFeatureLayer *layer = [mapView datasetFeatureLayerOfDatasetID:@"YOUR_DATASET_ID"];

// Define a point style with fill and radius.
// Apply the style to the datasets features.
layer.style = ^(GMSDatasetFeature *feature) {
  NSString *attrib = feature.datasetAttributes[@"CombinationofPrimaryandHighlightColor"];
  if ([attrib isEqualToString:@"Black+"])  {
    GMSMutableFeatureStyle *style = [GMSMutableFeatureStyle style];
    style.fillColor = [UIColor blackColor];
    style.pointRadius = 8;
    return style;
  } else if([attrib isEqualToString:@"Cinnamon+"]) {
    GMSMutableFeatureStyle *style = [GMSMutableFeatureStyle style];
    style.fillColor = [UIColor colorWithRed:139.0f/255.0f
                                      green:0.0f
                                        blue:0.0f
                                      alpha:1.0f];
    style.pointRadius = 8;
    return style;
  }
  ...
  else {
    GMSMutableFeatureStyle *style = [GMSMutableFeatureStyle style];
    style.fillColor = [UIColor yellowColor];
    style.pointRadius = 8;
    return style;
  }
};
Esempio di stile dei dati dei poligoni
Questo esempio mostra un approccio per applicare stili alle caratteristiche dei dati basate sulla geometria dei poligoni.

Informazioni sul set di dati
Il set di dati utilizzato in questo esempio mostra i parchi di New York. Il seguente estratto del file GeoJSON del set di dati mostra una voce di elemento rappresentativa.
{
  "type": "Feature",
  "properties": {
    "jurisdiction": "DPR",
    "mapped": "False",
    "zipcode": "11356",
    "acres": "0.05",
    "location": "College Pl., College Pt. Blvd., bet. 11 Ave. and 12 Ave.",
    "nys_assembly": "27",
    "councildistrict": "19",
    "url": "http://www.nycgovparks.org/parks/Q042/",
    "typecategory": "Triangle/Plaza",
    "us_congress": "14",
    "eapply": "Poppenhusen Park",
    "parentid": "Q-07",
    "gispropnum": "Q042",
    "retired": "false",
    "communityboard": "407",
    "objectid": "6248",
    "globalid": "F4810079-CBB9-4BE7-BBFA-B3C0C35D5DE5",
    "name311": "Poppenhusen Park",
    "department": "Q-07",
    "pip_ratable": "true",
    "subcategory": "Sitting Area/Triangle/Mall",
    "precinct": "109",
    "permit": "true",
    "acquisitiondate": null,
    "omppropid": "Q042",
    "gisobjid": "100000301",
    "signname": "Poppenhusen Park",
    "address": null,
    "permitparent": "Q-07",
    "class": "PARK",
    "nys_senate": "11",
    "permitdistrict": "Q-07",
    "borough": "Q",
    "waterfront": "false"
  },
  "geometry": {
    "type": "MultiPolygon",
    "coordinates": [
      [
        [
          [
            -73.84575702371716,
            40.78796240884273
          ],
          [
            -73.84593393292693,
            40.78796857347548
          ],
          [
            -73.84577256469657,
            40.787651355629556
          ],
          [
            -73.84575702371716,
            40.78796240884273
          ]
        ]
      ]
    ]
  }
},
Applica uno stile agli elementi dei dati poligonali
Il codice in questo esempio applica una colorazione speciale alle caratteristiche dei dati associate a un typecategory "Non sviluppato" o "Parkway" e colora di verde tutte le altre caratteristiche.
Swift
let options = GMSMapViewOptions()
options.mapID = GMSMapID(identifier: "YOUR_MAP_ID")
options.camera = GMSCameraPosition(latitude: 40.7, longitude: -74.0, zoom: 12)
let mapView = GMSMapView(options: options)

let layer = mapView.datasetFeatureLayer(of: "YOUR_DATASET_ID")

// Define a polygon style with fill and stroke.
// Apply the style to the datasets features.
layer.style = { feature in
  switch(feature.datasetAttributes["typecategory"]){
    case "Undeveloped"  :
      let style = MutableFeatureStyle()
      style.fillColor = .blue.withAlphaComponent(0.3);
      style.strokeColor = .blue;
      style.strokeWidth = 2.0;
      return style
    case "Parkway"  :
      let style = MutableFeatureStyle()
      style.fillColor = .red.withAlphaComponent(0.3);
      style.strokeColor = .red;
      style.strokeWidth = 2.0;
      return style
    default :
      let style = MutableFeatureStyle()
      style.fillColor = .green.withAlphaComponent(0.3);
      style.strokeColor = .green;
      style.strokeWidth = 2.0;
      return style
  }
}
Objective-C
GMSMapViewOptions *options = [[GMSMapViewOptions alloc] init];
options.camera = [GMSCameraPosition cameraWithLatitude:40.7 longitude:-74.0 zoom:12];
options.mapID = [GMSMapID mapIDWithIdentifier:@"MAP_ID"];
GMSMapView *mapView = [[GMSMapView alloc] initWithOptions:options];

GMSDatasetFeatureLayer *layer = [mapView datasetFeatureLayerOfDatasetID:@"YOUR_DATASET_ID"];

// Define a polygon style with fill and stroke.
// Apply the style to the datasets features.
layer.style = ^(GMSDatasetFeature *feature) {
  NSString *attrib = feature.datasetAttributes[@"typecategory"];
  if ([attrib isEqualToString:@"Undeveloped"]) {
        GMSMutableFeatureStyle *style = [GMSMutableFeatureStyle style];
        style.fillColor = [[UIColor blueColor] colorWithAlphaComponent:0.3];
        style.strokeColor = [UIColor blueColor];
        style.strokeWidth = 2.0;
        return style;
  } else if([attrib isEqualToString:@"Parkway"]) {
        GMSMutableFeatureStyle *style = [GMSMutableFeatureStyle style];
        style.fillColor = [[UIColor redColor] colorWithAlphaComponent:0.3];
        style.strokeColor = [UIColor redColor];
        style.strokeWidth = 2.0;
        return style;
  } else {
        GMSMutableFeatureStyle *style = [GMSMutableFeatureStyle style];
        style.fillColor = [[UIColor greenColor] colorWithAlphaComponent:0.3];
        style.strokeColor = [UIColor greenColor];
        style.strokeWidth = 2.0;
        return style;
    }
  };
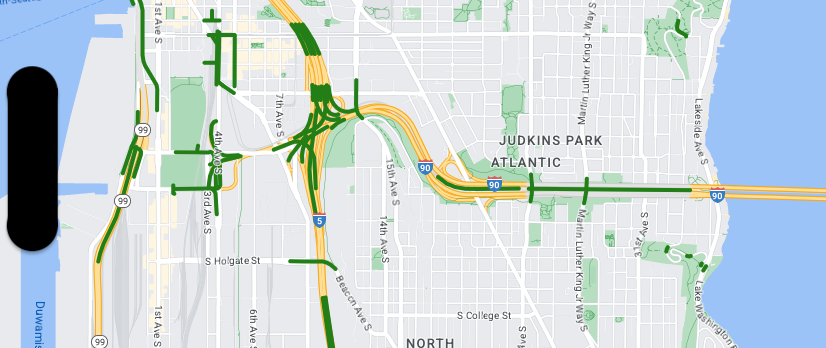
Esempio di stile dei dati delle polilinee
Questo esempio mostra un approccio per applicare stili alle caratteristiche dei dati basate sulla geometria delle polilinee.
Informazioni sul set di dati
Il set di dati utilizzato in questo esempio mostra i ponti nell'area di Seattle. Il seguente estratto del file GeoJSON del set di dati mostra una voce di elemento rappresentativa.
{
  "type": "Feature",
  "properties": {
      "OBJECTID": 1,
      "COMPTYPE": 66,
      "COMPKEY": 515774,
      "HANSEGKEY": 489781,
      "UNITID": "BRG-935",
      "UNITTYPE": " ",
      "BRGUNITID": "BRG-935",
      "UNITDESC_BRG": "YALE AVE BR REV LANE OC                                                                                                                                                                                                                                        ",
      "UNITDESC_SEG": "HOWELL ST ON RP BETWEEN HOWELL ST AND I5 SB                                                                                                                                                                                                                    ",
      "INSTDATE": null,
      "EXPDATE": null,
      "STATUS": " ",
      "STATUSDT": null,
      "CONDITION": " ",
      "CONDDT": null,
      "OWN": " ",
      "LSTVERIFY": null,
      "MAINTBY": " ",
      "ADDBY": "GARCIAA",
      "ADDDTTM": "2010-01-21T00:00:00Z",
      "MODBY": null,
      "MODDTTM": null,
      "BR_NBR": 935,
      "BR_CODE": " 935",
      "BR_TYPE": "ST",
      "BR_NAME": "YALE AVE BR REV LANE OC",
      "BR_FACILITIES": "YALE AVE-SR 5 ON RAMP",
      "BR_FEATURES": "SR 5 REV LANE",
      "BR_RATING": 0,
      "BR_INSET": 1,
      "BR_GEO": "DT",
      "BR_OWNER": "DOT",
      "BR_OWNER_NAME": "State of Washington",
      "GEOBASID": 0,
      "XGEOBASID": 0,
      "GISSEGKEY": 489781,
      "EARTHQUAKE_RESPONSE_TEAM": " ",
      "SHAPE_Length": 220.11891836147655
  },
  "geometry": {
      "type": "LineString",
      "coordinates": [
          [
              -122.329201929090928,
              47.616910448708538
          ],
          [
              -122.329206483407461,
              47.616976719821004
          ],
          [
              -122.32921802149356,
              47.617042137515213
          ],
          [
              -122.329236413912909,
              47.617105967923777
          ],
          [
              -122.329261454336034,
              47.617167494985758
          ],
          [
              -122.329292861855023,
              47.617226028479571
          ],
          [
              -122.329330284134699,
              47.617280911766009
          ],
          [
              -122.329373301365223,
              47.617331529154569
          ],
          [
              -122.329421430971635,
              47.617377312810319
          ],
          [
              -122.329474133027375,
              47.617417749124023
          ],
          [
              -122.32953081631139,
              47.617452384473893
          ]
      ]
  }
},
Applica uno stile alle caratteristiche dei dati delle polilinee
Lo snippet seguente applica lo stesso stile direttamente a tutte le caratteristiche dei dati.
Swift
// Define a style with green fill and stroke.
// Apply the style to the datasets features.
layer.style = { feature in
  let style = MutableFeatureStyle()
  style.fillColor = .green.withAlphaComponent(0.5);
  style.strokeColor = [UIColor greenColor];
  style.strokeWidth = 2.0;
  return style
}
Objective-C
// Define a style with green fill and stroke.
// Apply the style to the datasets features.
layer.style = ^(GMSDatasetFeature *feature) {
  GMSMutableFeatureStyle *style = [GMSMutableFeatureStyle style];
  style.fillColor = [[UIColor greenColor] colorWithAlphaComponent:0.5];
  style.strokeColor = [UIColor greenColor];
  style.strokeWidth = 2.0;
  return style;
};