

Earth Engine چندین روش برای انجام وایازش خطی بااستفاده از کاهندهها دارد:
ee.Reducer.linearFit()ee.Reducer.linearRegression()ee.Reducer.robustLinearRegression()ee.Reducer.ridgeRegression()
سادهترین کاهنده وایازش خطی linearFit() است که
تخمین حداقل مربعات تابع خطی یک متغیر را با
یک عبارت ثابت محاسبه میکند. برای رویکردی انعطافپذیرتر به مدلسازی خطی، از یکی از کاهندههای وایازش خطی استفاده کنید که امکان تعداد متغیری از متغیرهای مستقل و وابسته را فراهم میکند. linearRegression() وایازش حداقل مربعات معمولی(OLS) را اجرا میکند. robustLinearRegression() از تابع هزینه براساس
باقیماندههای رگرسیون برای کاهش وزن تکراری دادههای پرت در دادهها استفاده میکند
(O’Leary, 1990).
ridgeRegression() رگرسیون خطی را با منظمسازی L2 انجام میدهد.
تحلیل رگرسیون با این روشها برای کاهش
اشیاء ee.ImageCollection، ee.Image، ee.FeatureCollection، و ee.List مناسب است.
مثالهای زیر کاربرد هرکدام را نشان میدهد. توجه داشته باشید که
linearRegression()، robustLinearRegression()، و ridgeRegression() همگی
ساختارهای ورودی و خروجی یکسانی دارند، اما linearFit() انتظار یک ورودی دو باندی (X و سپس Y) را دارد و ridgeRegression() یک پارامتر اضافی
(lambda، اختیاری) و خروجی (pValue) دارد.
ee.ImageCollection
linearFit()
دادهها باید بهعنوان تصویر ورودی دو باندی تنظیم شوند، که باند اول متغیر مستقل و باند دوم متغیر وابسته است. مثال زیر تخمین روند خطی بارش آینده (پساز سال ۲۰۰۶ در دادههای NEX-DCP30) را نشان میدهد که توسط مدلهای اقلیمی پیشبینی شده است. متغیر وابسته، بارش پیشبینیشده است و متغیر مستقل، زمان است که قبلاز فراخوانی linearFit() اضافه شده است:
ویرایشگر کد (جاوا اسکریپت)
// This function adds a time band to the image.
var createTimeBand = function(image) {
  // Scale milliseconds by a large constant to avoid very small slopes
  // in the linear regression output.
  return image.addBands(image.metadata('system:time_start').divide(1e18));
};

// Load the input image collection: projected climate data.
var collection = ee.ImageCollection('NASA/NEX-DCP30_ENSEMBLE_STATS')
  .filter(ee.Filter.eq('scenario', 'rcp85'))
  .filterDate(ee.Date('2006-01-01'), ee.Date('2050-01-01'))
  // Map the time band function over the collection.
  .map(createTimeBand);

// Reduce the collection with the linear fit reducer.
// Independent variable are followed by dependent variables.
var linearFit = collection.select(['system:time_start', 'pr_mean'])
  .reduce(ee.Reducer.linearFit());

// Display the results.
Map.setCenter(-100.11, 40.38, 5);
Map.addLayer(linearFit,
  {min: 0, max: [-0.9, 8e-5, 1], bands: ['scale', 'offset', 'scale']}, 'fit');
Observe that the output contains two bands, the ‘offset’ (intercept) and the ‘scale’ ('scale' in this context refers to the slope of the line and is not to be confused with the scale parameter input to many reducers, which is the spatial scale). نتیجه، با مناطق دارای روند افزایشی به رنگ آبی، روند کاهشی به رنگ قرمز، و بدون روند به رنگ سبز باید چیزی شبیه به شکل ۱ باشد.
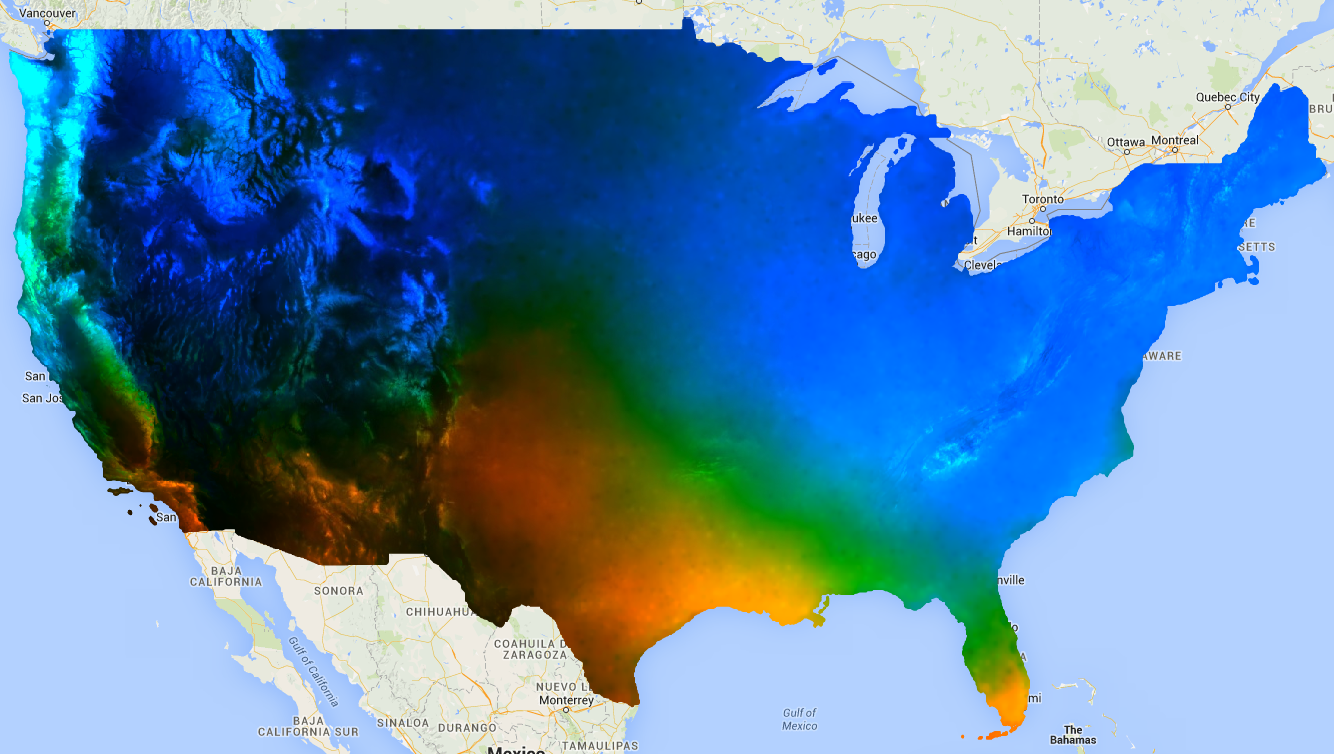
شکل ۱. خروجی linearFit()
روی بارش پیشبینیشده اعمال شد. مناطقی که پیشبینی میشود بارش در آنها افزایش یابد با رنگ آبی و مناطقی که پیشبینی میشود بارش در آنها کاهش یابد با رنگ قرمز نشان داده میشوند.
linearRegression()
برای مثال، فرض کنید دو متغیر وابسته وجود دارد: بارش و حداکثر دما، و دو متغیر مستقل: یک ثابت و زمان. مجموعه با مثال قبلی یکسان است، اما باند ثابت باید قبلاز کاهش بهصورت دستی اضافه شود. دو باند اول ورودی متغیرهای «X» (مستقل) و دو باند بعدی متغیرهای «Y» (وابسته) هستند. در این مثال، ابتدا ضرایب رگرسیون را دریافت کنید، سپس تصویر آرایه را مسطح کنید تا باندهای موردنظر را استخراج کنید:
ویرایشگر کد (جاوا اسکریپت)
// This function adds a time band to the image.
var createTimeBand = function(image) {
  // Scale milliseconds by a large constant.
  return image.addBands(image.metadata('system:time_start').divide(1e18));
};

// This function adds a constant band to the image.
var createConstantBand = function(image) {
  return ee.Image(1).addBands(image);
};

// Load the input image collection: projected climate data.
var collection = ee.ImageCollection('NASA/NEX-DCP30_ENSEMBLE_STATS')
  .filterDate(ee.Date('2006-01-01'), ee.Date('2099-01-01'))
  .filter(ee.Filter.eq('scenario', 'rcp85'))
  // Map the functions over the collection, to get constant and time bands.
  .map(createTimeBand)
  .map(createConstantBand)
  // Select the predictors and the responses.
  .select(['constant', 'system:time_start', 'pr_mean', 'tasmax_mean']);

// Compute ordinary least squares regression coefficients.
var linearRegression = collection.reduce(
  ee.Reducer.linearRegression({
    numX: 2,
    numY: 2
}));

// Compute robust linear regression coefficients.
var robustLinearRegression = collection.reduce(
  ee.Reducer.robustLinearRegression({
    numX: 2,
    numY: 2
}));

// The results are array images that must be flattened for display.
// These lists label the information along each axis of the arrays.
var bandNames = [['constant', 'time'], // 0-axis variation.
                 ['precip', 'temp']]; // 1-axis variation.

// Flatten the array images to get multi-band images according to the labels.
var lrImage = linearRegression.select(['coefficients']).arrayFlatten(bandNames);
var rlrImage = robustLinearRegression.select(['coefficients']).arrayFlatten(bandNames);

// Display the OLS results.
Map.setCenter(-100.11, 40.38, 5);
Map.addLayer(lrImage,
  {min: 0, max: [-0.9, 8e-5, 1], bands: ['time_precip', 'constant_precip', 'time_precip']}, 'OLS');

// Compare the results at a specific point:
print('OLS estimates:', lrImage.reduceRegion({
  reducer: ee.Reducer.first(),
  geometry: ee.Geometry.Point([-96.0, 41.0]),
  scale: 1000
}));

print('Robust estimates:', rlrImage.reduceRegion({
  reducer: ee.Reducer.first(),
  geometry: ee.Geometry.Point([-96.0, 41.0]),
  scale: 1000
}));
نتایج را بررسی کنید تا متوجه شوید که خروجی linearRegression() معادل ضرایب تخمینزدهشده توسط کاهنده linearFit() است، اگرچه خروجی linearRegression() ضرایبی برای متغیر وابسته دیگر، tasmax_mean، نیز دارد. ضریبهای رگرسیون خطی مقاوم با تخمینهای OLS متفاوت است. این مثال ضرایب را از روشهای رگرسیون مختلف در نقطهای خاص مقایسه میکند.
ee.Image
در بافت شیء ee.Image، میتوان از کاهندههای رگرسیون با
reduceRegion یا reduceRegions برای انجام رگرسیون خطی روی پیکسلهای منطقه(ها) استفاده کرد. مثالهای زیر
نحوه محاسبه ضرایب رگرسیون بین باندهای Landsat
در یک چندضلعی دلخواه را نشان میدهند.
linearFit()
بخش راهنما که نمودارهای دادههای آرایه را توصیف میکند،
نمودار پراکندگی همبستگی بین باندهای Landsat 8 SWIR1 و SWIR2 را نشان میدهد. در اینجا، ضرایب وایازشی خطی برای این رابطه محاسبه میشود. واژهنامهای حاوی ویژگیهای 'offset' (عرض از مبدأ) و
'scale' (شیب) برگردانده میشود.
ویرایشگر کد (جاوا اسکریپت)
// Define a rectangle geometry around San Francisco.
var sanFrancisco = ee.Geometry.Rectangle([-122.45, 37.74, -122.4, 37.8]);

// Import a Landsat 8 TOA image for this region.
var img = ee.Image('LANDSAT/LC08/C02/T1_TOA/LC08_044034_20140318');

// Subset the SWIR1 and SWIR2 bands. In the regression reducer, independent
// variables come first followed by the dependent variables. In this case,
// B5 (SWIR1) is the independent variable and B6 (SWIR2) is the dependent
// variable.
var imgRegress = img.select(['B5', 'B6']);

// Calculate regression coefficients for the set of pixels intersecting the
// above defined region using reduceRegion with ee.Reducer.linearFit().
var linearFit = imgRegress.reduceRegion({
  reducer: ee.Reducer.linearFit(),
  geometry: sanFrancisco,
  scale: 30,
});

// Inspect the results.
print('OLS estimates:', linearFit);
print('y-intercept:', linearFit.get('offset'));
print('Slope:', linearFit.get('scale'));
linearRegression()
همان تحلیل بخش linearFit قبلی در اینجا اعمال میشود،
با این تفاوت که اینبار از تابع ee.Reducer.linearRegression استفاده میشود. توجه داشته باشید که تصویر رگرسیون از سه تصویر جداگانه ساخته شده است: یک تصویر ثابت و تصاویری که نشاندهنده باندهای SWIR1 و SWIR2 از همان تصویر Landsat 8 هستند. بهخاطر داشته باشید که میتوانید هر مجموعهای از باندها را برای ساختن تصویر ورودی برای کاهش منطقه توسط ee.Reducer.linearRegression ترکیب کنید، آنها نباید به یک تصویر منبع تعلق داشته باشند.
ویرایشگر کد (جاوا اسکریپت)
// Define a rectangle geometry around San Francisco.
var sanFrancisco = ee.Geometry.Rectangle([-122.45, 37.74, -122.4, 37.8]);

// Import a Landsat 8 TOA image for this region.
var img = ee.Image('LANDSAT/LC08/C02/T1_TOA/LC08_044034_20140318');

// Create a new image that is the concatenation of three images: a constant,
// the SWIR1 band, and the SWIR2 band.
var constant = ee.Image(1);
var xVar = img.select('B5');
var yVar = img.select('B6');
var imgRegress = ee.Image.cat(constant, xVar, yVar);

// Calculate regression coefficients for the set of pixels intersecting the
// above defined region using reduceRegion. The numX parameter is set as 2
// because the constant and the SWIR1 bands are independent variables and they
// are the first two bands in the stack; numY is set as 1 because there is only
// one dependent variable (SWIR2) and it follows as band three in the stack.
var linearRegression = imgRegress.reduceRegion({
  reducer: ee.Reducer.linearRegression({
    numX: 2,
    numY: 1
  }),
  geometry: sanFrancisco,
  scale: 30,
});

// Convert the coefficients array to a list.
var coefList = ee.Array(linearRegression.get('coefficients')).toList();

// Extract the y-intercept and slope.
var b0 = ee.List(coefList.get(0)).get(0); // y-intercept
var b1 = ee.List(coefList.get(1)).get(0); // slope

// Extract the residuals.
var residuals = ee.Array(linearRegression.get('residuals')).toList().get(0);

// Inspect the results.
print('OLS estimates', linearRegression);
print('y-intercept:', b0);
print('Slope:', b1);
print('Residuals:', residuals);
واژهنامهای حاوی ویژگیهای 'coefficients' و 'residuals'
برگردانده میشود. ویژگی 'coefficients' آرایهای با ابعاد (numX, numY) است؛ هر ستون حاوی ضرایب متغیر وابسته مربوطه است. دراینصورت، آرایه دو ردیف و یک ستون دارد؛
ردیف یک، ستون یک عرض از مبدأ است و ردیف دو، ستون یک شیب است. ویژگی
'residuals' بردار جذر میانگین مربعات باقیماندههای
هر متغیر وابسته است. ضرایب را با تبدیل نتیجه به آرایه و سپس برش دادن عناصر موردنظر یا تبدیل آرایه به فهرست و انتخاب ضرایب براساس موقعیت نمایه استخراج کنید.
ee.FeatureCollection
فرض کنید میخواهید رابطه خطی بین Sentinel-2 و بازتاب Landsat 8 SWIR1 را بدانید. در این مثال، از نمونه تصادفی پیکسلها که بهعنوان مجموعه ویژگی نقاط قالببندی شدهاند برای محاسبه رابطه استفاده میشود. نمودار پراکندگی جفتهای پیکسل بههمراه خط بهترین برازش حداقل مربعات تولید میشود (شکل ۲).
ویرایشگر کد (جاوا اسکریپت)
// Import a Sentinel-2 TOA image.
var s2ImgSwir1 = ee.Image('COPERNICUS/S2_HARMONIZED/20191022T185429_20191022T185427_T10SEH');

// Import a Landsat 8 TOA image from 12 days earlier than the S2 image.
var l8ImgSwir1 = ee.Image('LANDSAT/LC08/C02/T1_TOA/LC08_044033_20191010');

// Get the intersection between the two images - the area of interest (aoi).
var aoi = s2ImgSwir1.geometry().intersection(l8ImgSwir1.geometry());

// Get a set of 1000 random points from within the aoi. A feature collection
// is returned.
var sample = ee.FeatureCollection.randomPoints({
  region: aoi,
  points: 1000
});

// Combine the SWIR1 bands from each image into a single image.
var swir1Bands = s2ImgSwir1.select('B11')
  .addBands(l8ImgSwir1.select('B6'))
  .rename(['s2_swir1', 'l8_swir1']);

// Sample the SWIR1 bands using the sample point feature collection.
var imgSamp = swir1Bands.sampleRegions({
  collection: sample,
  scale: 30
})
// Add a constant property to each feature to be used as an independent variable.
.map(function(feature) {
  return feature.set('constant', 1);
});

// Compute linear regression coefficients. numX is 2 because
// there are two independent variables: 'constant' and 's2_swir1'. numY is 1
// because there is a single dependent variable: 'l8_swir1'. Cast the resulting
// object to an ee.Dictionary for easy access to the properties.
var linearRegression = ee.Dictionary(imgSamp.reduceColumns({
  reducer: ee.Reducer.linearRegression({
    numX: 2,
    numY: 1
  }),
  selectors: ['constant', 's2_swir1', 'l8_swir1']
}));

// Convert the coefficients array to a list.
var coefList = ee.Array(linearRegression.get('coefficients')).toList();

// Extract the y-intercept and slope.
var yInt = ee.List(coefList.get(0)).get(0); // y-intercept
var slope = ee.List(coefList.get(1)).get(0); // slope

// Gather the SWIR1 values from the point sample into a list of lists.
var props = ee.List(['s2_swir1', 'l8_swir1']);
var regressionVarsList = ee.List(imgSamp.reduceColumns({
  reducer: ee.Reducer.toList().repeat(props.size()),
  selectors: props
}).get('list'));

// Convert regression x and y variable lists to an array - used later as input
// to ui.Chart.array.values for generating a scatter plot.
var x = ee.Array(ee.List(regressionVarsList.get(0)));
var y1 = ee.Array(ee.List(regressionVarsList.get(1)));

// Apply the line function defined by the slope and y-intercept of the
// regression to the x variable list to create an array that will represent
// the regression line in the scatter plot.
var y2 = ee.Array(ee.List(regressionVarsList.get(0)).map(function(x) {
  var y = ee.Number(x).multiply(slope).add(yInt);
  return y;
}));

// Concatenate the y variables (Landsat 8 SWIR1 and predicted y) into an array
// for input to ui.Chart.array.values for plotting a scatter plot.
var yArr = ee.Array.cat([y1, y2], 1);

// Make a scatter plot of the two SWIR1 bands for the point sample and include
// the least squares line of best fit through the data.
print(ui.Chart.array.values({
  array: yArr,
  axis: 0,
  xLabels: x})
  .setChartType('ScatterChart')
  .setOptions({
    legend: {position: 'none'},
    hAxis: {'title': 'Sentinel-2 SWIR1'},
    vAxis: {'title': 'Landsat 8 SWIR1'},
    series: {
      0: {
        pointSize: 0.2,
        dataOpacity: 0.5,
      },
      1: {
        pointSize: 0,
        lineWidth: 2,
      }
    }
  })
);
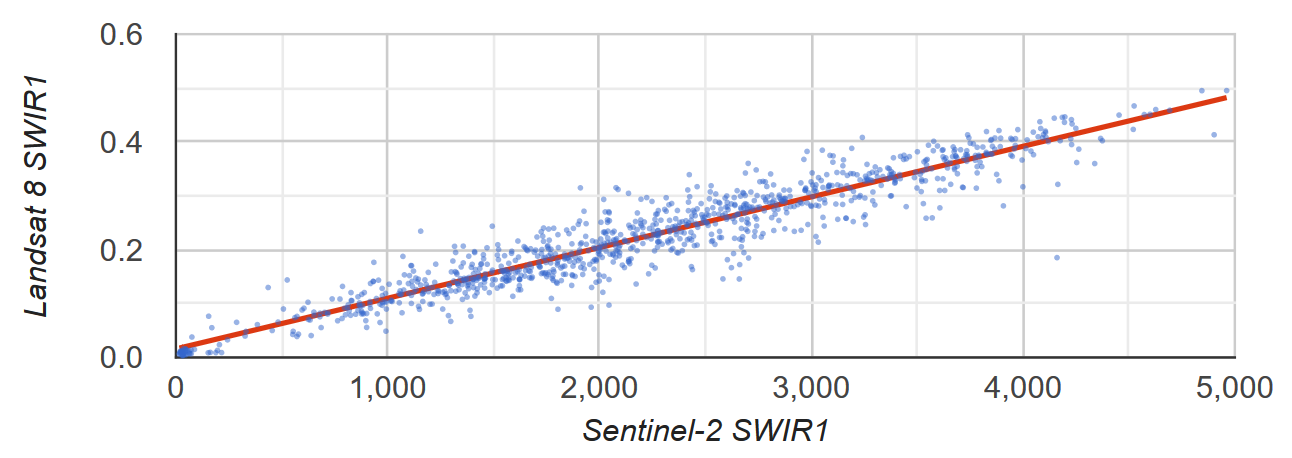
شکل ۲. نمودار پراکندگی و خط وایازش خطی حداقل مربعات برای نمونهای از پیکسلها که بازتاب Sentinel-2 و Landsat 8 SWIR1 TOA را نشان میدهد.
ee.List
ستونهای اشیای دوبعدی ee.List میتوانند ورودیهای کاهندههای رگرسیون باشند. مثالهای زیر اثباتهای سادهای ارائه میدهند؛ متغیر مستقل کپیای از متغیر وابسته است که عرض از مبدأ برابر با ۰ و شیب برابر با ۱ تولید میکند.
linearFit()
ویرایشگر کد (جاوا اسکریپت)
// Define a list of lists, where columns represent variables. The first column
// is the independent variable and the second is the dependent variable.
var listsVarColumns = ee.List([
  [1, 1],
  [2, 2],
  [3, 3],
  [4, 4],
  [5, 5]
]);

// Compute the least squares estimate of a linear function. Note that an
// object is returned; cast it as an ee.Dictionary to make accessing the
// coefficients easier.
var linearFit = ee.Dictionary(listsVarColumns.reduce(ee.Reducer.linearFit()));

// Inspect the result.
print(linearFit);
print('y-intercept:', linearFit.get('offset'));
print('Slope:', linearFit.get('scale'));
اگر متغیرها با ردیفها نشان داده میشوند، فهرست را جابهجا کنید، برای این کار آن را به
ee.Array تبدیل کنید، آن را جابهجا کنید، سپس دوباره به ee.List تبدیل کنید.
ویرایشگر کد (جاوا اسکریپت)
// If variables in the list are arranged as rows, you'll need to transpose it.
// Define a list of lists where rows represent variables. The first row is the
// independent variable and the second is the dependent variable.
var listsVarRows = ee.List([
  [1, 2, 3, 4, 5],
  [1, 2, 3, 4, 5]
]);

// Cast the ee.List as an ee.Array, transpose it, and cast back to ee.List.
var listsVarColumns = ee.Array(listsVarRows).transpose().toList();

// Compute the least squares estimate of a linear function. Note that an
// object is returned; cast it as an ee.Dictionary to make accessing the
// coefficients easier.
var linearFit = ee.Dictionary(listsVarColumns.reduce(ee.Reducer.linearFit()));

// Inspect the result.
print(linearFit);
print('y-intercept:', linearFit.get('offset'));
print('Slope:', linearFit.get('scale'));
linearRegression()
کاربرد ee.Reducer.linearRegression() مشابه مثال linearFit() بالا است، با این تفاوت که یک متغیر مستقل ثابت گنجانده شده است.
ویرایشگر کد (جاوا اسکریپت)
// Define a list of lists where columns represent variables. The first column
// represents a constant term, the second an independent variable, and the third
// a dependent variable.
var listsVarColumns = ee.List([
  [1, 1, 1],
  [1, 2, 2],
  [1, 3, 3],
  [1, 4, 4],
  [1, 5, 5]
]);

// Compute ordinary least squares regression coefficients. numX is 2 because
// there is one constant term and an additional independent variable. numY is 1
// because there is only a single dependent variable. Cast the resulting
// object to an ee.Dictionary for easy access to the properties.
var linearRegression = ee.Dictionary(
  listsVarColumns.reduce(ee.Reducer.linearRegression({
    numX: 2,
    numY: 1
})));

// Convert the coefficients array to a list.
var coefList = ee.Array(linearRegression.get('coefficients')).toList();

// Extract the y-intercept and slope.
var b0 = ee.List(coefList.get(0)).get(0); // y-intercept
var b1 = ee.List(coefList.get(1)).get(0); // slope

// Extract the residuals.
var residuals = ee.Array(linearRegression.get('residuals')).toList().get(0);

// Inspect the results.
print('OLS estimates', linearRegression);
print('y-intercept:', b0);
print('Slope:', b1);
print('Residuals:', residuals);