

 اجرا کردن در Google Colab
 مشاهده منبع در GitHub
ee.Image اشیاء مجموعهای از روشهای رابطهای، شرطی، و بولی برای ساختن عبارتهای تصمیمگیری دارند. نتایج این روشها برای محدود کردن تجزیهوتحلیل به پیکسلها یا مناطق خاص ازطریق پوشاندن، توسعه نقشههای طبقهبندیشده، و تخصیص مجدد مقدار مفید است.
عملگرهای رابطهای و بولی
روشهای رابطهای شامل موارد زیر است:
eq()، gt()، gte()، lt()، و
lte()
روشهای بولی شامل موارد زیر است:
ویرایشگر کد (جاوا اسکریپت)
and()، or()، و not()
Colab (Python)
And()، Or()، و Not()
برای انجام مقایسه پیکسلبهپیکسل بین تصاویر، از عملگرهای رابطهای استفاده کنید. برای استخراج مناطق شهری در یک تصویر، این مثال از عملگرهای رابطهای برای آستانهگذاری شاخصهای طیفی استفاده میکند و آستانهها را با عملگر and ترکیب میکند:
ویرایشگر کد (جاوا اسکریپت)
// Load a Landsat 8 image.
var image = ee.Image('LANDSAT/LC08/C02/T1_TOA/LC08_044034_20140318');

// Create NDVI and NDWI spectral indices.
var ndvi = image.normalizedDifference(['B5', 'B4']);
var ndwi = image.normalizedDifference(['B3', 'B5']);

// Create a binary layer using logical operations.
var bare = ndvi.lt(0.2).and(ndwi.lt(0));

// Mask and display the binary layer.
Map.setCenter(-122.3578, 37.7726, 12);
Map.setOptions('satellite');
Map.addLayer(bare.selfMask(), {}, 'bare');
import ee
import geemap.core as geemap
Colab (Python)
# Load a Landsat 8 image.
image = ee.Image('LANDSAT/LC08/C02/T1_TOA/LC08_044034_20140318')

# Create NDVI and NDWI spectral indices.
ndvi = image.normalizedDifference(['B5', 'B4'])
ndwi = image.normalizedDifference(['B3', 'B5'])

# Create a binary layer using logical operations.
bare = ndvi.lt(0.2).And(ndwi.lt(0))

# Define a map centered on San Francisco Bay.
map_bare = geemap.Map(center=[37.7726, -122.3578], zoom=12)

# Add the masked image layer to the map and display it.
map_bare.add_layer(bare.selfMask(), None, 'bare')
display(map_bare)
همانطور که در این مثال نشان داده شده است، خروجی عملگرهای رابطهای و بولی
یا درست (۱) یا نادرست (۰) است. برای پوشاندن ۰ها، میتوانید تصویر دودویی حاصل را بااستفاده از selfMask() با خودش بپوشانید.
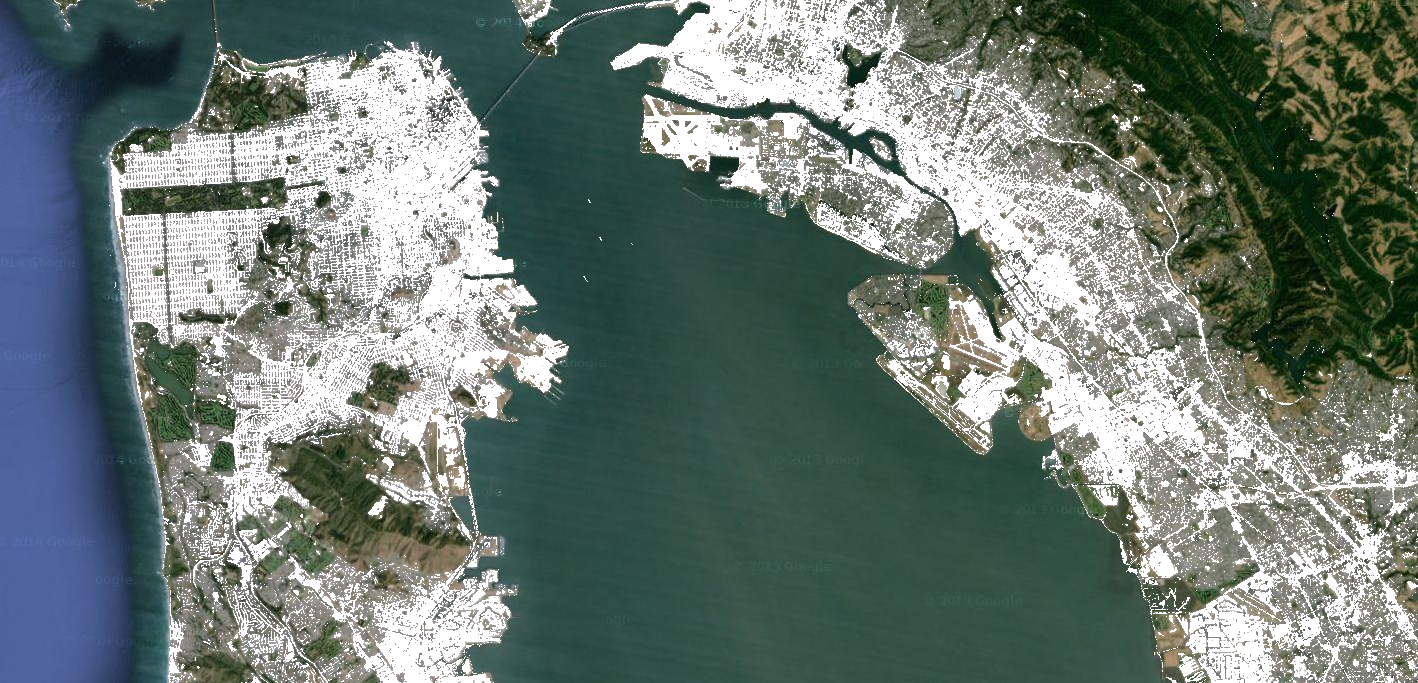
تصاویر دودویی که توسط عملگرهای رابطهای و بولی برگردانده میشوند را میتوان با
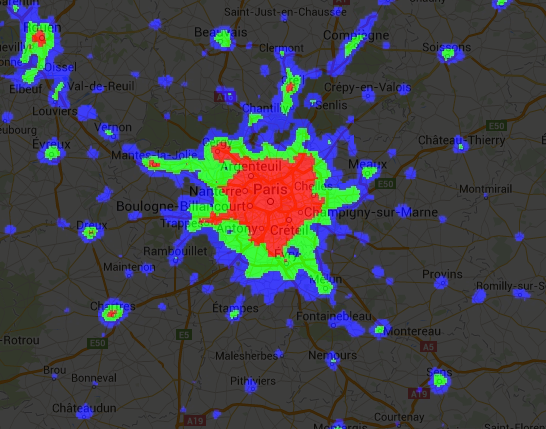
عملگرهای ریاضی استفاده کرد. این مثال بااستفاده از عملگرهای رابطهای و add()، مناطق شهرنشینی را در تصویر چراغهای شبانه ایجاد میکند:
ویرایشگر کد (جاوا اسکریپت)
// Load a 2012 nightlights image.
var nl2012 = ee.Image('NOAA/DMSP-OLS/NIGHTTIME_LIGHTS/F182012');
var lights = nl2012.select('stable_lights');

// Define arbitrary thresholds on the 6-bit stable lights band.
var zones = lights.gt(30).add(lights.gt(55)).add(lights.gt(62));

// Display the thresholded image as three distinct zones near Paris.
var palette = ['000000', '0000FF', '00FF00', 'FF0000'];
Map.setCenter(2.373, 48.8683, 8);
Map.addLayer(zones, {min: 0, max: 3, palette: palette}, 'development zones');
import ee
import geemap.core as geemap
Colab (Python)
# Load a 2012 nightlights image.
nl_2012 = ee.Image('NOAA/DMSP-OLS/NIGHTTIME_LIGHTS/F182012')
lights = nl_2012.select('stable_lights')

# Define arbitrary thresholds on the 6-bit stable lights band.
zones = lights.gt(30).add(lights.gt(55)).add(lights.gt(62))

# Define a map centered on Paris, France.
map_zones = geemap.Map(center=[48.8683, 2.373], zoom=8)

# Display the thresholded image as three distinct zones near Paris.
palette = ['000000', '0000FF', '00FF00', 'FF0000']
map_zones.add_layer(
    zones, {'min': 0, 'max': 3, 'palette': palette}, 'development zones'
)
display(map_zones)
اپراتورهای شرطی
توجه داشته باشید که کد مثال قبلی معادل استفاده از
عملگر سهتایی است که توسط
expression() پیادهسازی شده است:
ویرایشگر کد (جاوا اسکریپت)
// Create zones using an expression, display.
var zonesExp = nl2012.expression(
    "(b('stable_lights') > 62) ? 3" +
      ": (b('stable_lights') > 55) ? 2" +
        ": (b('stable_lights') > 30) ? 1" +
          ": 0"
);
Map.addLayer(zonesExp,
             {min: 0, max: 3, palette: palette},
             'development zones (ternary)');
import ee
import geemap.core as geemap
Colab (Python)
# Create zones using an expression, display.
zones_exp = nl_2012.expression(
    "(b('stable_lights') > 62) ? 3 "
    ": (b('stable_lights') > 55) ? 2 "
    ": (b('stable_lights') > 30) ? 1 "
    ': 0'
)

# Define a map centered on Paris, France.
map_zones_exp = geemap.Map(center=[48.8683, 2.373], zoom=8)

# Add the image layer to the map and display it.
map_zones_exp.add_layer(
    zones_exp, {'min': 0, 'max': 3, 'palette': palette}, 'zones exp'
)
display(map_zones_exp)
توجه داشته باشید که در مثال عبارت قبلی، به باند موردنظر بااستفاده از تابع b() ارجاع داده شده است، نه بااستفاده از واژهنامه نامهای متغیر. در این صفحه درباره عبارتهای تصویری بیشتر بدانید. استفاده از عملگرهای ریاضی یا عبارت، نتیجه یکسانی خواهد داشت.
روش دیگر برای پیادهسازی عملیات شرطی روی تصاویر، استفاده از عملگر where() است. نیاز به جایگزین کردن پیکسلهای پوشاندهشده با دادههای دیگر را درنظر بگیرید. در مثال زیر، پیکسلهای ابری بااستفاده از where() با پیکسلهای تصویری بدون ابر جایگزین میشوند:
ویرایشگر کد (جاوا اسکریپت)
// Load a cloudy Sentinel-2 image.
var image = ee.Image(
  'COPERNICUS/S2_SR_HARMONIZED/20210114T185729_20210114T185730_T10SEG');
Map.addLayer(image,
             {bands: ['B4', 'B3', 'B2'], min: 0, max: 2000},
             'original image');

// Load another image to replace the cloudy pixels.
var replacement = ee.Image(
  'COPERNICUS/S2_SR_HARMONIZED/20210109T185751_20210109T185931_T10SEG');

// Set cloudy pixels (greater than 5% probability) to the other image.
var replaced = image.where(image.select('MSK_CLDPRB').gt(5), replacement);

// Display the result.
Map.setCenter(-122.3769, 37.7349, 11);
Map.addLayer(replaced,
             {bands: ['B4', 'B3', 'B2'], min: 0, max: 2000},
             'clouds replaced');
import ee
import geemap.core as geemap
Colab (Python)
# Load a cloudy Sentinel-2 image.
image = ee.Image(
    'COPERNICUS/S2_SR_HARMONIZED/20210114T185729_20210114T185730_T10SEG'
)

# Load another image to replace the cloudy pixels.
replacement = ee.Image(
    'COPERNICUS/S2_SR_HARMONIZED/20210109T185751_20210109T185931_T10SEG'
)

# Set cloudy pixels (greater than 5% probability) to the other image.
replaced = image.where(image.select('MSK_CLDPRB').gt(5), replacement)

# Define a map centered on San Francisco Bay.
map_replaced = geemap.Map(center=[37.7349, -122.3769], zoom=11)

# Display the images on a map.
vis_params = {'bands': ['B4', 'B3', 'B2'], 'min': 0, 'max': 2000}
map_replaced.add_layer(image, vis_params, 'original image')
map_replaced.add_layer(replaced, vis_params, 'clouds replaced')
display(map_replaced)