

پیمانه ui.Chart.feature حاوی مجموعهای از توابع برای پردازاندن
نمودارها از اشیاء Feature و FeatureCollection است. انتخاب تابع، ترتیب دادهها را در نمودار تعیین میکند، یعنی آنچه مقادیر محور x و y را تعریف میکند و آنچه سری را تعریف میکند. از شرحها و مثالهای تابع زیر برای تعیین بهترین تابع و نوع نمودار برای هدفتان استفاده کنید.
توابع نمودار
از نمودارهای طرح زیر بهعنوان راهنمای تصویری برای درک نحوه چیدمان ویژگیها و مشخصههای آنها در نمودار توسط هر تابع استفاده کنید؛ یعنی کدام عناصر مقادیر x، مقادیر y، و سریها را تعریف میکنند.
عارضهها براساس مقادیر یک ویژگی انتخابشده در امتداد محور x رسم میشوند. سریها با فهرستی از نامهای دارایی تعریف میشوند که مقادیر آنها درطول محور y رسم شده است.
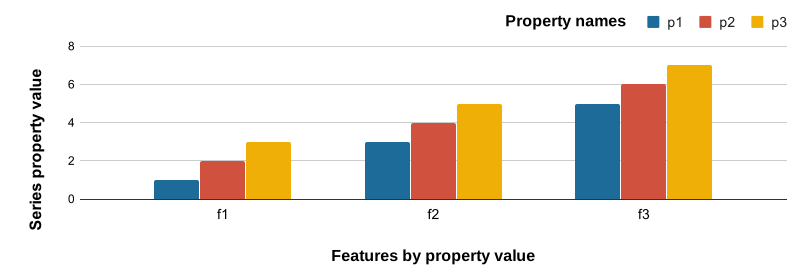
ویژگیهای عارضه براساس نام در امتداد محور x رسم میشوند؛ مقادیر ویژگیهای دادهشده در امتداد محور y رسم میشوند. مجموعهها عارضههایی هستند که با مقادیر خصوصیت انتخابشده برچسبگذاری شدهاند.
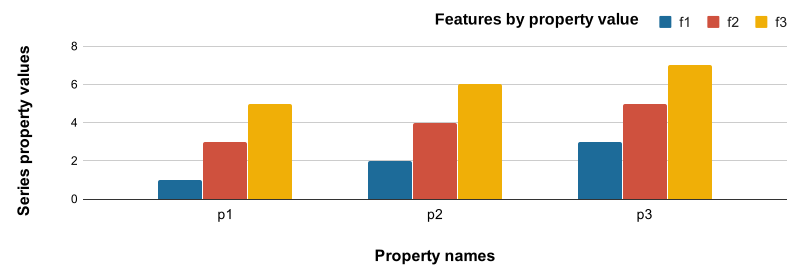
عارضهها براساس مقادیر یک ویژگی انتخابشده در امتداد محور x رسم میشوند. مجموعهها با مقادیر یکتای یک ویژگی مشخص تعریف میشوند. موقعیت محور Y با مقدار ویژگی دادهشده تعریف میشود.
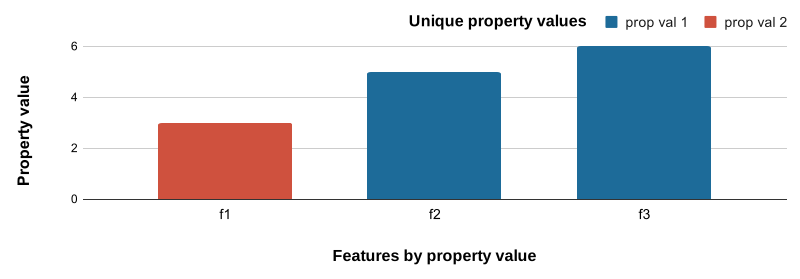
هیستوگرام فراوانی برای مقادیر خصوصیت انتخابشده.
- محور X: دستههای هیستوگرام برای مقادیر خصوصیت انتخابشده
- محور Y: فراوانی ویژگیهای واجدشرایط برای هر دسته هیستوگرام
دادههای نمونه
نمونههای زیر به FeatureCollection متشکل از سه
ویژگی بومناحیه با ویژگیهایی که هنجارهای اقلیمی را توصیف میکنند متکی هستند.
ببینید دادههای نمونه چطور ایجاد شدهاند
ویرایشگر کد (جاوا اسکریپت)
// Define three representative ecoregions in the USA.
var desert = ee.Feature(
    ee.Geometry.Rectangle(-109.21, 31.42, -108.3, 32.03),
    {label: 'Desert', value: 0});

var forest = ee.Feature(
    ee.Geometry.Rectangle(-122.73, 43.45, -122.28, 43.91),
    {label: 'Forest', value: 1});

var grassland = ee.Feature(
    ee.Geometry.Rectangle(-101.81, 41.7, -100.53, 42.51),
    {label: 'Grassland', value: 2});

// Combine features into a feature collection.
var ecoregions = ee.FeatureCollection([desert, forest, grassland]);

// Load PRISM climate normals image collection; convert images to bands.
var normClim = ee.ImageCollection('OREGONSTATE/PRISM/Norm91m').toBands();

// Summarize climate normals for each ecoregion feature as a set or properties.
ecoregions = normClim.reduceRegions(
    {collection: ecoregions, reducer: ee.Reducer.mean(), scale: 5e4});

// Add a property for whether January temperature is warm or not.
ecoregions = ecoregions.map(function(ecoregion) {
  return ecoregion.set('warm', ee.Number(ecoregion.get('01_tmean')).gt(0));
});
ui.Chart.feature.byFeature
نمودار ستونی
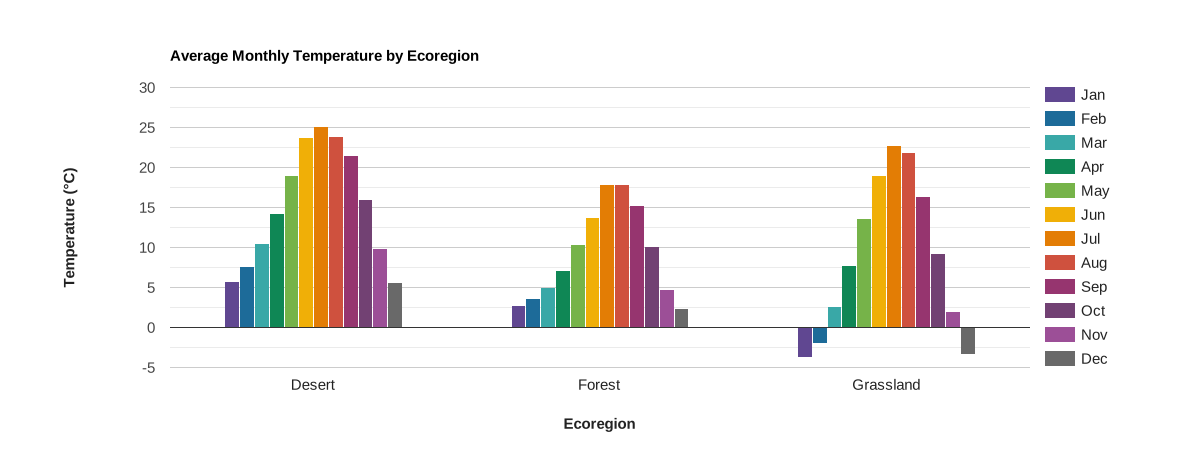
ویژگیها در امتداد محور x رسم میشوند و با مقادیر یک ویژگی انتخابشده برچسبگذاری میشوند. مجموعهها با ستونهای مجاور تعریفشده با فهرستی از نامهای دارایی نشان داده میشوند که مقادیر آنها در امتداد محور y رسم شده است.
ویرایشگر کد (جاوا اسکریپت)
// Import the example feature collection.
var ecoregions = ee.FeatureCollection('projects/google/charts_feature_example');

// Define the chart and print it to the console.
var chart =
    ui.Chart.feature
        .byFeature({
          features: ecoregions.select('[0-9][0-9]_tmean|label'),
          xProperty: 'label',
        })
        .setSeriesNames([
          'Jan', 'Feb', 'Mar', 'Apr', 'May', 'Jun', 'Jul', 'Aug', 'Sep', 'Oct',
          'Nov', 'Dec'
        ])
        .setChartType('ColumnChart')
        .setOptions({
          title: 'Average Monthly Temperature by Ecoregion',
          hAxis:
              {title: 'Ecoregion', titleTextStyle: {italic: false, bold: true}},
          vAxis: {
            title: 'Temperature (°C)',
            titleTextStyle: {italic: false, bold: true}
          },
          colors: [
            '604791', '1d6b99', '39a8a7', '0f8755', '76b349', 'f0af07',
            'e37d05', 'cf513e', '96356f', '724173', '9c4f97', '696969'
          ]
        });
print(chart);
نمودار میلهای
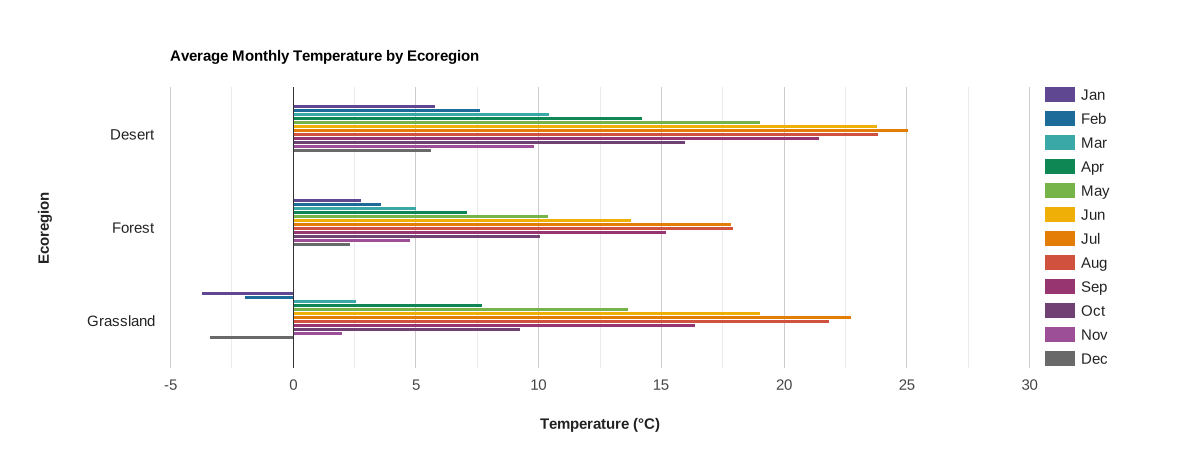
ویژگیها در امتداد محور y رسم میشوند و با مقادیر یک ویژگی انتخابشده برچسبگذاری میشوند. مجموعهها با نوارهای مجاور نشان داده میشوند که با فهرستی از نامهای دارایی تعریف شدهاند که مقادیر آنها در امتداد محور x رسم شده است.
ویرایشگر کد (جاوا اسکریپت)
// Import the example feature collection.
var ecoregions = ee.FeatureCollection('projects/google/charts_feature_example');

// Define the chart and print it to the console.
var chart =
    ui.Chart.feature
        .byFeature({
          features: ecoregions.select('[0-9][0-9]_tmean|label'),
          xProperty: 'label',
        })
        .setSeriesNames([
          'Jan', 'Feb', 'Mar', 'Apr', 'May', 'Jun', 'Jul', 'Aug', 'Sep', 'Oct',
          'Nov', 'Dec'
        ])
        .setChartType('BarChart')
        .setOptions({
          title: 'Average Monthly Temperature by Ecoregion',
          hAxis: {
            title: 'Temperature (°C)',
            titleTextStyle: {italic: false, bold: true}
          },
          vAxis:
              {title: 'Ecoregion', titleTextStyle: {italic: false, bold: true}},
          colors: [
            '604791', '1d6b99', '39a8a7', '0f8755', '76b349', 'f0af07',
            'e37d05', 'cf513e', '96356f', '724173', '9c4f97', '696969'
          ]
        });
print(chart);
نمودار ستونی پشتهای
مطلق
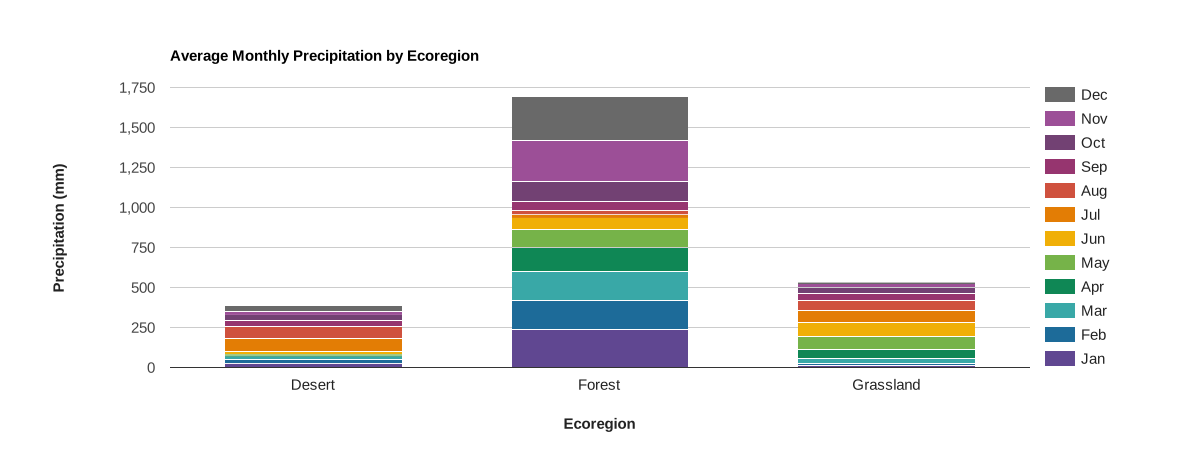
ویژگیها در امتداد محور x رسم میشوند و با مقادیر یک ویژگی انتخابشده برچسبگذاری میشوند. مجموعهها با ستونهای پشتهای نشان داده میشوند که با فهرستی از نامهای دارایی تعریف شدهاند که مقادیر آنها در امتداد محور y بهعنوان مجموع تجمعی مجموعه رسم میشود.
ویرایشگر کد (جاوا اسکریپت)
// Import the example feature collection.
var ecoregions = ee.FeatureCollection('projects/google/charts_feature_example');

// Define the chart and print it to the console.
var chart =
    ui.Chart.feature
        .byFeature({
          features: ecoregions.select('[0-9][0-9]_ppt|label'),
          xProperty: 'label'
        })
        .setSeriesNames([
          'Jan', 'Feb', 'Mar', 'Apr', 'May', 'Jun', 'Jul', 'Aug', 'Sep', 'Oct',
          'Nov', 'Dec'
        ])
        .setChartType('ColumnChart')
        .setOptions({
          title: 'Average Monthly Precipitation by Ecoregion',
          hAxis:
              {title: 'Ecoregion', titleTextStyle: {italic: false, bold: true}},
          vAxis: {
            title: 'Precipitation (mm)',
            titleTextStyle: {italic: false, bold: true}
          },
          colors: [
            '604791', '1d6b99', '39a8a7', '0f8755', '76b349', 'f0af07',
            'e37d05', 'cf513e', '96356f', '724173', '9c4f97', '696969'
          ],
          isStacked: 'absolute'
        });
print(chart);
خویشاوند
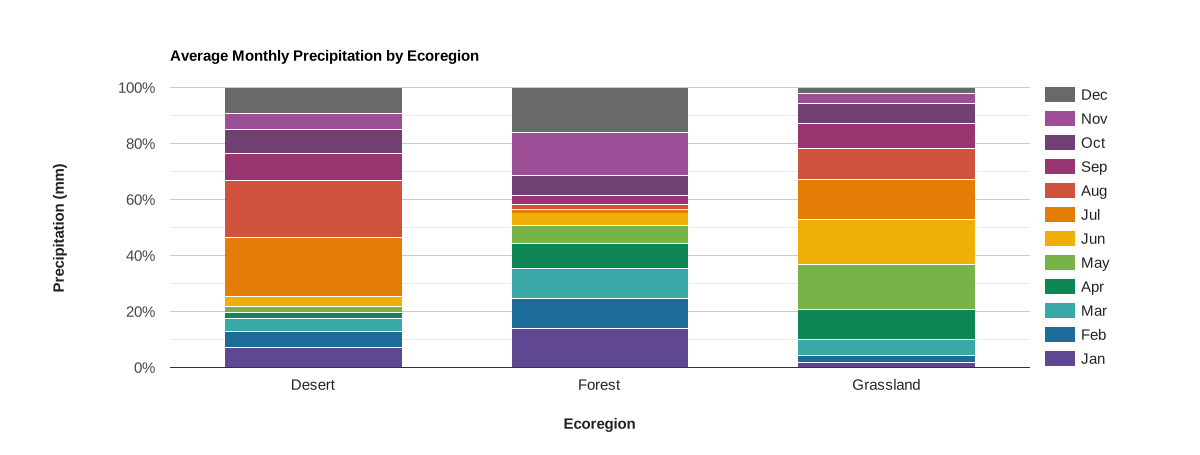
ویژگیها در امتداد محور x رسم میشوند و با مقادیر یک ویژگی انتخابشده برچسبگذاری میشوند. مجموعهها با ستونهای پشتهای نشان داده میشوند که با فهرستی از نامهای دارایی تعریف شدهاند که مقادیر آنها در امتداد محور y بهعنوان درصدی از مجموع مجموعه رسم میشوند.
ویرایشگر کد (جاوا اسکریپت)
// Import the example feature collection.
var ecoregions = ee.FeatureCollection('projects/google/charts_feature_example');

// Define the chart and print it to the console.
var chart =
    ui.Chart.feature
        .byFeature({
          features: ecoregions.select('[0-9][0-9]_ppt|label'),
          xProperty: 'label'
        })
        .setSeriesNames([
          'Jan', 'Feb', 'Mar', 'Apr', 'May', 'Jun', 'Jul', 'Aug', 'Sep', 'Oct',
          'Nov', 'Dec'
        ])
        .setChartType('ColumnChart')
        .setOptions({
          title: 'Average Monthly Precipitation by Ecoregion',
          hAxis:
              {title: 'Ecoregion', titleTextStyle: {italic: false, bold: true}},
          vAxis: {
            title: 'Precipitation (mm)',
            titleTextStyle: {italic: false, bold: true}
          },
          colors: [
            '604791', '1d6b99', '39a8a7', '0f8755', '76b349', 'f0af07',
            'e37d05', 'cf513e', '96356f', '724173', '9c4f97', '696969'
          ],
          isStacked: 'percent'
        });
print(chart);
نمودار پراکندگی
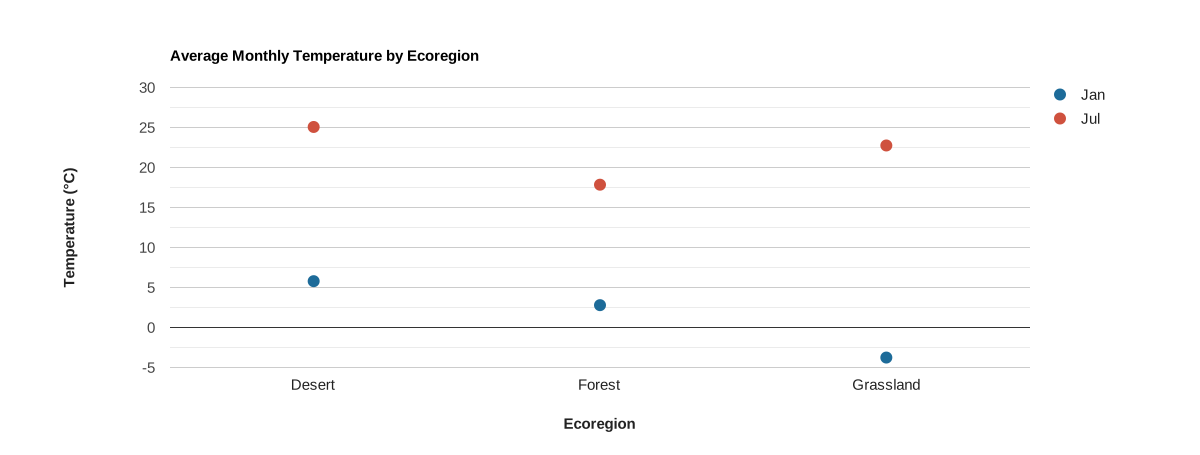
ویژگیها در امتداد محور x رسم میشوند و با مقادیر یک ویژگی انتخابشده برچسبگذاری میشوند. مجموعهها با نقاطی نشان داده میشوند که با فهرستی از نامهای دارایی تعریف شدهاند که مقادیر آنها در امتداد محور y رسم شده است.
ویرایشگر کد (جاوا اسکریپت)
// Import the example feature collection.
var ecoregions = ee.FeatureCollection('projects/google/charts_feature_example');

// Define the chart and print it to the console.
var chart =
    ui.Chart.feature
        .byFeature({
          features: ecoregions,
          xProperty: 'label',
          yProperties: ['01_tmean', '07_tmean']
        })
        .setSeriesNames(['Jan', 'Jul'])
        .setChartType('ScatterChart')
        .setOptions({
          title: 'Average Monthly Temperature by Ecoregion',
          hAxis:
              {title: 'Ecoregion', titleTextStyle: {italic: false, bold: true}},
          vAxis: {
            title: 'Temperature (°C)',
            titleTextStyle: {italic: false, bold: true}
          },
          pointSize: 10,
          colors: ['1d6b99', 'cf513e'],
        });
print(chart);
نمودار ترکیبی
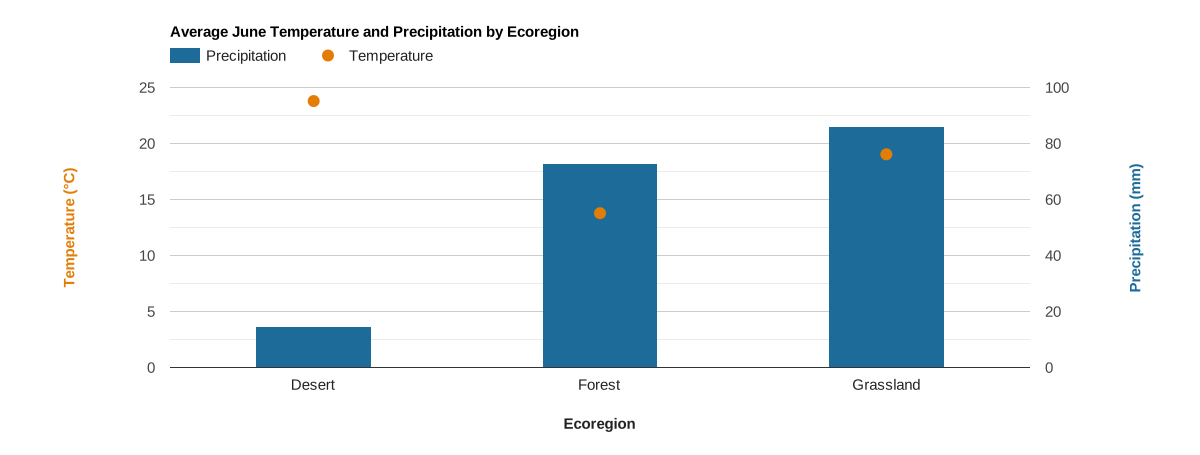
ویژگیها در امتداد محور x رسم میشوند و با مقادیر یک ویژگی انتخابشده برچسبگذاری میشوند. مجموعهها با نقاط و ستونهایی نشان داده میشوند که با فهرستی از نامهای دارایی تعریف شدهاند که مقادیر آنها در امتداد محور y رسم شدهاند. این نمودار بااستفاده از دو محور و سبکبندی خاص سری بهدست آمده است.
ویرایشگر کد (جاوا اسکریپت)
// Import the example feature collection.
var ecoregions = ee.FeatureCollection('projects/google/charts_feature_example');

// Define the chart and print it to the console.
var chart =
    ui.Chart.feature
        .byFeature({
          features: ecoregions,
          xProperty: 'label',
          yProperties: ['06_ppt', '06_tmean']
        })
        .setSeriesNames(['Precipitation', 'Temperature'])
        .setChartType('ColumnChart')
        .setOptions({
          title: 'Average June Temperature and Precipitation by Ecoregion',
          series: {
            0: {targetAxisIndex: 1, type: 'bar', color: '1d6b99'},
            1: {
              targetAxisIndex: 0,
              type: 'line',
              lineWidth: 0,
              pointSize: 10,
              color: 'e37d05'
            }
          },
          hAxis:
              {title: 'Ecoregion', titleTextStyle: {italic: false, bold: true}},
          vAxes: {
            0: {
              title: 'Temperature (°C)',
              baseline: 0,
              titleTextStyle: {italic: false, bold: true, color: 'e37d05'}
            },
            1: {
              title: 'Precipitation (mm)',
              titleTextStyle: {italic: false, bold: true, color: '1d6b99'}
            },
          },
          bar: {groupWidth: '40%'},
        });
print(chart);
ui.Chart.feature.byProperty
راهاندازی نمونه
تابع ui.Chart.feature.byProperty واژهنامهای را میپذیرد که به شما امکان میدهد با اختصاص دادن مقادیر عددی به نامهای ویژگی، برچسب و ترتیب آنها را در امتداد محور x کنترل کنید. نمودارهای شبکه دکارتی زیر از این گزینه برای تنظیم برچسبهای ماه و مرتبسازی نام ماهها به ترتیب زمانی برای میانگین بارش ماهانه استفاده میکنند.
نمودار ستونی
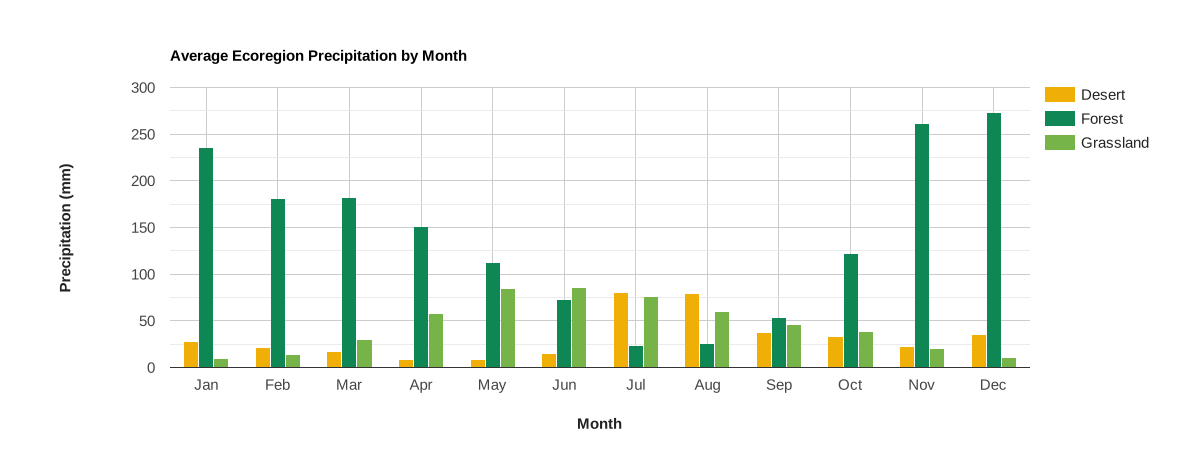
ویژگیهای عارضه در امتداد محور x رسم میشوند، برچسبگذاری میشوند، و براساس ورودی واژهنامه مرتب میشوند؛ مقادیر ویژگیهای دادهشده در امتداد محور y رسم میشوند. مجموعهها ویژگیهایی هستند که با ستونها نشان داده میشوند و با مقادیر یک خصوصیت انتخابشده برچسبگذاری میشوند. برای تبدیل به نمودار میلهای، از
.setChartType('BarChart') استفاده کنید.
ویرایشگر کد (جاوا اسکریپت)
// Import the example feature collection.
var ecoregions = ee.FeatureCollection('projects/google/charts_feature_example');

// Define a dictionary that associates property names with values and labels.
var precipInfo = {
  '01_ppt': {v: 1, f: 'Jan'},
  '02_ppt': {v: 2, f: 'Feb'},
  '03_ppt': {v: 3, f: 'Mar'},
  '04_ppt': {v: 4, f: 'Apr'},
  '05_ppt': {v: 5, f: 'May'},
  '06_ppt': {v: 6, f: 'Jun'},
  '07_ppt': {v: 7, f: 'Jul'},
  '08_ppt': {v: 8, f: 'Aug'},
  '09_ppt': {v: 9, f: 'Sep'},
  '10_ppt': {v: 10, f: 'Oct'},
  '11_ppt': {v: 11, f: 'Nov'},
  '12_ppt': {v: 12, f: 'Dec'}
};

// Organize property information into objects for defining x properties and
// their tick labels.
var xPropValDict = {};  // Dictionary to codify x-axis property names as values.
var xPropLabels = [];   // Holds dictionaries that label codified x-axis values.
for (var key in precipInfo) {
  xPropValDict[key] = precipInfo[key].v;
  xPropLabels.push(precipInfo[key]);
}

// Define the chart and print it to the console.
var chart = ui.Chart.feature
                .byProperty({
                  features: ecoregions,
                  xProperties: xPropValDict,
                  seriesProperty: 'label'
                })
                .setChartType('ColumnChart')
                .setOptions({
                  title: 'Average Ecoregion Precipitation by Month',
                  hAxis: {
                    title: 'Month',
                    titleTextStyle: {italic: false, bold: true},
                    ticks: xPropLabels
                  },
                  vAxis: {
                    title: 'Precipitation (mm)',
                    titleTextStyle: {italic: false, bold: true}
                  },
                  colors: ['f0af07', '0f8755', '76b349'],
                });
print(chart);
نمودار خطی
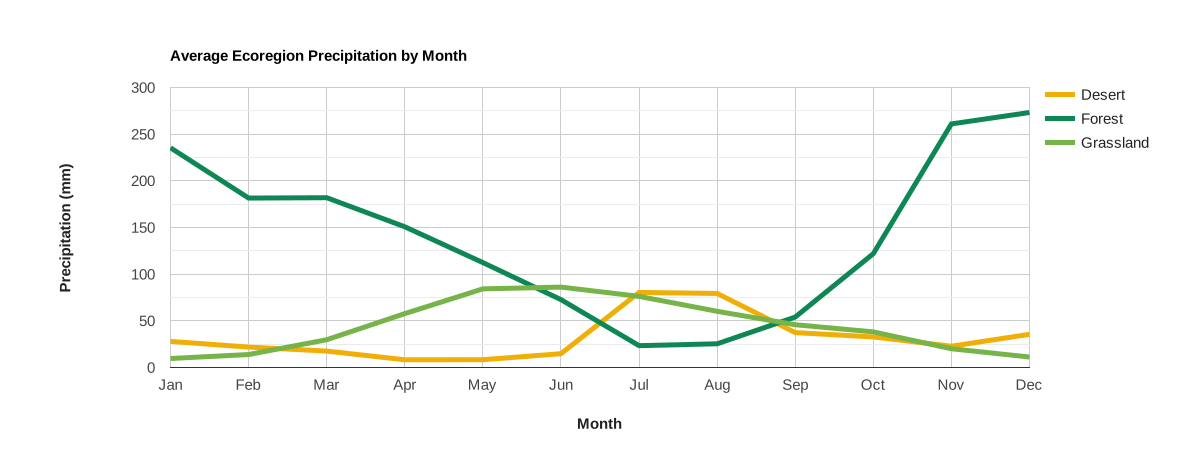
ویژگیهای عارضه در امتداد محور x رسم میشوند، برچسبگذاری میشوند، و براساس ورودی واژهنامه مرتب میشوند؛ مقادیر ویژگیهای دادهشده در امتداد محور y رسم میشوند. مجموعهها ویژگیهایی هستند که با خطوط نشان داده میشوند و با مقادیر یک ویژگی انتخابشده برچسبگذاری میشوند.
ویرایشگر کد (جاوا اسکریپت)
// Import the example feature collection.
var ecoregions = ee.FeatureCollection('projects/google/charts_feature_example');

// Define a dictionary that associates property names with values and labels.
var precipInfo = {
  '01_ppt': {v: 1, f: 'Jan'},
  '02_ppt': {v: 2, f: 'Feb'},
  '03_ppt': {v: 3, f: 'Mar'},
  '04_ppt': {v: 4, f: 'Apr'},
  '05_ppt': {v: 5, f: 'May'},
  '06_ppt': {v: 6, f: 'Jun'},
  '07_ppt': {v: 7, f: 'Jul'},
  '08_ppt': {v: 8, f: 'Aug'},
  '09_ppt': {v: 9, f: 'Sep'},
  '10_ppt': {v: 10, f: 'Oct'},
  '11_ppt': {v: 11, f: 'Nov'},
  '12_ppt': {v: 12, f: 'Dec'}
};

// Organize property information into objects for defining x properties and
// their tick labels.
var xPropValDict = {};  // Dictionary to codify x-axis property names as values.
var xPropLabels = [];   // Holds dictionaries that label codified x-axis values.
for (var key in precipInfo) {
  xPropValDict[key] = precipInfo[key].v;
  xPropLabels.push(precipInfo[key]);
}

// Define the chart and print it to the console.
var chart = ui.Chart.feature
                .byProperty({
                  features: ecoregions,
                  xProperties: xPropValDict,
                  seriesProperty: 'label'
                })
                .setChartType('ScatterChart')
                .setOptions({
                  title: 'Average Ecoregion Precipitation by Month',
                  hAxis: {
                    title: 'Month',
                    titleTextStyle: {italic: false, bold: true},
                    ticks: xPropLabels
                  },
                  vAxis: {
                    title: 'Precipitation (mm)',
                    titleTextStyle: {italic: false, bold: true}
                  },
                  colors: ['f0af07', '0f8755', '76b349'],
                  lineSize: 5,
                  pointSize: 0
                });
print(chart);
نمودار مساحتی
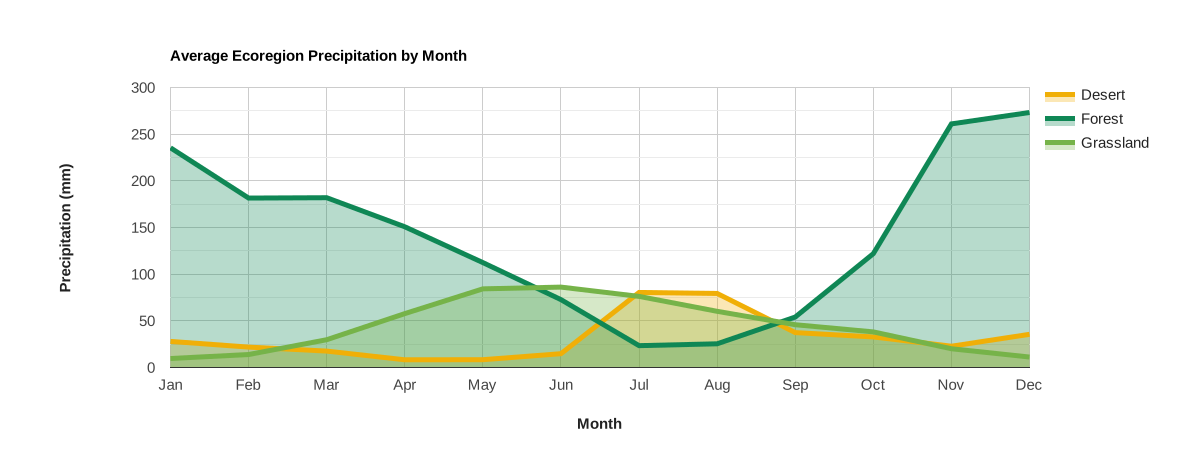
ویژگیهای عارضه در امتداد محور x رسم میشوند، برچسبگذاری میشوند، و براساس ورودی واژهنامه مرتب میشوند؛ مقادیر ویژگیهای دادهشده در امتداد محور y رسم میشوند. مجموعهها ویژگیهایی هستند که با خطوط و نواحی سایهدار نشان داده میشوند و با مقادیر یک خصوصیت انتخابشده برچسبگذاری میشوند.
ویرایشگر کد (جاوا اسکریپت)
// Import the example feature collection.
var ecoregions = ee.FeatureCollection('projects/google/charts_feature_example');

// Define a dictionary that associates property names with values and labels.
var precipInfo = {
  '01_ppt': {v: 1, f: 'Jan'},
  '02_ppt': {v: 2, f: 'Feb'},
  '03_ppt': {v: 3, f: 'Mar'},
  '04_ppt': {v: 4, f: 'Apr'},
  '05_ppt': {v: 5, f: 'May'},
  '06_ppt': {v: 6, f: 'Jun'},
  '07_ppt': {v: 7, f: 'Jul'},
  '08_ppt': {v: 8, f: 'Aug'},
  '09_ppt': {v: 9, f: 'Sep'},
  '10_ppt': {v: 10, f: 'Oct'},
  '11_ppt': {v: 11, f: 'Nov'},
  '12_ppt': {v: 12, f: 'Dec'}
};

// Organize property information into objects for defining x properties and
// their tick labels.
var xPropValDict = {};  // Dictionary to codify x-axis property names as values.
var xPropLabels = [];   // Holds dictionaries that label codified x-axis values.
for (var key in precipInfo) {
  xPropValDict[key] = precipInfo[key].v;
  xPropLabels.push(precipInfo[key]);
}

// Define the chart and print it to the console.
var chart = ui.Chart.feature
                .byProperty({
                  features: ecoregions,
                  xProperties: xPropValDict,
                  seriesProperty: 'label'
                })
                .setChartType('AreaChart')
                .setOptions({
                  title: 'Average Ecoregion Precipitation by Month',
                  hAxis: {
                    title: 'Month',
                    titleTextStyle: {italic: false, bold: true},
                    ticks: xPropLabels
                  },
                  vAxis: {
                    title: 'Precipitation (mm)',
                    titleTextStyle: {italic: false, bold: true}
                  },
                  colors: ['f0af07', '0f8755', '76b349'],
                  lineSize: 5,
                  pointSize: 0,
                  curveType: 'function'
                });
print(chart);
نمودار دایرهای
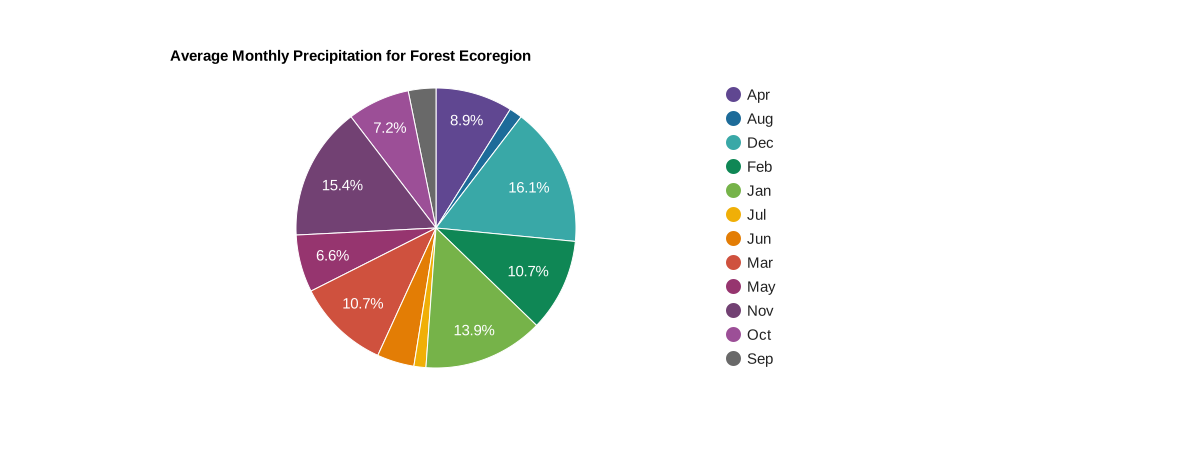
نمودار دایرهای یک ویژگی است، هر برش یک برچسب ویژگی است که مقدار آن بهصورت درصدی از مجموع همه مقادیر ویژگیهای تشکیلدهنده نمودار دایرهای نشان داده میشود.
ویرایشگر کد (جاوا اسکریپت)
// Import the example feature collection.
var ecoregions = ee.FeatureCollection('projects/google/charts_feature_example');

// Subset the forest ecoregion feature and select the monthly precipitation
// properties, rename them as abbreviated months.
var thisForest = ecoregions.filter(ee.Filter.eq('label', 'Forest'))
                     .select(Object.keys(precipInfo), [
                       'Jan', 'Feb', 'Mar', 'Apr', 'May', 'Jun', 'Jul', 'Aug',
                       'Sep', 'Oct', 'Nov', 'Dec'
                     ]);

// Define the chart and print it to the console.
var chart = ui.Chart.feature
                .byProperty({
                  features: thisForest,
                  xProperties: [
                    'Jan', 'Feb', 'Mar', 'Apr', 'May', 'Jun', 'Jul', 'Aug',
                    'Sep', 'Oct', 'Nov', 'Dec'
                  ]
                })
                .setChartType('PieChart')
                .setOptions({
                  title: 'Average Monthly Precipitation for Forest Ecoregion',
                  colors: [
                    '604791', '1d6b99', '39a8a7', '0f8755', '76b349', 'f0af07',
                    'e37d05', 'cf513e', '96356f', '724173', '9c4f97', '696969'
                  ]
                });
print(chart);
نمودار دونات
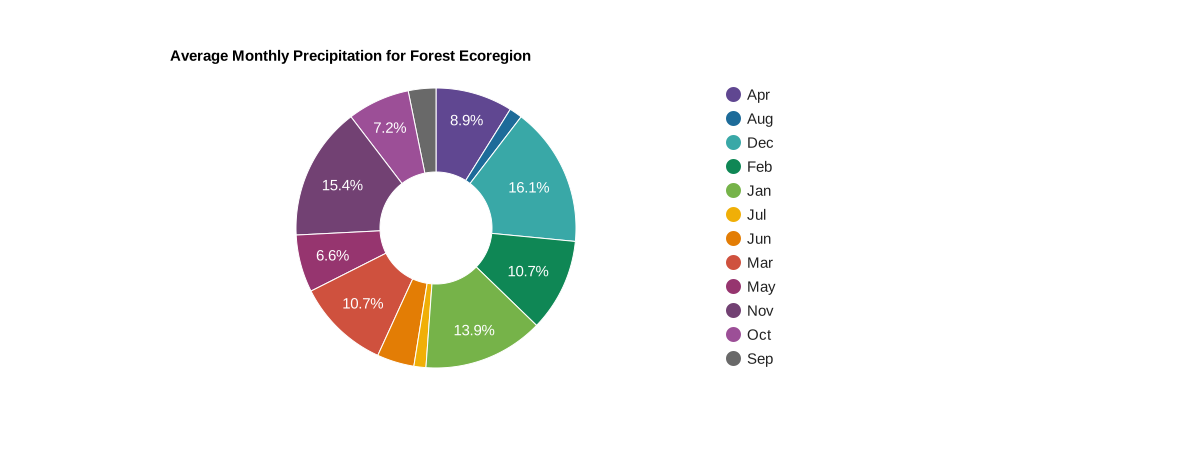
با تنظیم گزینه نمودار
pieHole
نمودار دایرهای را به نمودار دوناتی تبدیل کنید؛ اعداد بین ۰٫۴ و ۰٫۶ در اکثر نمودارها بهترین ظاهر را خواهند داشت.
ویرایشگر کد (جاوا اسکریپت)
// Import the example feature collection.
var ecoregions = ee.FeatureCollection('projects/google/charts_feature_example');

// Subset the forest ecoregion feature and select the monthly precipitation
// properties, rename them as abbreviated months.
var thisForest = ecoregions.filter(ee.Filter.eq('label', 'Forest'))
                     .select(Object.keys(precipInfo), [
                       'Jan', 'Feb', 'Mar', 'Apr', 'May', 'Jun', 'Jul', 'Aug',
                       'Sep', 'Oct', 'Nov', 'Dec'
                     ]);

// Define the chart and print it to the console.
var chart = ui.Chart.feature
                .byProperty({
                  features: thisForest,
                  xProperties: [
                    'Jan', 'Feb', 'Mar', 'Apr', 'May', 'Jun', 'Jul', 'Aug',
                    'Sep', 'Oct', 'Nov', 'Dec'
                  ]
                })
                .setChartType('PieChart')
                .setOptions({
                  title: 'Average Monthly Precipitation for Forest Ecoregion',
                  colors: [
                    '604791', '1d6b99', '39a8a7', '0f8755', '76b349', 'f0af07',
                    'e37d05', 'cf513e', '96356f', '724173', '9c4f97', '696969'
                  ],
                  pieHole: 0.4,
                });
print(chart);
ui.Chart.feature.groups
نمودار ستونی
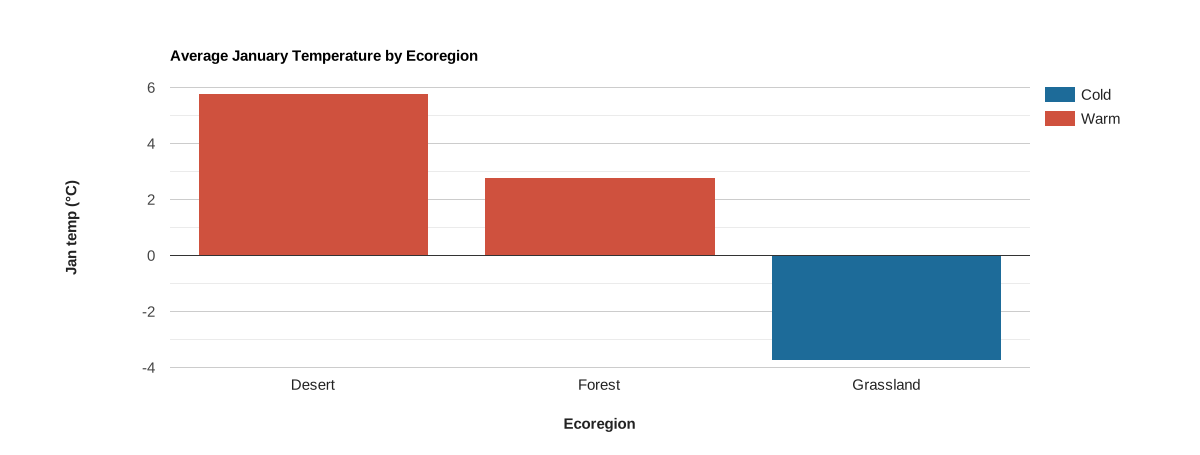
ویژگیها در امتداد محور x رسم میشوند و با مقادیر یک ویژگی انتخابشده برچسبگذاری میشوند.
مجموعهها با ستونهایی نشان داده میشوند که با مجموعهای از مقادیر یکتای یک ویژگی معین تعریف شدهاند. موقعیت محور Y با مقدار مشخصه دادهشده تعریف میشود. با تنظیم نوع نمودار روی 'ScatterChart' (.setChartType('ScatterChart'))، میتوان این نمودار را به نمودار پراکندگی تغییر داد. همچنین، اگر متغیر محور افقی زمان باشد، شاید ترجیح دهید از نمودار خطی استفاده کنید: .setChartType('LineChart').
ویرایشگر کد (جاوا اسکریپت)
// Import the example feature collection.
var ecoregions = ee.FeatureCollection('projects/google/charts_feature_example');

// Define the chart and print it to the console.
var chart =
    ui.Chart.feature
        .groups({
          features: ecoregions,
          xProperty: 'label',
          yProperty: '01_tmean',
          seriesProperty: 'warm'
        })
        .setSeriesNames(['Warm', 'Cold'])
        .setChartType('ColumnChart')
        .setOptions({
          title: 'Average January Temperature by Ecoregion',
          hAxis:
              {title: 'Ecoregion', titleTextStyle: {italic: false, bold: true}},
          vAxis: {
            title: 'Jan temp (°C)',
            titleTextStyle: {italic: false, bold: true}
          },
          bar: {groupWidth: '80%'},
          colors: ['cf513e', '1d6b99'],
          isStacked: true
        });
print(chart);
ui.Chart.feature.histogram
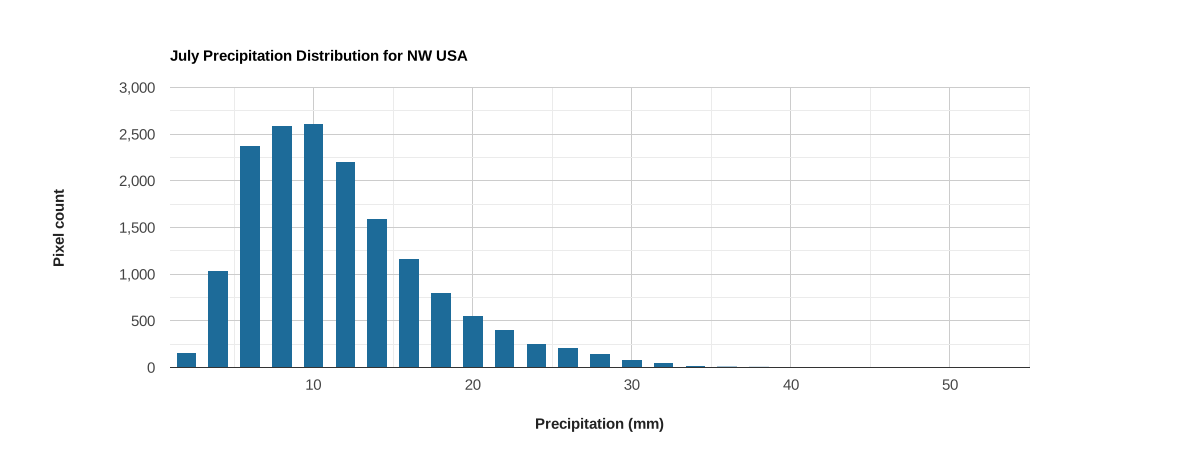
محور x با دستههای مقدار برای محدوده مقادیر یک ویژگی انتخابشده تعریف میشود؛ محور y تعداد عناصر در دسته دادهشده است.
ویرایشگر کد (جاوا اسکریپت)
// Load PRISM climate normals image collection; convert images to bands.
var normClim = ee.ImageCollection('OREGONSTATE/PRISM/Norm91m').toBands();

// Make a point sample of climate variables for a region in western USA.
var region = ee.Geometry.Rectangle(-123.41, 40.43, -116.38, 45.14);
var climSamp = normClim.sample(region, 5000);

// Define the chart and print it to the console.
var chart =
    ui.Chart.feature
        .histogram({features: climSamp, property: '07_ppt', maxBuckets: 30})
        .setOptions({
          title: 'July Precipitation Distribution for NW USA',
          hAxis: {
            title: 'Precipitation (mm)',
            titleTextStyle: {italic: false, bold: true}
          },
          vAxis: {
            title: 'Pixel count',
            titleTextStyle: {italic: false, bold: true}
          },
          colors: ['1d6b99'],
          legend: {position: 'none'}
        });
print(chart);