
In this codelab, you'll learn how to use Google Analytics and the User Timings API to measure the real-world performance of your website or application and optimize it to improve the experience for your users.
Tools like WebPagetest.org are a great start for performance optimizations, but the true test of site performance is always going to be real data from actual users.
If you run a website, there's a good chance you're already using Google Analytics to measure traffic as well as things like device and browser usage. With just a little extra code you can add performance metrics into the mix.
What you'll learn
- How to accurately and effectively measure performance metrics using the User Timings API
- How to send that data to Google Analytics so it can be incorporated into your reports
What you'll need
- A browser with a developer console
- Web Server for Chrome, or use your own web server of choice
- The sample code
- A text editor
- (Optional) a Google Analytics account
How will you use this tutorial?
How would rate your experience with building web sites or applications?
You can either download all the sample code to your computer...
...or clone the GitHub repository from the command line.
git clone https://github.com/googlecodelabs/performance-analytics.git
The sample code is divided into subdirectories that correspond to each of the numbered steps in this code lab. You can use this to easily skip around in the code lab or verify that your implementation is correct.
If you have access to a diffing program, you can use it to see exactly what's changed from step to step.
In this code lab, you're going to take a single HTML file that loads the following assets:
- Web fonts
- Stylesheets
- Images
- JavaScript
And you're going to write new code that measures the key performance metrics for each of these assets types.
Asset performance considerations
If you've ever read anything about performance optimization, you probably already know that each of these assets types have their own various quirks and can affect the overall perceived performance in various ways.
CSS
For example, stylesheets block the rendering of all elements in the DOM that come after them, which means the browser has to make a request for the stylesheet, download it, and parse it before it can render any of the content in the DOM that comes after it. For this reason, it's usually best to place stylesheets in the <head> of the document. And because of the blocking nature of CSS, it's also often recommended to only place your critical CSS in the <head> and load the non-critical CSS asynchronously afterward.
JavaScript
JavaScript, on the other hand, does not block rendering, but it does block parsing and construction of the DOM. This is necessary because JavaScript can modify the DOM, which means any time the browser sees a <script> tag (excluding async scripts), it must execute the code before continuing on to the next tag. If the <script> tag references an external JavaScript file, it must download and execute the code before moving on.
For this reason it's often recommended that your JavaScript be loaded right before the closing </body> tag, so the majority of the DOM is available as quickly as possible.
Web fonts
If you load web fonts, you might also opts to block rendering of the document until the font is available to be used. In this case, it's critical to understand how long this actually takes for your users. A web font may load quickly for you but very slowly for the majority of people who visit your site. This is why measurement and making decisions on real data is so important.
Images
Lastly, images can really make a site come alive, but they can also often take the longest to load. Understanding what this actually means and being able to spot any correlations between usage patterns and page load times is critical for understanding how to optimize.
The first step in this code lab is to see what the demo page looks like before adding any performance measurement code.
To view the demo, create a new folder and add a file inside it called index.html. Then copy and paste the code below into the index.html file.
<!DOCTYPE html>
<html lang="en">
<head>
  <meta charset="utf-8">
  <meta http-equiv="X-UA-Compatible" content="IE=edge">
  <meta name="viewport" content="width=device-width, initial-scale=1">
  <title>Performance Analytics Demo</title>

  <!-- Start fonts -->
  <link href="https://fonts.googleapis.com/css?family=Roboto:400,700,400italic" rel="stylesheet">
  <!-- End fonts -->

  <!-- Start CSS -->
  <link href="https://maxcdn.bootstrapcdn.com/bootstrap/3.3.6/css/bootstrap.min.css" rel="stylesheet">
  <style>
    body { font-family: Roboto, sans-serif; margin: 1em; }
    img { float: left; height: auto; width: 33.33%; }
    .gallery { overflow: hidden; }
  </style>
  <!-- End CSS -->

</head>
<body>

  <div class="container">

    <!-- Start images -->
    <div class="gallery">
      <img src="http://lorempixel.com/380/200/animals/1/">
      <img src="http://lorempixel.com/380/200/animals/2/">
      <img src="http://lorempixel.com/380/200/animals/3/">
    </div>
    <!-- End images -->

    <h1>Performance Analytics Demo</h1>
    <p>Real performance data from real users.</p>

  </div>

  <!-- Start JavaScript -->
  <script src="https://ajax.googleapis.com/ajax/libs/jquery/1.11.3/jquery.min.js"></script>
  <script src="https://maxcdn.bootstrapcdn.com/bootstrap/3.3.6/js/bootstrap.min.js"></script>
  <!-- End JavaScript -->

</body>
</html>
Next, open Web Server for Chrome and start a local server in the directory you just created. Make sure to have the "automatically show index.html" checked.

You should now be able to navigate to http://127.0.0.1:8887/ in your browser and see the demo file. It should look something like this:

Once you have the demo page running, take a moment to look at the code and see all the various asset types being loaded. In the next few steps, you'll be adding code to measure when these assets are loaded and can be interacted with by the user.
As mentioned in the asset performance considerations section earlier, CSS blocks the rendering of DOM elements as well as the execution of scripts that come after it in the DOM.
The demo file you just created contains the following CSS, which references Bootstrap and a few inline styles.
<!-- Start CSS -->
<link href="https://maxcdn.bootstrapcdn.com/bootstrap/3.3.6/css/bootstrap.min.css" rel="stylesheet">
<style>
  body { font-family: Roboto, sans-serif; margin: 1em; }
  img { float: left; height: auto; width: 33.33%; }
  .gallery { overflow: hidden; }
</style>
<!-- End CSS -->
Since CSS blocks both rendering of DOM elements and execution of scripts, it's possible to determine when the CSS is done blocking by adding a <script> tag immediately following the CSS that stores the current time.
You could do that by creating a variable and assigning new Date() to it, but thanks to the User Timings API, there's a much easier way: the performance.mark method.
To mark when the CSS is done blocking both rendering and script execution, add the following line of code immediately before the closing <!-- End CSS --> comment.
<script>performance.mark('css:unblock');</script>The performance.mark method creates a high resolution timestamp at this exact point in time, and associates it with whatever name was passed to the method. In this case you named the mark "css:unblock".
The performance.mark method goes hand and hand with the performance.measure method, which is used to calculate the time difference between two marks (in addition to the marks you make, you can also use the marks the browser automatically makes for the various points in the Navigation Timing API).
The following utility function measures and returns the time duration between a mark you've added and the responseEnd mark created by the Navigation Timing API.
function measureDuration(mark, opt_reference) {
  var reference = opt_reference || 'responseEnd';
  var name = reference + ':' + mark;

  // Clears any existing measurements with the same name.
  performance.clearMeasures(name);

  // Creates a new measurement from the reference point to the specified mark.
  // If more than one mark with this name exists, the most recent one is used.
  performance.measure(name, reference, mark);

  // Gets the value of the measurement just created.
  var measure = performance.getEntriesByName(name)[0];

  // Returns the measure duration.
  return measure.duration;
}To start using this utility function, create a new file named perf-analytics.js (in the same directory as the index.html file) and copy and paste the above code into it.
Now that this function is defined, you can call it and pass in the "css:unblock" mark name. To not interfere with any other resource loading, you should defer running these measurements until after the window's load event fires.
Once you've written a function to call this code, your perf-analytics.js file should look something like this:
window.onload = function() {
  measureCssUnblockTime();
};


/**
 * Calculates the time duration between the responseEnd timing event and when
 * the CSS stops blocking rendering, then logs that value to the console.
 */
function measureCssUnblockTime() {
  console.log('CSS', 'unblock', measureDuration('css:unblock'));
}


/**
 * Accepts a mark name and an optional reference point in the navigation timing
 * API and returns the time duration between the reference point and the last
 * mark (chronologically).
 * @param {string} mark The mark name.
 * @param {string=} opt_reference An optional reference point from the
 *     navigation timing API. Defaults to 'responseEnd'.
 * @return {number} The time duration
 */
function measureDuration(mark, opt_reference) {
  var reference = opt_reference || 'responseEnd';
  var name = reference + ':' + mark;

  // Clears any existing measurements with the same name.
  performance.clearMeasures(name);

  // Creates a new measurement from the reference point to the specified mark.
  // If more than one mark with this name exists, the most recent one is used.
  performance.measure(name, reference, mark);

  // Gets the value of the measurement just created.
  var measure = performance.getEntriesByName(name)[0];

  // Returns the measure duration.
  return measure.duration;
}
Lastly, you'll need to load the perf-analytics.js script from index.html. To do so, add the following script tag to your main document. Make sure to add it last so it doesn't interfere with loading other resources.
<!-- Start performance analytics -->
<script async src="perf-analytics.js"></script>
<!-- End performance analytics -->
Once you've completed this step, your code should match what's in the 01-css directory of the code lab repository.
If you load the page in a browser and open up the developer console, you should see something like the following output:

Web fonts are usually loaded via an external stylesheet, as seen in the initial demo file:
<!-- Start fonts -->
<link href="https://fonts.googleapis.com/css?family=Roboto:400,700,400italic" rel="stylesheet">
<!-- End fonts -->
Since this is a <link> tag to a CSS file, it might seem like determining when the fonts are loaded and ready to use is as simple as adding a mark inside a <script> tag immediately after the <link>, just like in step 1.
Unfortunately, it's not this simple.
Stylesheets block the execution of JavaScript because the contents of stylesheets are used to construct the CSSOM, and since it's possible that the JavaScript being loaded will need to access the CSSOM, execution must be delayed until the CSSOM is fully constructed.
The catch is that the browser can construct the CSSOM without actually downloading the font, which means that if you add a mark via an inline script tag to the DOM immediately after the font's stylesheet <link> tag, chances are the mark will happen before the font is fully loaded.
Until font load events become available in browsers, JavaScript is needed to determine when a font is truly active and ready for use on the page. Fortunately, loading fonts via JavaScript happens to also be a performance win, since it doesn't require an additional blocking request to a CSS file.
Most web fonts (including Google fonts, typekit, and font.com fonts) can be loaded via the webfont.js script, which was co-developed by Google and Typekit.
To update the main document to use webfont.js to load the fonts (rather than the <link> tag), replace the fonts section of the code with the following:
<!-- Start fonts -->
<script>
window.WebFontConfig = {
  google: {families: ['Roboto:400,700,400italic']},
  timeout: 10000,
  active: function() {
    performance.mark('fonts:active');
  }
};
</script>
<script async src="https://ajax.googleapis.com/ajax/libs/webfont/1/webfont.js"></script>
<!-- End fonts -->
There are two important things to notice about the code above:
- It creates a "fonts:active" mark in the active callback, so you can later measure how long it took the fonts to load.
- The
<script>tag that loads webfonts.js contains theasyncattribute, so it won't block parsing or rendering of the rest of the document (which is not true for<link>tags).
While the above codes does create a "fonts:active" mark, measuring this mark and logging it to the console is not as simple as it was for the "css:unblock" mark. The reason is that the font loading now happens asynchronously, so if you try to measure the "fonts:active" mark in the window.onload handler (as you did with "css:unblock"), it's very possible the font won't be loaded yet.
To solve this problem, you can create a promise that is resolved once the font is loaded. The following function does this for you. Copy and paste it into the perf-analytics.js file:
/**
 * Creates a promise that is resolved once the web fonts are fully load or
 * is reject if the fonts fail to load. The resolved callback calculates the
 * time duration between the responseEnd timing event and when the web fonts
 * are downloaded and active. If an error occurs loading the font, this fact
 * is logged to the console.
 */
function measureWebfontPerfAndFailures() {
  new Promise(function(resolve, reject) {
    // The classes `wf-active` or `wf-inactive` are added to the <html>
    // element once the fonts are loaded (or error).
    var loaded = /wf-(in)?active/.exec(document.documentElement.className);
    var success = loaded && !loaded[1]; // No "in" in the capture group.
    // If the fonts are already done loading, resolve immediately.
    // Otherwise resolve/reject in the active/inactive callbacks, respectively.
    if (loaded) {
      success ? resolve() : reject();
    }
    else {
      var originalAciveCallback = WebFontConfig.active;
      WebFontConfig.inactive = reject;
      WebFontConfig.active = function() {
        originalAciveCallback();
        resolve();
      };
      // In case the webfont.js script fails to load, always reject the
      // promise after the timeout amount.
      setTimeout(reject, WebFontConfig.timeout);
    }
  })
  .then(function() {
    console.log('Fonts', 'active', measureDuration('fonts:active'));
  })
  .catch(function() {
    console.error('Error loading web fonts')
  });
}
Also update the window.onload handler to call this new function
window.onload = function() {
  measureCssUnblockTime();
  measureWebfontPerfAndFailures();
};
Once you've completed this step, your code should match what's in the 02-fonts directory of the code lab repository.
If you load the page in a browser and open up the developer console, you should see something like the following output:

Knowing when an image is visible is not as simple as it might appear. You know from previous steps that stylesheets and synchronous <script> tags can block rendering, parsing, and script execution. What you may not know is that neither of them block the browser's preload scanner.
A preload scanner is something all modern browser implement as one of many attempts to improve performance, even on non-perf-minded sites that contain a lot of blocking assets. The idea is that while some assets may block parsing or rendering or script execution, they don't have to block downloads. So the browser scans the HTML file before it starts constructing the DOM and looks for assets it can start to download immediately.
As far as images are concerned, this means that there's a decent chance your images may already be downloaded by the time they're added to the DOM. This also means that the point at which an image is downloaded in not necessarily a good performance metric. The performance metric you should care about is the point at which an image is visible to the user.
When an image is downloaded prior to being added to the DOM, the point at which it becomes visible is the point when at which it's in the DOM. On the other hand, if an image is not downloaded prior to being added to the DOM, the point at which it becomes visible is when its onload handler fires.
So, in order to know when an image is visible, you have to handle both cases.
You can do this by adding marks in each image's onload handler as well as in an inline <script> tag immediately after the last image in the DOM. The idea is that the mark that occurs last will be the mark that represents when all images are visible.
To add marks for both when the images are loaded and when they're rendered, update the images code in index.html as follows:
<!-- Start images -->
<div class="gallery">
  <img onload="performance.mark('img:visible')" src="http://lorempixel.com/380/200/animals/1/">
  <img onload="performance.mark('img:visible')" src="http://lorempixel.com/380/200/animals/2/">
  <img onload="performance.mark('img:visible')" src="http://lorempixel.com/380/200/animals/3/">
</div>
<script>performance.mark('img:visible')</script>
<!-- End images -->
Since the performance.measure method for a particular mark name will always use the last mark (if it finds multiple marks with the same name), the measureDuration utility function in the perf-analytics.js file can be used for this without any additional modifications:
/**
 * Calculates the time duration between the responseEnd timing event and when
 * all images are loaded and visible on the page, then logs that value to the
 * console.
 */
function measureImagesVisibleTime() {
  console.log('Images', 'visible', measureDuration('img:visible'));
}
Add the above function to the perf-analytics.js file, and then update the window.onload handler to call it:
window.onload = function() {
  measureCssBlockTime();
  measureWebfontPerfAndFailures();
  measureImagesVisibleTime();
};
Once you've completed this step, your code should match what's in the 03-images directory of the code lab repository.
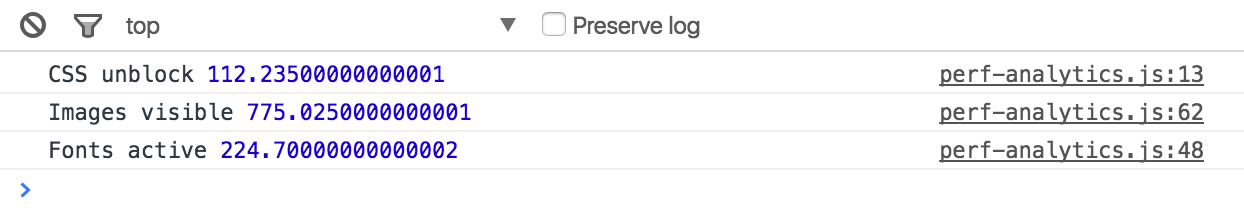
If you load the page in a browser and open up the developer console, you should see something like the following output:
Since <script> tags without the async attribute block DOM parsing until they've been both downloaded and executed, you can determine the point at which all scripts have finished executing by adding a mark in an inline script tag immediately after the last synchronous <script> in the DOM.
Note that using onload handlers won't work in this case since the browser must execute the script after it loads it, and that takes time. A script that is fast to load but slow to execute can be just as bad as a slow loading script.
To track when all JavaScript is loaded and executed in the main document, update the JavaScript section in index.html with the follows code:
<!-- Start JavaScript -->
<script src="https://ajax.googleapis.com/ajax/libs/jquery/1.11.3/jquery.min.js"></script>
<script src="https://maxcdn.bootstrapcdn.com/bootstrap/3.3.6/js/bootstrap.min.js"></script>
<script>performance.mark('js:execute');</script>
<!-- End JavaScript -->
This will add a mark named "js:execute" immediately after the scripts for jQuery and Bootstrap's plugins have downloaded and finished executing.
To measure how long this takes, add the following function to perf-analytics.js:
/**
 * Calculates the time duration between the responseEnd timing event and when
 * all synchronous JavaScript files have been downloaded and executed, then
 * logs that value to the console.
 */
function measureJavaSciptExecutionTime() {
  console.log('JavaScript', 'execute', measureDuration('js:execute'));
}
And then invoke it from the window.onload handler:
window.onload = function() {
  measureCssBlockTime();
  measureWebfontPerfAndFailures();
  measureImagesVisibleTime();
  measureJavaSciptExecutionTime();
};
Once you've completed this step, your code should match what's in the 04-javascript directory of the code lab repository.
If you load the page in a browser and open up the developer console, you should see something like the following output:

Not all browsers support JavaScript promises or the User Timing APIs, and if you run the code you've written so far in a browser without support for one of these features, you'll get errors.
To deal with this, you can use feature detection. Add the follow bit of code immediately before the fonts section. This line of JavaScript detects support for the performance.mark method, so it must be added to the page before that method is ever used:
<!-- Start feature detects -->
<script>window.__perf = window.performance && performance.mark;</script>
<!-- End feature detects -->
Next, anywhere in index.html where you call performance.mark, prefix it with the feature detect. Here's an example that updates the code in the image block, but you must make sure to update the other sections as well.
<!-- Start images -->
<div class="gallery">
  <img onload="__perf && performance.mark('img:visible')" src="http://lorempixel.com/380/200/animals/1/">
  <img onload="__perf && performance.mark('img:visible')" src="http://lorempixel.com/380/200/animals/2/">
  <img onload="__perf && performance.mark('img:visible')" src="http://lorempixel.com/380/200/animals/3/">
</div>
<script>__perf && performance.mark('img:visible')</script>
<!-- End images -->
Now that the __perf variable is set on window, you can also use it in perf-analytics.js to ensure you don't call a method that's not supported in the current browser.
The measureDuration function must be updated to add the following conditional:
function measureDuration(mark, opt_reference) {
  if (window.__perf) {
    // ...
  }
}
Lastly, since not all browsers support JavaScript promises, the measureWebfontPerfAndFailures function must also be wrapped in a conditional:
function measureWebfontPerfAndFailures() {
  if (window.Promise) {
    // ...
  }
}
Now you should be able to run your code in any browser without issues.
Once you've completed this step, your code should match what's in the 05-feature-detects directory of the code lab repository.
The final step in this codelab is to take the data that's being logged to the console and instead send it to Google Analytics instead. And before you can send data to Google Analytics, you have to add the analytics.js library and the default tracking snippet to your page.
Add the following code to index.html after the main JavaScript block but before the perf-analytics.js script is loaded:
<!-- Start analytics tracking snippet -->
<script>
window.ga=window.ga||function(){(ga.q=ga.q||[]).push(arguments)};ga.l=+new Date;
ga('create', 'UA-XXXXX-Y', 'auto');
ga('send', 'pageview');
</script>
<script async src="https://www.google-analytics.com/analytics_debug.js"></script>
<!-- End analytics tracking snippet -->
If you've added Google Analytics to a website before, you'll know that you have to replace the "UA-XXXXX-Y" placeholder with the tracking ID you received when creating a new property in Google Analytics.
The analytics.js tracking snippet does four main things:
- Creates an asynchronous
<script>element that downloads the analytics.js JavaScript library. - Initializes a global
ga()function (called the ga() command queue) that allows you to schedule commands to be run once the analytics.js library is loaded and ready to go. - Adds a command to the
ga()command queue to create a new tracker object for the property specified via the'UA-XXXXX-Y' parameter. - Adds another command to the
ga()command queue to send a pageview to Google Analytics for the current page.
While the data collected from pageviews alone is useful, it doesn't tell the whole story. To get a better picture of how users are experiencing your site or application, you have to send additional interaction data to Google Analytics.
Google Analytics supports several types of interaction data: pageviews, events, social interactions, exceptions, and (last but not least) user timings. To send user timing data to Google Analytics, you can use the following command signature:
ga('send', 'timing', timingCategory, timingVar, timingValue);Where timingCategory is a string that allows you to organize timing hits into logical group, timingVar is the variable you're measuring, and timingValue is the actual time duration in milliseconds.
To see how this works in practice, the console.log statement in the measureCssUnblockTime function can be updated as follows:
ga('send', 'timing', 'CSS', 'unblock', measureDuration('css:unblock'));While the above code will work in some situations, there are two important gotchas to be aware of:
- The previous step updated the
measureDurationfunction to only run if the browser supports the User Timings API, which means sometimes it will returnundefined. Since there's no reason to send undefined data to Google Analytics (in some cases it could even mess up your reports), you should only send this timing hit ifmeasureDurationreturns a value. - When
measureDurationdoes return a value, it is aDOMHighResTimeStamp, which will have greater than millisecond precision. SincetimingValuein Google Analytics must be an integer, you must round the value returned bymeasureDuration.
To account for these gotchas, update the return statement in the measureDuration function to round the return value:
function measureDuration(mark, opt_reference) {
  if (window.__perf) {
    // ...
    return Math.round(measure.duration);
  }
}
And update the timing commands to only run if a value exists for the metric in question. As an example, the measureCssUnblockTime function should be updated to something like this:
function measureCssUnblockTime() {
  var cssUnblockTime = measureDuration('css:unblock');
  if (cssUnblockTime) {
    ga('send', 'timing', 'CSS', 'unblock', cssUnblockTime);
  }
}
You'll need to make similar updates to all of the other measurement functions. Once complete, the final perf-analytics.js file should look like this:
window.onload = function() {
  measureCssUnblockTime();
  measureWebfontPerfAndFailures();
  measureImagesVisibleTime();
  measureJavaSciptExecutionTime();
};


/**
 * Calculates the time duration between the responseEnd timing event and when
 * the CSS stops blocking rendering, then sends this measurement to Google
 * Analytics via a timing hit.
 */
function measureCssUnblockTime() {
  var cssUnblockTime = measureDuration('css:unblock');
  if (cssUnblockTime) {
    ga('send', 'timing', 'CSS', 'unblock', cssUnblockTime);
  }
}


/**
 * Calculates the time duration between the responseEnd timing event and when
 * the web fonts are downloaded and active, then sends this measurement to
 * Google Analytics via a timing hit. If an error occurs loading the font, an
 * error event is sent to Google Analytics.
 */
function measureWebfontPerfAndFailures() {
  if (window.Promise) {
    new Promise(function(resolve, reject) {
      var loaded = /wf-(in)?active/.exec(document.documentElement.className);
      var success = loaded && !loaded[1]; // No "in" in the capture group.
      if (loaded) {
        success ? resolve() : reject();
      }
      else {
        var originalAciveCallback = WebFontConfig.active;
        WebFontConfig.inactive = reject;
        WebFontConfig.active = function() {
          originalAciveCallback();
          resolve();
        };
        // In case the webfont.js script failed to load.
        setTimeout(reject, WebFontConfig.timeout);
      }
    })
    .then(function() {
      var fontsActiveTime = measureDuration('fonts:active');
      if (fontsActiveTime) {
        ga('send', 'timing', 'Fonts', 'active', fontsActiveTime);
      }
    })
    .catch(function() {
      ga('send', 'event', 'Fonts', 'error');
    });
  }
}


/**
 * Calculates the time duration between the responseEnd timing event and when
 * all images are loaded and visible on the page, then sends this measurement
 * to Google Analytics via a timing hit.
 */
function measureImagesVisibleTime() {
  var imgVisibleTime = measureDuration('img:visible');
  if (imgVisibleTime) {
    ga('send', 'timing', 'Images', 'visible', imgVisibleTime);
  }
}


/**
 * Calculates the time duration between the responseEnd timing event and when
 * all synchronous JavaScript files are downloaded and executed, then sends
 * this measurement to Google Analytics via a timing hit.
 */
function measureJavaSciptExecutionTime() {
  var jsExecuteTime = measureDuration('js:execute');
  if (jsExecuteTime) {
    ga('send', 'timing', 'JavaScript', 'execute', jsExecuteTime);
  }
}


/**
 * Accepts a mark name and an optional reference point in the navigation timing
 * API and returns the time duration between the reference point and the last
 * mark (chronologically). The return value is rounded to the nearest whole
 * number to be compatible with Google Analytics.
 * @param {string} mark The mark name.
 * @param {string=} opt_reference An optional reference point from the
 *     navigation timing API. Defaults to 'responseEnd'.
 * @return {?number} The time duration as an integer or undefined if no
 *     matching marks can be found.
 */
function measureDuration(mark, opt_reference) {
  if (window.__perf) {
    var reference = opt_reference || 'responseEnd';
    var name = reference + ':' + mark;

    // Clears any existing measurements with the same name.
    performance.clearMeasures(name);

    // Creates a new measurement from the reference point to the specified mark.
    // If more than one mark with this name exists, the most recent one is used.
    performance.measure(name, reference, mark);

    // Gets the value of the measurement just created.
    var measure = performance.getEntriesByName(name)[0];

    // Returns the measure duration.
    return Math.round(measure.duration);
  }
}
And the final index.html file should look like this:
<!DOCTYPE html>
<html lang="en">
<head>
<meta charset="utf-8">
<meta http-equiv="X-UA-Compatible" content="IE=edge">
<meta name="viewport" content="width=device-width, initial-scale=1">
<title>Performance Analytics Demo</title>
<!-- Start navigation timing feature detect -->
<script>window.__perf = window.performance && performance.mark;</script>
<!-- End navigation timing feature detect -->
<!-- Start fonts -->
<script>
window.WebFontConfig = {
google: {families: ['Roboto:400,700,400italic']},
timeout: 10000,
active: function() {
__perf && performance.mark('fonts:active');
}
};
</script>
<script async src="https://ajax.googleapis.com/ajax/libs/webfont/1/webfont.js"></script>
<!-- End fonts -->
<!-- Start CSS -->
<link href="https://maxcdn.bootstrapcdn.com/bootstrap/3.3.6/css/bootstrap.min.css" rel="stylesheet">
<style>
body { font-family: Roboto, sans-serif; margin: 1em; }
img { float: left; height: auto; width: 33.33%; }
.gallery { overflow: hidden; }
</style>
<script>__perf && performance.mark('css:unblock');</script>
<!-- End CSS -->
</head>
<body>
<div class="container">
<!-- Start images -->
<div class="gallery">
<img onload="__perf && performance.mark('img:visible')" src="http://lorempixel.com/380/200/animals/1/">
<img onload="__perf && performance.mark('img:visible')" src="http://lorempixel.com/380/200/animals/2/">
<img onload="__perf && performance.mark('img:visible')" src="http://lorempixel.com/380/200/animals/3/">
</div>
<script>__perf && performance.mark('img:visible')</script>
<!-- End images -->
<h1>Performance Analytics Demo</h1>
<p>Real performance data from real users.</p>
</div>
<!-- Start JavaScript -->
<script src="https://ajax.googleapis.com/ajax/libs/jquery/1.11.3/jquery.min.js"></script>
<script src="https://maxcdn.bootstrapcdn.com/bootstrap/3.3.6/js/bootstrap.min.js"></script>
<script>__perf && performance.mark('js:execute');</script>
<!-- End JavaScript -->
<!-- Start analytics tracking snippet -->
<script>
window.ga=window.ga||function(){(ga.q=ga.q||[]).push(arguments)};ga.l=+new Date;
ga('create', 'UA-XXXXX-Y', 'auto');
ga('send', 'pageview');
</script>
<script async src="https://www.google-analytics.com/analytics.js"></script>
<!-- End analytics tracking snippet -->
<!-- Start performance analytics -->
<script async src="perf-analytics.js"></script>
<!-- End performance analytics -->
</body>
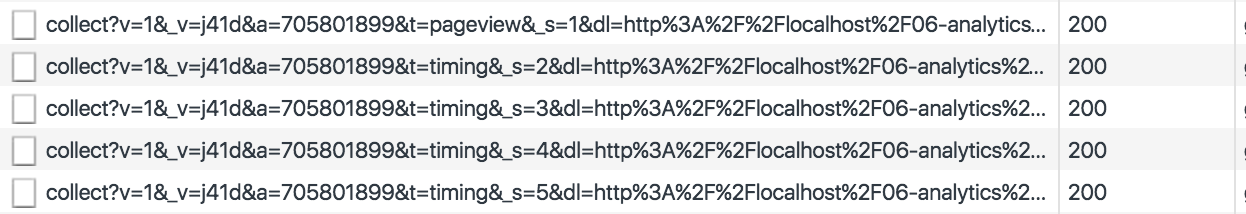
</html>If you load this page and take a look at the requests in the network panel, you'll see something like the following show up:
This is useful, but it can be cumbersome to look at this data as a URL-encoded request. And, if for whatever reason you don't see these requests, it's really hard to track down where the failure occurred.
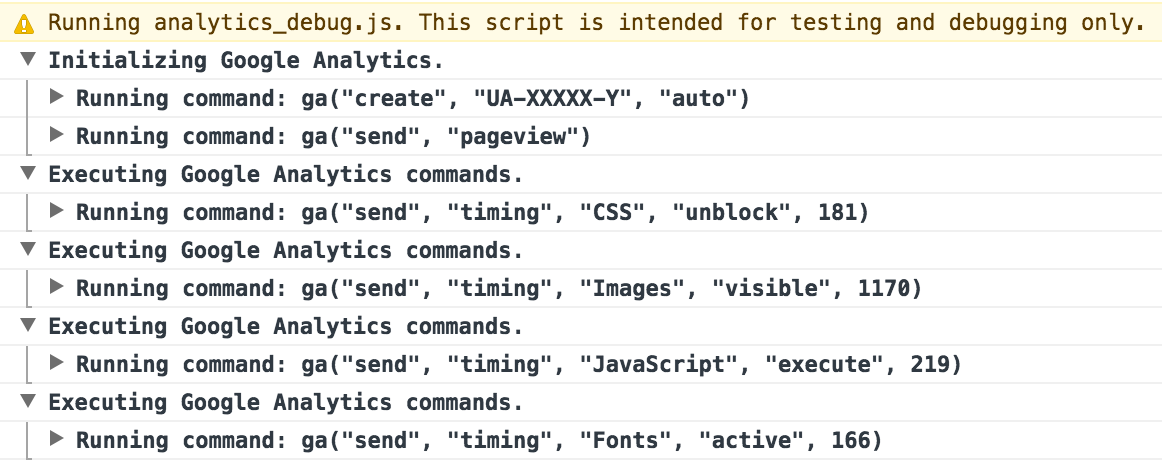
A better approach when developing locally is to use the debug version of analytics.js, which will log useful debugging information to the console as each analytics.js command is run. If you
update the analytics.js URL in index.html to analytics_debug.js and open your browser console, you'll see statements printed out that look like this:
Now that you understand how to implement performance measurement for this demo page, you can try adding it to your own site, sending real user data to Google Analytics.
Reporting on the data you've collect
After you've been collecting performance data for a few days, you'll be able to report on that data to gain actionable insight into how quickly your site and its resources actually load for real users.
To get to the User Timing reports in Google Analytics, click on the Reporting tab at the top and select "Behavior > Site Speed > User Timings" from the sidebar navigation (or follow the instructions to view the User Timings report from the Help Center).
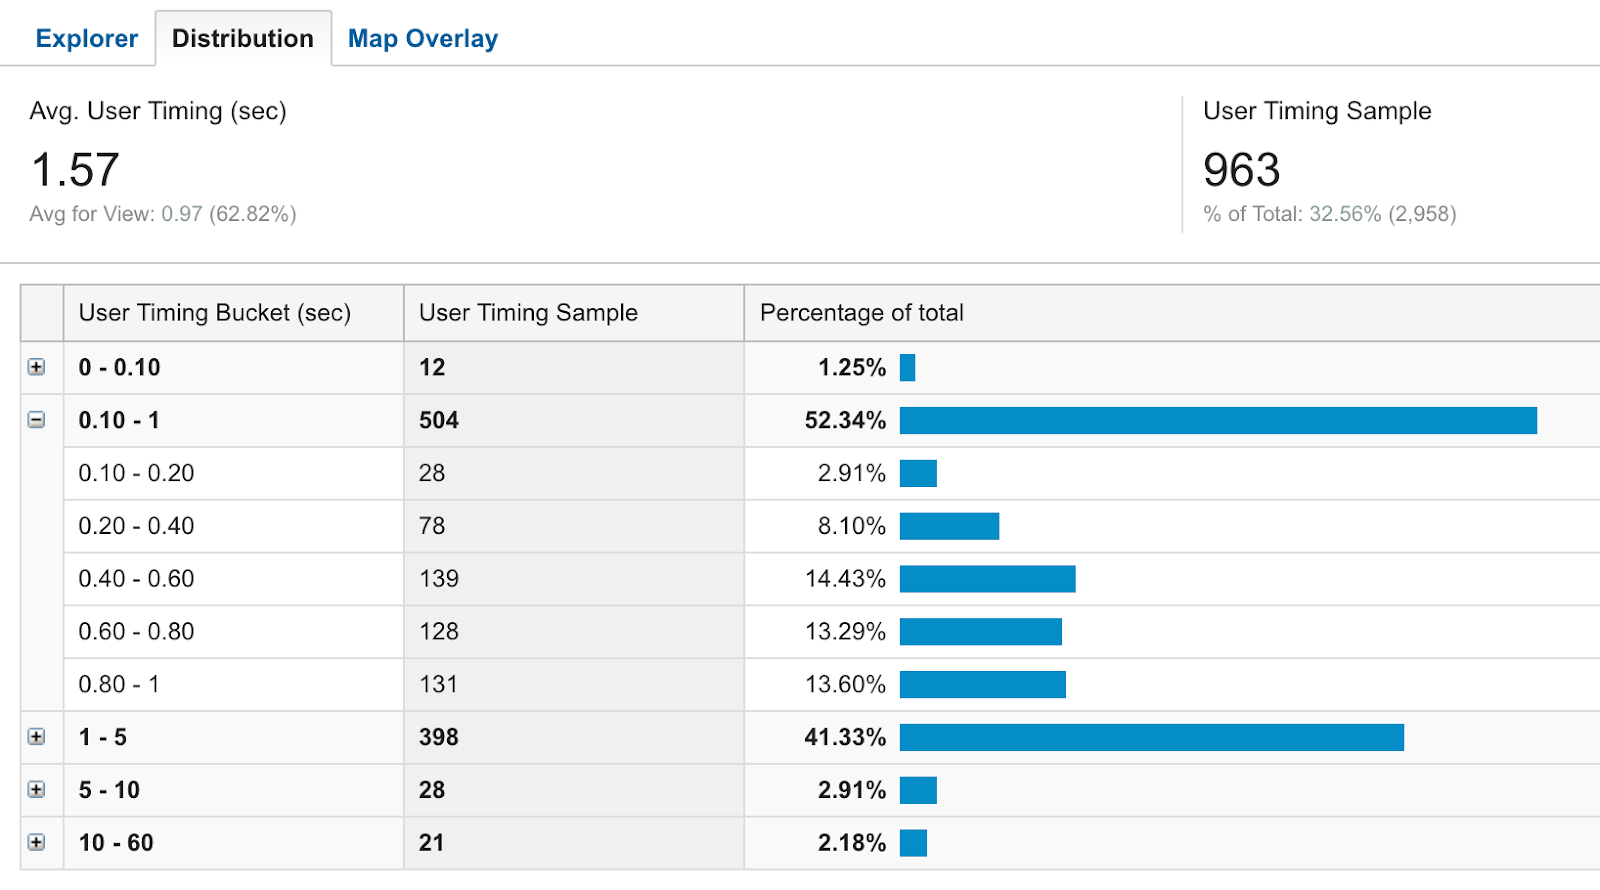
When you load User Timings report in Google Analytics, you should be able to see the timing categories that correspond to the data you sent. Click on any of those to see detailed visualizations of your timing data. The follow image is an example of font load times on a real website using Google Fonts over the last 24 hours.
Congratulations! You've successfully completed this code lab. If you'd like to go deeper, the next section will give you a few suggestions for how to build on top of this code to get even more insight.
The performance metrics covered in this code lab are critical to measuring how your site loads for real users, but they're just the beginning. If you'd like to go deeper into performance analytics, an easy next would simply be to track more metrics.
In this code lab you tracked metrics related to when resources were available to the user. If you wanted, you could break most of these down even further. For example, instead of just measuring when the JavaScript finished executing, you could measure when it started loading, when it finished loading, when it started executing, and then finally when it finished executing. Each of these metrics could uncover an issue that just one of them might not tell.
In addition to getting more granular, you should also think more wholistically about your general performance analytics strategy. What are the goals? What is success?
When it come to any sort of analytics, you'll usually want to start with some sort of question, and then figure out how to use data to answer that question.
For example, consider the following list of question, and how you'd use the knowledge you gained in this code lab to use analytics to answer them:
- Are the values of the metrics your tracking decreasing or increasing over time?
- How would the use of offline caching via service worker or local storage affect the overall performance of your site?
- Are your resources being loaded optimally? I.e. is there a large gap between when the resource is downloaded and when it's available for use?
- Are there any correlations between performance and other metrics you're tracking (e.g. sign-up rate, time on site, purchases, etc)?
Lastly, if you'd like to learn more about web performance or Google Analytics, here are some great resources to get you started:
- Tools and information to help you build high performance web sites
https://developers.google.com/speed/ - Tools and APIs for developers to leverage the Google Analytics platform
https://developers.google.com/analytics/ - Online courses that teach you how to use the Google Analytics product itself (taught by people who work on Google Analytics itself.
https://analyticsacademy.withgoogle.com/