Datasets tagged publisher-dataset in Earth Engine
সেভ করা পৃষ্ঠা গুছিয়ে রাখতে 'সংগ্রহ' ব্যবহার করুন
আপনার পছন্দ অনুযায়ী কন্টেন্ট সেভ করুন ও সঠিক বিভাগে রাখুন।
কোকো সম্ভাব্যতা মডেল ২০২৫ক
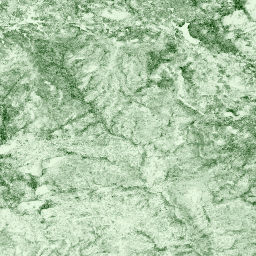
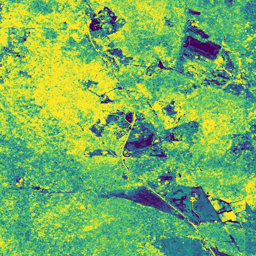
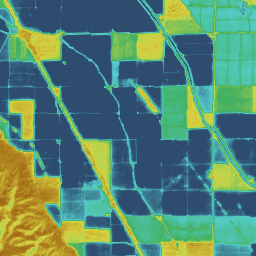
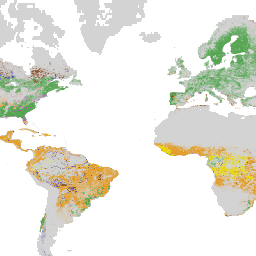
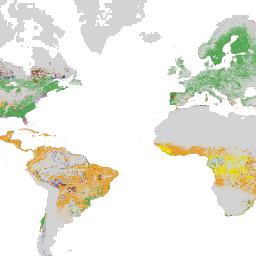
এই চিত্র সংগ্রহটি প্রতি-পিক্সেল ভিত্তিতে একটি আনুমানিক সম্ভাবনা প্রদান করে যে, অন্তর্নিহিত এলাকাটি পণ্য দ্বারা অধিকৃত। এই সম্ভাবনার অনুমানগুলো ১০ মিটার রেজোলিউশনে প্রদান করা হয়েছে এবং একটি মেশিন লার্নিং মডেল দ্বারা তৈরি করা হয়েছে। বিস্তারিত জানতে, ফরেস্ট ডেটা পার্টনারশিপ-এর প্রযুক্তিগত ডকুমেন্টেশন দেখুন…
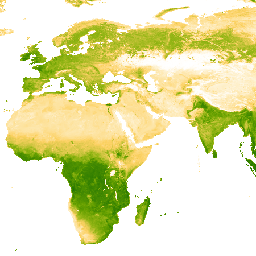
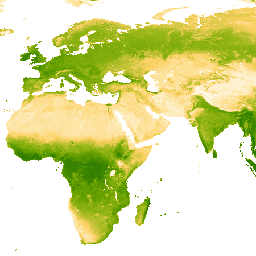
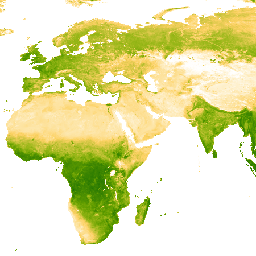
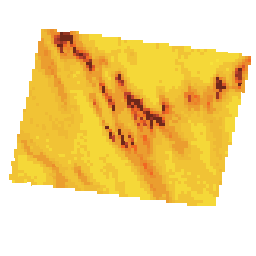
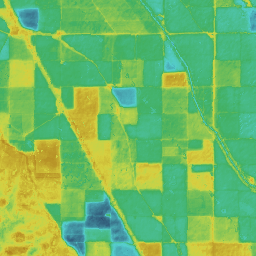
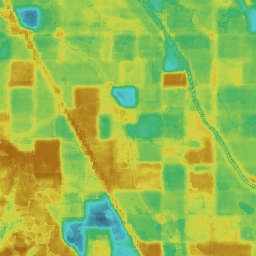
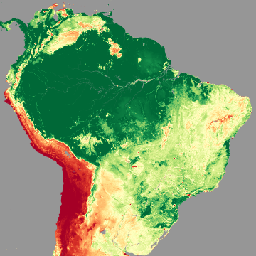
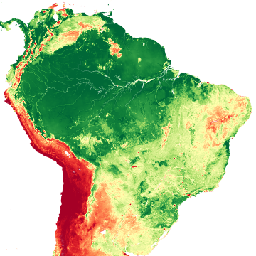
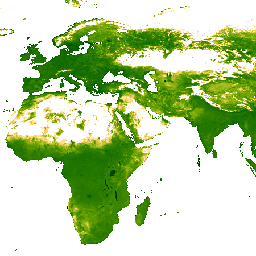
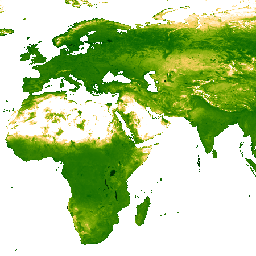
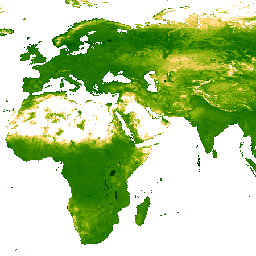
এই বর্ধিত উদ্ভিদ সূচক (EVI) পণ্যের অন্তর্নিহিত ডেটাসেটটি হলো MODIS BRDF-সংশোধিত চিত্রাবলী (MCD43B4), যা মেঘের আচ্ছাদনের মতো কারণগুলির দ্বারা সৃষ্ট অনুপস্থিত ডেটা দূর করার জন্য Weiss et al. (2014)-এ বর্ণিত পদ্ধতি ব্যবহার করে ফাঁক পূরণ করা হয়েছিল। ফাঁক পূরণের পর ডেটাটি ছেঁটে ফেলা হয়েছিল…
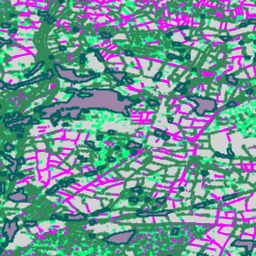
ফার্মস্কেপস ২০২০ ডেটাসেটটি ইংল্যান্ডের কৃষি ভূদৃশ্যের তিনটি প্রধান আধা-প্রাকৃতিক বৈশিষ্ট্যের—হেজরো, বনভূমি এবং পাথরের দেয়াল—জন্য উচ্চ-রেজোলিউশনের (২৫ সেমি) সম্ভাব্যতা মানচিত্র প্রদান করে। এই ডেটাসেটটি অক্সফোর্ডের লেভারহুলম সেন্টার ফর নেচার রিকভারির সহযোগিতায় বিভিন্ন অ্যাপ্লিকেশনের জন্য একটি ভিত্তি হিসেবে কাজ করার উদ্দেশ্যে তৈরি করা হয়েছে…
এটি ফার্মস্কেপস ২০২০ রাস্টার ডেটাসেটের ভেক্টরাইজড সংস্করণ। এটি ইংল্যান্ডের কৃষিভূমি জুড়ে সূক্ষ্ম মাত্রার আধা-প্রাকৃতিক ভূদৃশ্য বৈশিষ্ট্য (বিশেষত বেড়া, বনভূমি এবং পাথরের দেয়াল) উপস্থাপনকারী বহুভুজ জ্যামিতি প্রদান করে। এই ডেটাসেটটি অক্সফোর্ড লেভারহুলম সেন্টার ফর নেচার রিকভারির সহযোগিতায় তৈরি করা হয়েছিল…
এই চিত্রটি প্রতি-পিক্সেল একটি স্কোর ([০, ১] পরিসরে) প্রদান করে, যা নির্দেশ করে যে ২০২০ সালে পিক্সেল এলাকাটি অক্ষত বন দ্বারা অধিকৃত ছিল কিনা। এই স্কোরগুলি ৩০ মিটার রেজোলিউশনে প্রদান করা হয়েছে এবং একাধিক বনের তথ্য একত্রিত করার জন্য একটি প্রমাণ সমন্বয় পদ্ধতির মাধ্যমে তৈরি করা হয়েছে…
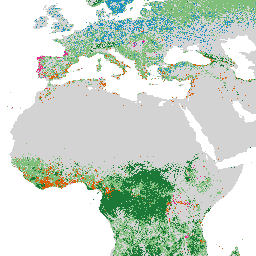
ফরেস্ট টাইপোলজি (ForTy) v1 ডেটাসেটটিতে ২০২০ সালের জন্য ৬৫° দক্ষিণ এবং ৮৪° উত্তর অক্ষাংশের মধ্যবর্তী সমস্ত স্থলভাগকে অন্তর্ভুক্ত করে ১০ মিটার রেজোলিউশনের একটি বৈশ্বিক শ্রেণি-ভিত্তিক সম্ভাব্যতা মানচিত্র রয়েছে। ছয়-শ্রেণির এই টাইপোলজিটি FAO এবং EU বন উজাড় নিয়ন্ত্রণ বিধিমালা (EUDR)-এর সংজ্ঞার সাথে সামঞ্জস্যপূর্ণ: শ্রেণি ১…
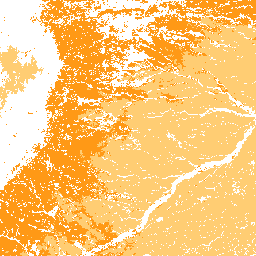
এই ডেটাসেটটি ২০০০ থেকে ২০২২ সাল পর্যন্ত ৩০-মিটার স্থানিক রেজোলিউশনে তৃণভূমির (চাষকৃত এবং প্রাকৃতিক/আধা-প্রাকৃতিক) বৈশ্বিক বার্ষিক প্রধান শ্রেণীর মানচিত্র সরবরাহ করে। ল্যান্ড অ্যান্ড কার্বন ল্যাব গ্লোবাল প্যাসচার ওয়াচ উদ্যোগ দ্বারা প্রস্তুতকৃত এই মানচিত্রে অন্তর্ভুক্ত তৃণভূমির বিস্তৃতিতে এমন যেকোনো ভূমি আচ্ছাদন প্রকার অন্তর্ভুক্ত রয়েছে, যাতে অন্ততপক্ষে …
এই ডেটাসেটটি ২০০০ থেকে ২০২২ সাল পর্যন্ত ৩০-মিটার স্থানিক রেজোলিউশনে চাষ করা তৃণভূমির বৈশ্বিক বার্ষিক সম্ভাব্যতা মানচিত্র প্রদান করে। ল্যান্ড অ্যান্ড কার্বন ল্যাব গ্লোবাল প্যাসচার ওয়াচ উদ্যোগ দ্বারা প্রস্তুতকৃত এই মানচিত্রে অন্তর্ভুক্ত তৃণভূমির বিস্তৃতিতে এমন যেকোনো ভূমি আচ্ছাদন প্রকার অন্তর্ভুক্ত রয়েছে, যেখানে কমপক্ষে ৩০% শুষ্ক…
এই ডেটাসেটটি ২০০০ থেকে ২০২২ সাল পর্যন্ত ৩০-মিটার স্থানিক রেজোলিউশনে প্রাকৃতিক/আধা-প্রাকৃতিক তৃণভূমির বৈশ্বিক বার্ষিক সম্ভাব্যতা মানচিত্র প্রদান করে। ল্যান্ড অ্যান্ড কার্বন ল্যাব গ্লোবাল প্যাসচার ওয়াচ উদ্যোগ দ্বারা প্রস্তুতকৃত এই মানচিত্রে অন্তর্ভুক্ত তৃণভূমির বিস্তৃতিতে এমন যেকোনো ভূমি আচ্ছাদন প্রকার অন্তর্ভুক্ত রয়েছে, যেখানে কমপক্ষে ৩০% শুষ্ক…
GPW বার্ষিক গবাদি পশুর সংখ্যা FAOSTAT-সমন্বিত সংস্করণ ১
এই ডেটাসেটটি ২০০০ থেকে ২০২২ সাল পর্যন্ত ১-কিমি স্থানিক রেজোলিউশনে বিশ্বব্যাপী গবাদি পশুর সংখ্যা প্রদান করে। ল্যান্ড অ্যান্ড কার্বন ল্যাবের গ্লোবাল প্যাসচার ওয়াচ উদ্যোগ দ্বারা প্রস্তুতকৃত, বর্তমান ডেটাসেটটি FAOSTAT-এর জাতীয় পরিসংখ্যানের সাথে সামঞ্জস্যপূর্ণ বিশ্বব্যাপী গবাদি পশুর সংখ্যার পূর্বাভাস প্রদান করে। ডেটাসেটটি বৃহত্তম পরিচিত…
এই ডেটাসেটটি ২০০০ সাল থেকে ৩০-মিটার স্থানিক রেজোলিউশনে বিশ্বব্যাপী উদ্ভিদের গড় উচ্চতা প্রদান করে। ল্যান্ড অ্যান্ড কার্বন ল্যাবের গ্লোবাল প্যাসচার ওয়াচ উদ্যোগ দ্বারা প্রস্তুতকৃত এই ডেটাসেটটি ২০০০ সাল থেকে বিশ্বব্যাপী ৩০-মিটার স্থানিক রেজোলিউশনে উদ্ভিদের গড় উচ্চতার মান (৫০তম পার্সেন্টাইল) প্রদান করে। ডেটাসেটটি ভিত্তি করে…
GPW বার্ষিক অ-ক্যালিব্রেটেড মোট প্রাথমিক উৎপাদনশীলতা (uGPP) v1
এই ডেটাসেটটি ২০০০ সাল থেকে ৩০-মিটার স্থানিক রেজোলিউশনে বিশ্বব্যাপী অ-ক্যালিব্রেটেড EO-ভিত্তিক মোট প্রাথমিক উৎপাদনশীলতার তথ্য প্রদান করে। ল্যান্ড অ্যান্ড কার্বন ল্যাব গ্লোবাল প্যাসচার ওয়াচ উদ্যোগ দ্বারা প্রস্তুতকৃত, বর্তমান ডেটাসেটটি ২০০০ সাল থেকে বিশ্বব্যাপী ৩০-মিটার স্থানিক রেজোলিউশনে মোট প্রাথমিক উৎপাদনশীলতা (GPP)-র মান সরবরাহ করে। GPP মানগুলো…
সিজিএমডি-এক্সটেন্ট৩০ (কন্টিনিউয়াস গ্লোবাল ম্যানগ্রোভ ডাইনামিক্স-অ্যানুয়াল ম্যানগ্রোভ এক্সটেন্ট অ্যাট ৩০-মিটার রেজোলিউশন) ডেটাসেটটি ১৯৮৪ থেকে ২০২৩ সাল পর্যন্ত বিশ্বব্যাপী বার্ষিক ম্যানগ্রোভের বিস্তৃতি প্রদান করে। ডেটাসেটটি একটি একক আর্থ ইঞ্জিন ফিচার কালেকশন হিসেবে বিন্যস্ত, যেখানে প্রতিটি ফিচার একটি নির্দিষ্ট বছরের জন্য ম্যাপ করা ম্যানগ্রোভ পলিগনকে প্রতিনিধিত্ব করে। ডেটাসেটটি…
এই ডেটাসেটটি ১৯৮৪ থেকে ২০২৩ সাল পর্যন্ত ৩০-মিটার স্থানিক রেজোলিউশনে বৈশ্বিক বার্ষিক ম্যানগ্রোভ ফ্র্যাকশনাল ক্যানোপি কভার (FCC) প্রদান করে, যা ক্যানোপি অবক্ষয় ও পুনরুদ্ধার, ব্লু কার্বন মূল্যায়ন এবং উপকূলীয় বাস্তুতন্ত্র পর্যবেক্ষণ সহ দীর্ঘমেয়াদী ম্যানগ্রোভ গতিবিদ্যার বৃহৎ পরিসরের বিশ্লেষণকে সমর্থন করে। FCC প্রতিটি ল্যান্ডস্যাট …
এলএসটি দিবস: ম্যালেরিয়া অ্যাটলাস প্রকল্পের ফাঁক পূরণকৃত দিনের বেলার ভূপৃষ্ঠের তাপমাত্রা (৮-দৈনিক ১ কিমি)
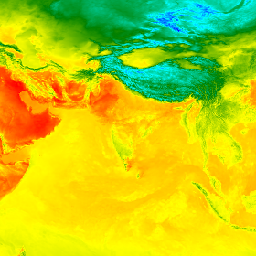
দিনের বেলার ভূমি পৃষ্ঠের তাপমাত্রা (LST) প্রায় ১ কিমি MODIS MOD11A2 v6.1 প্রোডাক্ট থেকে নির্ণয় করা হয়। ৮-দিনের কম্পোজিটগুলোকে ডিগ্রি সেলসিয়াসে রূপান্তর করা হয় এবং তারপর মেঘের আচ্ছাদনের মতো কারণ দ্বারা সৃষ্ট অনুপস্থিত ডেটা দূর করার জন্য Weiss et al (2014)-এ বর্ণিত পদ্ধতি ব্যবহার করে ফাঁক পূরণ করা হয়। …
এলএসটি দিবস: ম্যালেরিয়া অ্যাটলাস প্রকল্পের ফাঁক-পূরণকৃত দিনের বেলার ভূপৃষ্ঠের তাপমাত্রা (বার্ষিক ১ কিমি)
দিনের বেলার ভূমি পৃষ্ঠের তাপমাত্রা (LST) প্রায় ১ কিমি MODIS MOD11A2 v6.1 প্রোডাক্ট থেকে নির্ণয় করা হয়। ৮-দিনের কম্পোজিটগুলোকে ডিগ্রি সেলসিয়াসে রূপান্তর করা হয় এবং তারপর মেঘের আচ্ছাদনের মতো কারণ দ্বারা সৃষ্ট অনুপস্থিত ডেটা দূর করার জন্য Weiss et al (2014)-এ বর্ণিত পদ্ধতি ব্যবহার করে ফাঁক পূরণ করা হয়। …
এলএসটি দিবস: ম্যালেরিয়া অ্যাটলাস প্রকল্পের ফাঁক পূরণকৃত দিনের বেলার ভূপৃষ্ঠের তাপমাত্রা (মাসিক ১ কিমি)
দিনের বেলার ভূমি পৃষ্ঠের তাপমাত্রা (LST) প্রায় ১ কিমি MODIS MOD11A2 v6.1 প্রোডাক্ট থেকে নির্ণয় করা হয়। ৮-দিনের কম্পোজিটগুলোকে ডিগ্রি সেলসিয়াসে রূপান্তর করা হয় এবং তারপর মেঘের আচ্ছাদনের মতো কারণ দ্বারা সৃষ্ট অনুপস্থিত ডেটা দূর করার জন্য Weiss et al (2014)-এ বর্ণিত পদ্ধতি ব্যবহার করে ফাঁক পূরণ করা হয়। …
এলএসটি নাইট: ম্যালেরিয়া অ্যাটলাস প্রকল্পের শূন্যস্থান পূরণকৃত রাত্রিকালীন ভূপৃষ্ঠের তাপমাত্রা (৮-দৈনিক ১ কিমি)
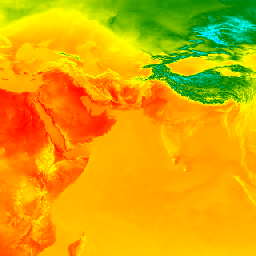
রাত্রিকালীন ভূমি পৃষ্ঠের তাপমাত্রা (LST) প্রায় ১ কিমি MODIS MOD11A2 v6.1 প্রোডাক্ট থেকে নির্ণয় করা হয়। ৮-দিনের কম্পোজিটগুলোকে ডিগ্রি সেলসিয়াসে রূপান্তর করা হয় এবং তারপর মেঘের আচ্ছাদনের মতো কারণ দ্বারা সৃষ্ট অনুপস্থিত ডেটা দূর করার জন্য Weiss et al (2014)-এ বর্ণিত পদ্ধতি ব্যবহার করে ফাঁক পূরণ করা হয়। …
এলএসটি নাইট: ম্যালেরিয়া অ্যাটলাস প্রকল্পের শূন্যস্থান-পূরণকৃত রাত্রিকালীন ভূমি পৃষ্ঠের তাপমাত্রা (বার্ষিক ১ কিমি)
রাত্রিকালীন ভূমি পৃষ্ঠের তাপমাত্রা (LST) প্রায় ১ কিমি MODIS MOD11A2 v6.1 প্রোডাক্ট থেকে নির্ণয় করা হয়। ৮-দিনের কম্পোজিটগুলোকে ডিগ্রি সেলসিয়াসে রূপান্তর করা হয় এবং তারপর মেঘের আচ্ছাদনের মতো কারণ দ্বারা সৃষ্ট অনুপস্থিত ডেটা দূর করার জন্য Weiss et al (2014)-এ বর্ণিত পদ্ধতি ব্যবহার করে ফাঁক পূরণ করা হয়। …
এলএসটি নাইট: ম্যালেরিয়া অ্যাটলাস প্রকল্পের শূন্যস্থান পূরণকৃত রাত্রিকালীন ভূপৃষ্ঠের তাপমাত্রা (মাসিক ১ কিমি)
রাত্রিকালীন ভূমি পৃষ্ঠের তাপমাত্রা (LST) প্রায় ১ কিমি MODIS MOD11A2 v6.1 প্রোডাক্ট থেকে নির্ণয় করা হয়। ৮-দিনের কম্পোজিটগুলোকে ডিগ্রি সেলসিয়াসে রূপান্তর করা হয় এবং তারপর মেঘের আচ্ছাদনের মতো কারণ দ্বারা সৃষ্ট অনুপস্থিত ডেটা দূর করার জন্য Weiss et al (2014)-এ বর্ণিত পদ্ধতি ব্যবহার করে ফাঁক পূরণ করা হয়। …
MAPL-EMIT: মডেলকৃত মিথেন বৃদ্ধি এবং প্লুম সম্ভাবনা
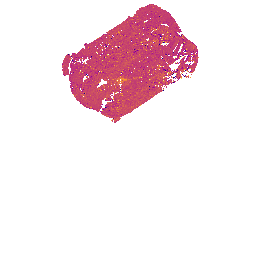
মিথেন বিশ্লেষণ এবং প্লুম স্থানীয়করণ উইথ ইমিট (MAPL-EMIT) এনহ্যান্সমেন্টস ডেটাসেটটি উচ্চ-রেজোলিউশনের (৬০মি) মিথেন (CH₄) এনহ্যান্সমেন্ট ম্যাপ এবং প্লুম সম্ভাব্যতা প্রদান করে, যা আর্থ সারফেস মিনারেল ডাস্ট সোর্স ইনভেস্টিগেশন (EMIT) যন্ত্র দ্বারা ধারণকৃত রেডিয়েন্স ডেটা থেকে উদ্ভূত এবং যা … এর অংশ হিসাবে তৈরি ও প্রকাশ করা হয়েছিল।
EMIT (MAPL-EMIT) ডেটাসেটের মাধ্যমে মিথেন বিশ্লেষণ এবং প্লুমের অবস্থান নির্ণয়, আর্থ সারফেস মিনারেল ডাস্ট সোর্স ইনভেস্টিগেশন (EMIT) যন্ত্র দ্বারা সংগৃহীত রেডিয়েন্স ডেটা থেকে প্রাপ্ত উচ্চ-রেজোলিউশনের (৬০ মিটার) মিথেন (CH₄) প্লুমের জটিল মানচিত্র এবং প্লুমের উৎসের অবস্থান প্রদান করে। মিথেনের বিন্দু-উৎস থেকে নির্গমন একটি প্রধান চালিকাশক্তি…
এই বৈশ্বিক প্রবেশগম্যতা মানচিত্রটি ২০১৫ সালকে ধরা হলে, ৮৫ ডিগ্রি উত্তর এবং ৬০ ডিগ্রি দক্ষিণের মধ্যবর্তী সমস্ত এলাকার জন্য নিকটতম ঘনবসতিপূর্ণ এলাকায় পৌঁছানোর স্থলপথের ভ্রমণ সময় গণনা করে। ঘনবসতিপূর্ণ এলাকা বলতে এমন সংলগ্ন এলাকাকে বোঝানো হয় যেখানে প্রতি বর্গ কিলোমিটারে ১,৫০০ বা তার বেশি বাসিন্দা রয়েছে অথবা…
ম্যালেরিয়া অ্যাটলাস প্রকল্প: স্বাস্থ্যসেবা প্রাপ্তির সুযোগ ২০১৯
এই বৈশ্বিক প্রবেশগম্যতা মানচিত্রটি ২০১৯ সালকে ধরা যাক, সেই বছরের জন্য ৮৫ ডিগ্রি উত্তর এবং ৬০ ডিগ্রি দক্ষিণ অক্ষাংশের মধ্যবর্তী সমস্ত এলাকার নিকটতম হাসপাতাল বা ক্লিনিকে স্থলপথে ভ্রমণের সময় (মিনিটে) গণনা করে। ওপেনস্ট্রিটম্যাপ, গুগল ম্যাপস এবং শিক্ষাবিদ গবেষকদের দ্বারা চলমান প্রধান তথ্য সংগ্রহ প্রচেষ্টাগুলো…
ম্যালেরিয়া অ্যাটলাস প্রকল্প: স্বাস্থ্যসেবা প্রাপ্তির সুযোগ ২০১৯ (শুধুমাত্র পায়ে হেঁটে)
এই বৈশ্বিক প্রবেশগম্যতা মানচিত্রটি ২০১৯ সালের জন্য ৮৫ ডিগ্রি উত্তর এবং ৬০ ডিগ্রি দক্ষিণ অক্ষাংশের মধ্যবর্তী সমস্ত এলাকার নিকটতম হাসপাতাল বা ক্লিনিকে স্থলপথে ভ্রমণের সময় (মিনিটে) গণনা করে। এই মানচিত্রটি শুধুমাত্র হেঁটে ভ্রমণের সময়ের উপর ভিত্তি করে তৈরি, যেখানে মোটরবিহীন পরিবহন ব্যবস্থা ব্যবহার করা হয়েছে…
"ফ্রিকশন সারফেস ২০১৯"। এই বৈশ্বিক ফ্রিকশন সারফেসটি ২০১৫ সালকে আনুমানিক ধরে ৮৫ ডিগ্রি উত্তর এবং ৬০ ডিগ্রি দক্ষিণ অক্ষাংশের মধ্যবর্তী সমস্ত স্থল পিক্সেলের স্থলভিত্তিক ভ্রমণের গতি গণনা করে। এই মানচিত্রটি ইউনিভার্সিটি অফ অক্সফোর্ড ম্যালেরিয়া অ্যাটলাস প্রজেক্ট (MAP), গুগল, … এর সহযোগিতায় তৈরি করা হয়েছে।
এই বৈশ্বিক ঘর্ষণ তলটি ২০১৯ সালকে আনুমানিক ধরে ৮৫ ডিগ্রি উত্তর এবং ৬০ ডিগ্রি দক্ষিণ অক্ষাংশের মধ্যবর্তী সমস্ত স্থল পিক্সেলের স্থলভিত্তিক ভ্রমণের গতি গণনা করে। এই মানচিত্রটি MAP (অক্সফোর্ড বিশ্ববিদ্যালয়), Telethon Kids Institute (পার্থ, অস্ট্রেলিয়া), Google, এবং …-এর মধ্যে একটি সহযোগিতার মাধ্যমে তৈরি করা হয়েছে।
এই বৈশ্বিক ঘর্ষণ পৃষ্ঠটি ২০১৯ সালের জন্য ৮৫ ডিগ্রি উত্তর এবং ৬০ ডিগ্রি দক্ষিণ অক্ষাংশের মধ্যবর্তী সমস্ত স্থল পিক্সেলের স্থলভিত্তিক ভ্রমণের গতি গণনা করে। এই পৃষ্ঠটি শুধুমাত্র অ-মোটরচালিত পরিবহন মাধ্যম ব্যবহার করে 'কেবলমাত্র হেঁটে' ভ্রমণের গতির উপর ভিত্তি করে তৈরি। এই মানচিত্রটি একটি … এর মাধ্যমে তৈরি করা হয়েছিল।
MapBiomas ভূমি ব্যবহার ও ভূমি আচ্ছাদন - বলিভিয়া ভি১.০
বলিভিয়ার জন্য ম্যাপবায়োমাস ভূমি ব্যবহার ও ভূমি আচ্ছাদন (LULC) ডেটাসেটটি ম্যাপবায়োমাস প্রজেক্ট দ্বারা প্রতি বছর ল্যান্ডস্যাট স্যাটেলাইট চিত্র এবং মেশিন লার্নিং ক্লাসিফিকেশন কৌশল ব্যবহার করে তৈরি করা হয়। এই ডেটাসেটটি ১৯৮৫ থেকে ২০২৪ সাল পর্যন্ত সময়কালের জন্য ৩০-মিটার রেজোলিউশনে সামঞ্জস্যপূর্ণ বার্ষিক ভূমি আচ্ছাদন মানচিত্র সরবরাহ করে। বলিভিয়ার…
MapBiomas ভূমি ব্যবহার ও ভূমি আচ্ছাদন - ব্রাজিল ভি১.০
ব্রাজিলের জন্য ম্যাপবায়োমাস ভূমি ব্যবহার ও ভূমি আচ্ছাদন (LULC) ডেটাসেটটি ম্যাপবায়োমাস প্রজেক্ট দ্বারা প্রতি বছর ল্যান্ডস্যাট স্যাটেলাইট চিত্রাবলী এবং মেশিন লার্নিং ক্লাসিফিকেশন কৌশল ব্যবহার করে তৈরি করা হয়। এই ডেটাসেটটি ৩০-মিটার রেজোলিউশনে সামঞ্জস্যপূর্ণ, বিষয়ভিত্তিক বিস্তারিত মানচিত্র প্রদান করে, যা একাধিক দশক ধরে বিস্তৃত এবং প্রতি বছর হালনাগাদ করা হয়। প্রতিটি চিত্র…
ম্যাপবায়োমাস ভূমি ব্যবহার ও ভূমি আচ্ছাদন - ইকুয়েডর ভি১.০
ইকুয়েডরের জন্য ম্যাপবায়োমাস ভূমি ব্যবহার ও ভূমি আচ্ছাদন (LULC) ডেটাসেটটি ম্যাপবায়োমাস প্রজেক্ট দ্বারা প্রতি বছর ল্যান্ডস্যাট স্যাটেলাইট চিত্র এবং মেশিন লার্নিং ক্লাসিফিকেশন কৌশল ব্যবহার করে তৈরি করা হয়। এই ডেটাসেটটি ১৯৮৫ থেকে ২০২৪ সাল পর্যন্ত সময়কালের জন্য ৩০-মিটার রেজোলিউশনে সামঞ্জস্যপূর্ণ বার্ষিক ভূমি আচ্ছাদন মানচিত্র সরবরাহ করে। ইকুয়েডরের…
এই ডেটাসেটটি মিথেনএয়ার ইমেজিং স্পেকট্রোমিটার দ্বারা পর্যবেক্ষণকৃত বায়ুমণ্ডলে মিথেনের মোট কলাম শুষ্ক বায়ু মোল ভগ্নাংশ, "XCH4"-এর ভূ-স্থানিক ডেটা সরবরাহ করে। XCH4-কে মিথেনের ("CH4") মোট কলাম পরিমাণ (অণুর সংখ্যা) কে মোট পরিমাণ দ্বারা ভাগ করে সংজ্ঞায়িত করা হয়…
এই ডেটাসেটটি পশ্চিমে কলোরাডো, নিউ মেক্সিকো এবং টেক্সাস থেকে পূর্বে পেনসিলভানিয়া, ওহাইও এবং ওয়েস্ট ভার্জিনিয়া পর্যন্ত বিস্তৃত ১৩টি তেল ও গ্যাস বা কয়লা উত্তোলন এলাকা, এবং তিনটি শহুরে এলাকা (নিউ ইয়র্ক সিটি, …) জুড়ে উচ্চ-নিঃসরণকারী মিথেন বিন্দু উৎস শনাক্তকরণের (কেজি/ঘণ্টা) তথ্য সরবরাহ করে।
এই প্রাথমিক "পাবলিক প্রিভিউ" ডেটাসেটটি মিথেনস্যাট ইমেজিং স্পেকট্রোমিটারের পরিমাপ থেকে প্রাপ্ত বায়ুমণ্ডলে মিথেনের কলাম-গড় শুষ্ক-বায়ু মোল ভগ্নাংশ, "XCH4"-এর ভূ-স্থানিক ডেটা সরবরাহ করে। XCH4-কে মোট কলাম পরিমাণ (একক পৃষ্ঠতলের উপরে অণুর সংখ্যা) হিসাবে সংজ্ঞায়িত করা হয়…
বিক্ষিপ্ত এলাকার নির্গমন মডেলটি এখনও নির্মাণাধীন এবং এটি কোনো চূড়ান্ত সংস্করণের প্রতিনিধিত্ব করে না। এই প্রাথমিক "পাবলিক প্রিভিউ" ডেটাসেটটি বিক্ষিপ্ত এলাকার উৎস থেকে মিথেন নির্গমনের জন্য উচ্চ নির্ভুল ডেটা সরবরাহ করে। এই নির্গমনের ডেটা অ্যাপালেশিয়ান, পারমিয়ান এবং উইন্টা অববাহিকা থেকে সংগৃহীত…
বিক্ষিপ্ত এলাকা নির্গমন মডেলটি এখনও নির্মাণাধীন এবং এটি কোনো চূড়ান্ত সংস্করণের প্রতিনিধিত্ব করে না। এই প্রাথমিক 'পাবলিক প্রিভিউ' ডেটাসেটটি বিক্ষিপ্ত এলাকার উৎস থেকে মিথেন নির্গমনের জন্য উচ্চ নির্ভুল ডেটা সরবরাহ করে। এই অভিনব পরিমাপগুলো উচ্চ নির্ভুলতার সাথে মোট মিথেন নির্গমনের পরিমাণ নির্ধারণের গুরুত্ব তুলে ধরে…
এই প্রাথমিক "পাবলিক প্রিভিউ" ডেটাসেটটি বিচ্ছিন্ন বিন্দু উৎস থেকে মিথেন নির্গমনের জন্য উচ্চ নির্ভুল ডেটা সরবরাহ করে। এই মিথেন নির্গমন ফ্লাক্সগুলি একটি বিন্দু উৎস সনাক্তকরণ এবং নির্গমন পরিমাণ নির্ধারণ কাঠামো ব্যবহার করে তৈরি করা হয়েছে, যা উচ্চ স্থানিক রেজোলিউশন, বিস্তৃত স্থানিক কভারেজ এবং উচ্চ নির্ভুলতা কাজে লাগানোর জন্য বিশেষায়িত…
অনাবৃত মাটির উপরে ক্যানোপির শীর্ষের উচ্চতা (ক্যানোপি হাইট মডেল; সিএইচএম)। সিএইচএম মডেলটি নিওন লাইডার পয়েন্ট ক্লাউড থেকে উদ্ভূত এবং লাইডার জরিপের সম্পূর্ণ স্থানিক ডোমেন জুড়ে ক্যানোপির উচ্চতার অনুমানের একটি অবিচ্ছিন্ন পৃষ্ঠ তৈরি করে এটি প্রস্তুত করা হয়। …
NEON উদ্ভিদের পাতার রাসায়নিক পর্যবেক্ষণের সাথে ক্রমাঙ্কিত এবং NEON ইমেজিং স্পেকট্রোমিটার (NIS) থেকে প্রাপ্ত L1 পৃষ্ঠের দিকনির্দেশক প্রতিফলনের মাধ্যমে পূর্বাভাসিত মডেলকৃত ক্যানোপি নাইট্রোজেন ঘনত্ব। ব্যান্ডগুলোর মধ্যে রয়েছে ১) ক্যানোপি নাইট্রোজেনের শতাংশ, ২) ক্যানোপি নাইট্রোজেন মডেলের অনিশ্চয়তা, ৩) সূঁচালো পাতা বনাম সূঁচালো পাতা নয় এমন মডেলের শ্রেণিবিন্যাসের ফলাফল এবং …
NEON LiDAR ডেটা থেকে প্রাপ্ত ভূপৃষ্ঠ (DSM) এবং ভূখণ্ডের (DTM) ডিজিটাল মডেল। DSM: ভূপৃষ্ঠের বৈশিষ্ট্য (উদ্ভিদ ও মানবসৃষ্ট কাঠামোসহ ভূসংস্থানিক তথ্য)। DTM: অনাবৃত ভূমির উচ্চতা (উদ্ভিদ ও মানবসৃষ্ট কাঠামো অপসারণ করা ভূসংস্থানিক তথ্য)। ছবিগুলো গড় সমুদ্রপৃষ্ঠ থেকে মিটার উচ্চতায় দেওয়া হয়েছে…
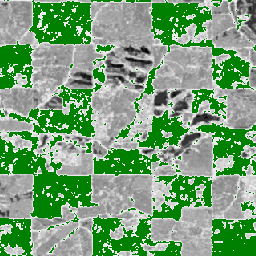
নিকটতম-প্রতিবেশী পুনঃনমুনা পদ্ধতি ব্যবহার করে উচ্চ রেজোলিউশনের লাল-সবুজ-নীল (RGB) অর্থোরেটিফাইড ক্যামেরা চিত্রগুলিকে মোজাইক করে একটি স্থির, অভিন্ন স্থানিক গ্রিডে আউটপুট করা হয়; স্থানিক রেজোলিউশন হল ০.১ মিটার। ডিজিটাল ক্যামেরাটি NEON এয়ারবোর্ন অবজারভেশন প্ল্যাটফর্ম (AOP)-এর একগুচ্ছ যন্ত্রের একটি অংশ, যার মধ্যে আরও রয়েছে একটি…
NEON AOP সারফেস বাইডিরেকশনাল রিফ্লেক্ট্যান্স হলো একটি হাইপারস্পেকট্রাল VSWIR (দৃশ্যমান থেকে শর্টওয়েভ ইনফ্রারেড) ডেটা প্রোডাক্ট, যাতে প্রায় ৩৮০ nm থেকে ২৫১০ nm পর্যন্ত তরঙ্গদৈর্ঘ্যের ৪২৬টি ব্যান্ড রয়েছে। রিফ্লেক্ট্যান্সকে ১০০০০ গুণ স্কেল করা হয়। ১৩৪০-১৪৪৫ nm এবং ১৭৯০-১৯৫৫ nm-এর মধ্যবর্তী তরঙ্গদৈর্ঘ্যগুলো সেট করা হয়েছে…
NEON AOP সারফেস ডিরেকশনাল রিফ্লেক্ট্যান্স হলো একটি হাইপারস্পেকট্রাল VSWIR (দৃশ্যমান থেকে শর্টওয়েভ ইনফ্রারেড) ডেটা প্রোডাক্ট, যাতে প্রায় ৩৮০ nm থেকে ২৫১০ nm পর্যন্ত তরঙ্গদৈর্ঘ্যের ৪২৬টি ব্যান্ড রয়েছে। রিফ্লেক্ট্যান্সকে ১০০০০ গুণ স্কেল করা হয়। ১৩৪০-১৪৪৫ nm এবং ১৭৯০-১৯৫৫ nm এর মধ্যবর্তী তরঙ্গদৈর্ঘ্যগুলো সেট করা হয়েছে…
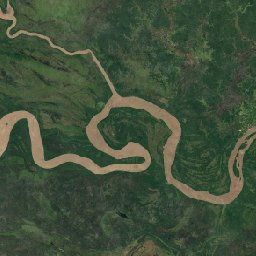
এই চিত্র সংগ্রহটি ক্রান্তীয় অঞ্চলের উচ্চ-রেজোলিউশন স্যাটেলাইট পর্যবেক্ষণের সুযোগ করে দেয়, যার প্রধান উদ্দেশ্য হলো ক্রান্তীয় বনাঞ্চলের ক্ষয় হ্রাস করা ও তা পুনরুদ্ধার করা, জলবায়ু পরিবর্তন মোকাবিলায় অবদান রাখা, জীববৈচিত্র্য সংরক্ষণ করা, বনের পুনর্জন্ম, পুনরুদ্ধার ও উন্নয়নে সহায়তা করা এবং টেকসই উন্নয়নকে সহজতর করা—এই সবই…
‘ন্যাচারাল ফরেস্টস অফ দ্য ওয়ার্ল্ড ২০২০’ ১০-মিটার রেজোলিউশনে ২০২০ সালের জন্য প্রাকৃতিক বনের সম্ভাবনার একটি বৈশ্বিক মানচিত্র প্রদান করে। এটি ইউরোপীয় ইউনিয়নের বন উজাড় নিয়ন্ত্রণ আইন (EUDR) এবং বন সংরক্ষণ ও পর্যবেক্ষণের অন্যান্য প্রচেষ্টার মতো উদ্যোগগুলোকে সমর্থন করার জন্য তৈরি করা হয়েছিল। মানচিত্রটি…
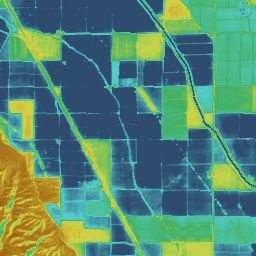
বায়ুমণ্ডল-ভূমি বিনিময় বিপরীত / বায়ুমণ্ডল-ভূমি বিনিময় বিপরীতের বিভাজন (ALEXI/DisALEXI)। OpenET ফ্রেমওয়ার্কের অংশ হিসেবে DisALEXI-কে Google Earth Engine-এ পোর্ট করা হয়েছিল। বেসলাইন ALEXI/DisALEXI মডেলের কাঠামোটি অ্যান্ডারসন প্রমুখ (২০১২, ২০১৮) দ্বারা বর্ণিত হয়েছে। ALEXI বাষ্পীভবন (ET) মডেলটি বিশেষভাবে সময় ব্যবহার করে…
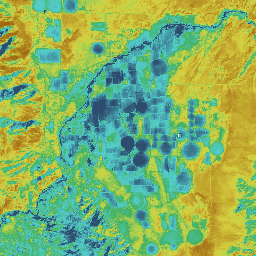
ওপেনইটি ডেটাসেটে বাষ্পীভবন (ET) প্রক্রিয়ার মাধ্যমে ভূপৃষ্ঠ থেকে বায়ুমণ্ডলে স্থানান্তরিত মোট জলের পরিমাণ সম্পর্কিত উপগ্রহ-ভিত্তিক ডেটা অন্তর্ভুক্ত রয়েছে। ওপেনইটি একাধিক উপগ্রহ-চালিত মডেল থেকে ET ডেটা সরবরাহ করে এবং এছাড়াও একটি একক "এনসেম্বল ভ্যালু" গণনা করে…
প্রিস্টলি-টেলর জেট প্রোপালশন ল্যাবরেটরি (পিটি-জেপিএল)। ওপেনইটি (OpenET) কাঠামোর মধ্যে পিটি-জেপিএল মডেলের মূল গঠনপ্রণালীটি ফিশার এট আল. (২০০৮)-এ বর্ণিত মূল গঠনপ্রণালী থেকে পরিবর্তিত হয়নি। তবে, পিটি-জেপিএল-এর মডেল ইনপুট এবং সময় একীকরণে উন্নতি ও হালনাগাদ করা হয়েছে…
স্যাটেলাইট ইরিগেশন ম্যানেজমেন্ট সাপোর্ট (SIMS)। নাসা স্যাটেলাইট ইরিগেশন ম্যানেজমেন্ট সাপোর্ট (SIMS) মডেলটি মূলত সেচকৃত জমি থেকে শস্য গুণাঙ্ক এবং বাষ্পীভবন (ET)-এর স্যাটেলাইট ম্যাপিংকে সমর্থন করার জন্য এবং সেচ সময়সূচী ও আঞ্চলিক মূল্যায়নে ব্যবহারের জন্য এই ডেটার সহজলভ্যতা বাড়াতে তৈরি করা হয়েছিল…
অপারেশনাল সিম্পলিফাইড সারফেস এনার্জি ব্যালেন্স (SSEBop)। সেনে প্রমুখ (২০১৩, ২০১৭) কর্তৃক উদ্ভাবিত অপারেশনাল সিম্পলিফাইড সারফেস এনার্জি ব্যালেন্স (SSEBop) মডেলটি হলো একটি তাপ-ভিত্তিক সরলীকৃত ভূপৃষ্ঠ শক্তি মডেল, যা স্যাটেলাইট সাইক্রোমেট্রির নীতির উপর ভিত্তি করে প্রকৃত বাষ্পীভবন ও প্রস্বেদন (ET) অনুমান করার জন্য ব্যবহৃত হয় (সেনে ২০১৮)। ওপেনইটি এসএসইবপ (OpenET SSEBop) বাস্তবায়নটি ব্যবহার করে…
অপারেশনাল সিম্পলিফাইড সারফেস এনার্জি ব্যালেন্স (SSEBop)। অপারেশনাল সিম্পলিফাইড সারফেস এনার্জি ব্যালেন্স (SSEBop) মডেল (সেনে প্রমুখ, ২০১৩; ২০২৩) হলো স্যাটেলাইট সাইক্রোমেট্রির নীতি ব্যবহার করে প্রকৃত বাষ্পীভবন (ET) অনুমানের জন্য একটি তাপীয় ভিত্তিক পদ্ধতি (সেনে, ২০১৮)। এটি অন্যতম প্রধান মডেল হিসেবে...
গুগল আর্থ ইঞ্জিনে ইন্টারনালাইজড ক্যালিব্রেশন মডেলের (eeMETRIC) উচ্চ রেজোলিউশনে বাষ্পীভবন ম্যাপিং বাস্তবায়ন করা হয়েছে। eeMETRIC, অ্যালেন এট আল. (২০০৭; ২০১৫) এবং অ্যালেন এট আল. (২০১৩বি)-এর উন্নত METRIC অ্যালগরিদম এবং প্রক্রিয়া প্রয়োগ করে, যেখানে ভূপৃষ্ঠের নিকটবর্তী বায়ুর তাপমাত্রার মধ্যে একটি অনন্য সম্পর্ক রয়েছে…
Google Earth Engine-এ ভূমির জন্য পৃষ্ঠ শক্তি ভারসাম্য অ্যালগরিদম (SEBAL) মডেলের বাস্তবায়ন। বর্তমান geeSEBAL সংস্করণের একটি সংক্ষিপ্ত বিবরণ Laipelt et al. (2021)-এ পাওয়া যাবে, যা Bastiaanssen et al. (1998) দ্বারা বিকশিত মূল অ্যালগরিদমগুলির উপর ভিত্তি করে তৈরি। OpenET geeSEBAL …
ওভারচার ম্যাপস প্লেসেস থিমটিতে বাস্তব জগতের বিভিন্ন সত্তার ৬৪ মিলিয়নেরও বেশি পয়েন্ট উপস্থাপনা রয়েছে: ব্যবসা প্রতিষ্ঠান, স্কুল, হাসপাতাল, ধর্মীয় প্রতিষ্ঠান, ল্যান্ডমার্ক, পর্বতশৃঙ্গ এবং আরও অনেক কিছু। প্রতিটি স্থানের রেকর্ডে অবস্থানের স্থানাঙ্ক, নাম, বিভাগ, যোগাযোগের তথ্য (ওয়েবসাইট, সোশ্যাল মিডিয়া, ইমেল, ফোন), ব্র্যান্ডের তথ্য, ঠিকানা এবং আরও অনেক কিছু অন্তর্ভুক্ত থাকে।
ওয়া হলো ভূস্থির (GEO) স্যাটেলাইট পর্যবেক্ষণ থেকে প্রাপ্ত একটি প্রায়-বৈশ্বিক, উচ্চ-রেজোলিউশনের বৃষ্টিপাত অনুমানের ডেটাসেট। ওয়া মডেলটি GOES-16/18, Meteosat-9/10, এবং Himawari-8/9 সহ GEO স্যাটেলাইটের একটি নক্ষত্রপুঞ্জ থেকে দৃশ্যমান এবং অবলোহিত (VIS-IR) চ্যানেলের সম্পূর্ণ পরিসর ব্যবহার করে বৃষ্টিপাতের অনুমান তৈরি করে, যা …
PML_V2.2a: যুগপৎ বাষ্পীভবন ও প্রস্বেদন এবং মোট প্রাথমিক উৎপাদন (MODIS সংস্করণ)
ডেটাসেটটি লার্জ স্কেল হাইড্রোলজি ল্যাব দ্বারা তৈরি করা হয়েছে, যা প্রক্রিয়া-ভিত্তিক মডেলিংয়ের সাথে বহু-উৎস থেকে প্রাপ্ত ভূ-পর্যবেক্ষণের সমন্বয় করে বৈশ্বিক ও আঞ্চলিক জলচক্র গবেষণাকে এগিয়ে নিয়ে যাওয়ার ক্ষেত্রে বিশেষায়িত। PML-V2.2a (MODIS সংস্করণ) পণ্যটি একটি নির্দিষ্ট হারে বৈশ্বিক স্থলজ বাষ্পীভবন (ET) এবং মোট প্রাথমিক উৎপাদন (GPP) প্রদান করে…
PML_V2.2a: যুগপৎ বাষ্পীভবন ও প্রস্বেদন এবং মোট প্রাথমিক উৎপাদন (VIIRS সংস্করণ)
ডেটাসেটটি লার্জ স্কেল হাইড্রোলজি ল্যাব দ্বারা তৈরি করা হয়েছে, যা প্রক্রিয়া-ভিত্তিক মডেলিংয়ের সাথে বহু-উৎস থেকে প্রাপ্ত ভূ-পর্যবেক্ষণের সমন্বয় করে বৈশ্বিক ও আঞ্চলিক জলচক্র গবেষণাকে এগিয়ে নিয়ে যাওয়ার ক্ষেত্রে বিশেষায়িত। PML-V2.2a (VIIRS সংস্করণ) পণ্যটি একটি নির্দিষ্ট হারে বৈশ্বিক স্থলজ বাষ্পীভবন (ET) এবং মোট প্রাথমিক উৎপাদন (GPP) প্রদান করে…
এই চিত্র সংগ্রহটি প্রতি-পিক্সেল ভিত্তিতে একটি আনুমানিক সম্ভাবনা প্রদান করে যে, অন্তর্নিহিত এলাকাটি পণ্য দ্বারা অধিকৃত। এই সম্ভাবনার অনুমানগুলো ১০ মিটার রেজোলিউশনে প্রদান করা হয়েছে এবং একটি মেশিন লার্নিং মডেল দ্বারা তৈরি করা হয়েছে। বিস্তারিত জানতে, ফরেস্ট ডেটা পার্টনারশিপ-এর প্রযুক্তিগত ডকুমেন্টেশন দেখুন…
This image collection provides estimated per-pixel probability that the underlying area is occupied by the commodity. The probability estimates are provided at 10 meter resolution, and have been generated by a machine learning model. For details, see the technical documentation on the Forest Data Partnership …
SCANFI: the Spatialized CAnadian National Forest Inventory data product1.2
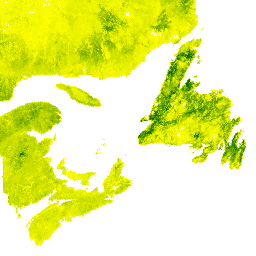
This data publication contains a set of 30m resolution raster files representing 2020 Canadian wall-to-wall maps of broad land cover type, forest canopy height, degree of crown closure and aboveground tree biomass, along with species composition of several major tree species. The Spatialized CAnadian National …
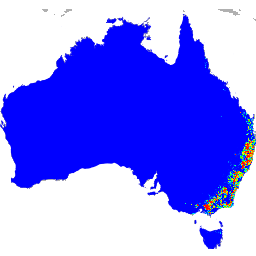
These species distribution model outputs, developed by Google in collaboration with QCIF and EcoCommons, represent estimates of species' relative occurrence likelihoods (ie, higher values indicate a higher likelihood that the species would be detected at a location, for a given survey methodology and given survey …
TCB: Malaria Atlas Project Gap-Filled Tasseled Cap Brightness (8-Daily 1km)
This gap-filled Tasseled Cap Brightness (TCB) dataset was created by applying the tasseled-cap equations defined in Lobser and Cohen (2007) to MODIS BRDF-corrected imagery (MCD43B4). The resulting data were gap-filled using the approach outlined in Weiss et al. (2014) to eliminate missing data caused by …
TCB: Malaria Atlas Project Gap-Filled Tasseled Cap Brightness (Annual 1km)
This gap-filled Tasseled Cap Brightness (TCB) dataset was created by applying the tasseled-cap equations defined in Lobser and Cohen (2007) to MODIS BRDF-corrected imagery (MCD43B4). The resulting data were gap-filled using the approach outlined in Weiss et al. (2014) to eliminate missing data caused by …
TCB: Malaria Atlas Project Gap-Filled Tasseled Cap Brightness (Monthly 1km)
This gap-filled Tasseled Cap Brightness (TCB) dataset was created by applying the tasseled-cap equations defined in Lobser and Cohen (2007) to MODIS BRDF-corrected imagery (MCD43B4). The resulting data were gap-filled using the approach outlined in Weiss et al. (2014) to eliminate missing data caused by …
TCW: Malaria Atlas Project Gap-Filled Tasseled Cap Wetness (8-Daily 1km)
This gap-filled Tasseled Cap Wetness (TCW) dataset was created by applying the tasseled-cap equations defined in Lobser and Cohen (2007) to MODIS BRDF-corrected imagery (MCD43B4). The resulting data were gap-filled using the approach outlined in Weiss et al. (2014) to eliminate missing data caused by …
TCW: Malaria Atlas Project Gap-Filled Tasseled Cap Wetness (Annual 1km)
This gap-filled Tasseled Cap Wetness (TCW) dataset was created by applying the tasseled-cap equations defined in Lobser and Cohen (2007) to MODIS BRDF-corrected imagery (MCD43B4). The resulting data were gap-filled using the approach outlined in Weiss et al. (2014) to eliminate missing data caused by …
TCW: Malaria Atlas Project Gap-Filled Tasseled Cap Wetness (Monthly 1km)
This gap-filled Tasseled Cap Wetness (TCW) dataset was created by applying the tasseled-cap equations defined in Lobser and Cohen (2007) to MODIS BRDF-corrected imagery (MCD43B4). The resulting data were gap-filled using the approach outlined in Weiss et al. (2014) to eliminate missing data caused by …
USFS Landscape Change Monitoring System v2025-11 (CONUS and OCONUS)
This product is part of the Landscape Change Monitoring System (LCMS) data suite. It shows LCMS-modeled change, land cover, and/or land use classes for each year and covers the Conterminous United States (CONUS) as well as areas outside the CONUS (OCONUS) including Alaska (AK), Puerto …
The Tree Canopy Cover (TCC) data suite, produced by the United States Department of Agriculture, Forest Service (USFS), are annual remote sensing-based map outputs spanning from 1985-2025. These data support the National Land Cover Database (NLCD) project, which is managed by the US Geological Survey …
WDKBA: World Database of Key Biodiversity Areas (KBAs) - March 2026
If you are interested in accessing the KBA dataset please complete the KBA data request form which will allow access directly in GEE once approved. Key Biodiversity Areas (KBAs) are 'sites contributing significantly to the global persistence of biodiversity', in terrestrial, freshwater and marine ecosystems. …
WRI/Google DeepMind Global Drivers of Forest Loss 2001-2022 v1.0
This dataset maps the dominant driver of tree cover loss from 2001-2022 globally at 1 km resolution. Produced by the World Resources Institute (WRI) and Google DeepMind, the data were developed using a global neural network model (ResNet) trained on a set of samples collected …
WRI/Google DeepMind Global Drivers of Forest Loss 2001-2023 v1.1
This dataset maps the dominant driver of tree cover loss from 2001-2023 globally at 1 km resolution. Produced by the World Resources Institute (WRI) and Google DeepMind, the data were developed using a global neural network model (ResNet) trained on a set of samples collected …
WRI/Google DeepMind Global Drivers of Forest Loss 2001-2024 v1.2
This dataset maps the dominant driver of tree cover loss from 2001-2024 globally at 1 km resolution. Produced by the World Resources Institute (WRI) and Google DeepMind, the data were developed using a global neural network model (ResNet) trained on a set of samples collected …
WRI/Google DeepMind Global Drivers of Forest Loss 2001-2025 v1.3
This dataset maps the dominant driver of tree cover loss from 2001-2025 globally at 1 km resolution. Produced by the World Resources Institute (WRI) and Google DeepMind, the data were developed using a global neural network model (ResNet) trained on a set of samples collected …
WeatherNext 2 is an experimental dataset of global medium-range ensemble weather forecasts produced by an operational version of Google DeepMind's Functional Network Generative weather model. The experimental dataset includes real-time and historic data. Real-time data is any data that relates to a time that is …
WeatherNext 2 Mean is the mean of 64 ensembles of an experimental dataset of global medium-range ensemble weather forecasts produced by an operational version of Google DeepMind's Functional Network Generative weather model. For a dataset containing all ensemble members, please see the (non-mean) WeatherNext 2 …
WeatherNext 3 (0.05°) dataset is an experimental dataset of global medium-range ensemble weather forecasts by Google DeepMind and Google Research, produced by an operational version of the model described in: WeatherNext 3: Increasing resolution and performance of global weather models with raw observations. Data Access …
WeatherNext 3 (0.1°) dataset is an experimental dataset of global medium-range ensemble weather forecasts by Google DeepMind and Google Research, produced by an operational version of the model described in: WeatherNext 3: Increasing resolution and performance of global weather models with raw observations. Data Access …
This image collection provides estimated per-pixel probability that the underlying area is occupied by the commodity. The probability estimates are provided at 10 meter resolution, and have been generated by a machine learning model. For details, see the technical documentation on the Forest Data Partnership …
EVI: Malaria Atlas Project Gap-Filled Enhanced Vegetation Index (8-Daily 1km)
The underlying dataset for this Enhanced Vegetation Index (EVI) product is MODIS BRDF-corrected imagery (MCD43B4), which was gap-filled using the approach outlined in Weiss et al. (2014) to eliminate missing data caused by factors such as cloud cover. After gap-filling the data was clipped to …
EVI: Malaria Atlas Project Gap-Filled Enhanced Vegetation Index (Annual 1km)
The underlying dataset for this Enhanced Vegetation Index (EVI) product is MODIS BRDF-corrected imagery (MCD43B4), which was gap-filled using the approach outlined in Weiss et al. (2014) to eliminate missing data caused by factors such as cloud cover. After gap-filling the data was clipped to …
EVI: Malaria Atlas Project Gap-Filled Enhanced Vegetation Index (Monthly 1km)
The underlying dataset for this Enhanced Vegetation Index (EVI) product is MODIS BRDF-corrected imagery (MCD43B4), which was gap-filled using the approach outlined in Weiss et al. (2014) to eliminate missing data caused by factors such as cloud cover. After gap-filling the data was clipped to …
The Farmscapes 2020 dataset provides high-resolution (25cm) probability maps for three key semi-natural features within England's agricultural landscapes: hedgerows, woodland, and stone walls. This dataset was developed in collaboration with the Leverhulme Centre for Nature Recovery at Oxford to serve as a baseline for applications …
This is the vectorised version of the Farmscapes 2020 raster dataset. It provides polygon geometries representing fine-scale semi-natural landscape features (specifically hedgerows, woodland, and stone walls) across England's agricultural landscapes. This dataset was developed in collaboration with the Oxford Leverhulme Centre for Nature Recovery to …
This image provides a per-pixel score (in [0, 1]) that indicates whether the pixel area is occupied by undisturbed forest in year 2020. These scores are provided at 30 meter resolution, and have been generated by a convergence of evidence approach to combining multiple forest …
The Forest Typology (ForTy) v1 dataset consists of a global per-class probability map at 10 m resolution covering all land areas between 65°S and 84°N latitude for the year 2020. The six-class typology is aligned with FAO and EU Deforestation Regulation (EUDR) definitions: Class 1 …
This dataset provides global annual dominant class maps of grasslands (cultivated and natural/semi-natural) from 2000 to 2022 at 30-m spatial resolution. Produced by the Land & Carbon Lab Global Pasture Watch initiative, the mapped grassland extent includes any land cover type, which contains at least …
GPW Annual Probabilities of Cultivated Grasslands v1
This dataset provides global annual probability maps of cultivated grassland from 2000 to 2022 at 30-m spatial resolution. Produced by the Land & Carbon Lab Global Pasture Watch initiative, the mapped grassland extent includes any land cover type, which contains at least 30% of dry …
GPW Annual Probabilities of Natural/Semi-natural Grasslands v1
This dataset provides global annual probability maps of natural/semi-natural grassland from 2000 to 2022 at 30-m spatial resolution. Produced by the Land & Carbon Lab Global Pasture Watch initiative, the mapped grassland extent includes any land cover type, which contains at least 30% of dry …
This dataset provides global livestock headcount from 2000 to 2022 at 1-km spatial resolution. Produced by the Land & Carbon Lab's Global Pasture Watch initiative, the current dataset provides global headcount predictions adjusted to FAOSTAT national statistics. The dataset is based on the largest known …
This dataset provides global median vegetation height from 2000 at 30-m spatial resolution. Produced by the Land & Carbon Lab's Global Pasture Watch initiative, this dataset provides median vegetation height values (50th percentile) globally at 30-m spatial resolution from 2000 onwards. The dataset is based …
This dataset provides global uncalibrated EO-based Gross Primary Productivity from 2000 at 30-m spatial resolution. Produced by the Land & Carbon Lab Global Pasture Watch initiative, the current dataset provides Gross Primary Productivity (GPP) values globally at 30-m spatial resolution from 2000 onwards. GPP values …
The CGMD-Extent30 (Continuous Global Mangrove Dynamics-Annual Mangrove Extent at 30-m resolution) dataset provides global annual mangrove extent from 1984 to 2023. The dataset is distributed as a single Earth Engine FeatureCollection, with each feature representing a mapped mangrove polygon for a specific year. The dataset …
Global Annual Mangrove Fractional Canopy Cover (1984-2023)
This dataset provides global annual mangrove fractional canopy cover (FCC) at 30-m spatial resolution from 1984 to 2023 to support large-scale analyses of long-term mangrove dynamics, including canopy degradation and recovery, blue carbon assessment, and coastal ecosystem monitoring. FCC quantifies the proportion of each Landsat …
LST Day: Malaria Atlas Project Gap-Filled Daytime Land Surface Temperature (8-Daily 1km)
Daytime Land Surface Temperature (LST) are derived from the ~1km MODIS MOD11A2 v6.1 products. The 8-daily composites are converted to degrees Celsius and then gap-filled using the approach outlined in Weiss et al (2014) to eliminate missing data caused by factors such as cloud cover. …
LST Day: Malaria Atlas Project Gap-Filled Daytime Land Surface Temperature (Annual 1km)
Daytime Land Surface Temperature (LST) are derived from the ~1km MODIS MOD11A2 v6.1 products. The 8-daily composites are converted to degrees Celsius and then gap-filled using the approach outlined in Weiss et al (2014) to eliminate missing data caused by factors such as cloud cover. …
LST Day: Malaria Atlas Project Gap-Filled Daytime Land Surface Temperature (Monthly 1km)
Daytime Land Surface Temperature (LST) are derived from the ~1km MODIS MOD11A2 v6.1 products. The 8-daily composites are converted to degrees Celsius and then gap-filled using the approach outlined in Weiss et al (2014) to eliminate missing data caused by factors such as cloud cover. …
LST Night: Malaria Atlas Project Gap-Filled Nighttime Land Surface Temperature (8-Daily 1km)
Nighttime Land Surface Temperature (LST) are derived from the ~1km MODIS MOD11A2 v6.1 products. The 8-daily composites are converted to degrees Celsius and then gap-filled using the approach outlined in Weiss et al (2014) to eliminate missing data caused by factors such as cloud cover. …
LST Night: Malaria Atlas Project Gap-Filled Nighttime Land Surface Temperature (Annual 1km)
Nighttime Land Surface Temperature (LST) are derived from the ~1km MODIS MOD11A2 v6.1 products. The 8-daily composites are converted to degrees Celsius and then gap-filled using the approach outlined in Weiss et al (2014) to eliminate missing data caused by factors such as cloud cover. …
LST Night: Malaria Atlas Project Gap-Filled Nighttime Land Surface Temperature (Monthly 1km)
Nighttime Land Surface Temperature (LST) are derived from the ~1km MODIS MOD11A2 v6.1 products. The 8-daily composites are converted to degrees Celsius and then gap-filled using the approach outlined in Weiss et al (2014) to eliminate missing data caused by factors such as cloud cover. …
MAPL-EMIT: Modeled Methane Enhancement and Plume Probability
The Methane Analysis and Plume Localization with EMIT (MAPL-EMIT) enhancements dataset provides high-resolution (60m) methane (CH₄) enhancement maps and plume probabilities derived from radiance data captured by the Earth Surface Mineral Dust Source Investigation (EMIT) instrument which were generated and released as part of the …
The Methane Analysis and Plume Localization with EMIT (MAPL-EMIT) dataset provides high-resolution (60m) methane (CH₄) plume complex maps and plume source locations derived from radiance data captured by the Earth Surface Mineral Dust Source Investigation (EMIT) instrument. Methane point-source emissions are a major driver of …
Malaria Atlas Project Accessibility to Cities 2015
This global accessibility map enumerates land-based travel time to the nearest densely-populated area for all areas between 85 degrees north and 60 degrees south for a nominal year 2015. Densely-populated areas are defined as contiguous areas with 1,500 or more inhabitants per square kilometer or …
Malaria Atlas Project Accessibility to Healthcare 2019
This global accessibility map enumerates land-based travel time (in minutes) to the nearest hospital or clinic for all areas between 85 degrees north and 60 degrees south for a nominal year 2019. Major data collection efforts underway by OpenStreetMap, Google Maps, and academic researchers have …
Malaria Atlas Project Accessibility to Healthcare 2019 (Walking Only)
This global accessibility map enumerates land-based travel time (in minutes) to the nearest hospital or clinic for all areas between 85 degrees north and 60 degrees south for a nominal year 2019. This surface is based on "walking-only" travel time, using non-motorized means of transportation …
Malaria Atlas Project Global Friction Surface 2015
Friction Surface 2019". This global friction surface enumerates land-based travel speed for all land pixels between 85 degrees north and 60 degrees south for a nominal year 2015. This map was produced through a collaboration between the University of Oxford Malaria Atlas Project (MAP), Google, …
Malaria Atlas Project Global Friction Surface 2019
This global friction surface enumerates land-based travel speed for all land pixels between 85 degrees north and 60 degrees south for a nominal year 2019. This map was produced through a collaboration between MAP (University of Oxford), Telethon Kids Institute (Perth, Australia), Google, and the …
Malaria Atlas Project Global Friction Surface 2019 (Walking Only)
This global friction surface enumerates land-based travel speed for all land pixels between 85 degrees north and 60 degrees south for a nominal year 2019. This surface is based on "walking-only" travel speed, using non-motorized means of transportation only. This map was produced through a …
MapBiomas Land Use and Land Cover (LULC) dataset for Bolivia is produced annually by the MapBiomas Project using Landsat satellite imagery and machine learning classification techniques. The dataset provides consistent annual land cover maps at 30-meter resolution covering the period from 1985 to 2024. Bolivia's …
MapBiomas Land Use and Land Cover (LULC) dataset for Brazil is produced annually by the MapBiomas Project using Landsat satellite imagery and machine learning classification techniques. The dataset provides consistent, thematically detailed maps at 30-meter resolution, covering multiple decades and updated each year. Each image …
MapBiomas Land Use and Land Cover (LULC) dataset for Ecuador is produced annually by the MapBiomas Project using Landsat satellite imagery and machine learning classification techniques. The dataset provides consistent annual land cover maps at 30-meter resolution covering the period from 1985 to 2024. Ecuador's …
This dataset provides geospatial data for the total column dry air mole fraction of methane in the atmosphere, "XCH4", as observed by the MethaneAIR imaging spectrometer. XCH4 is defined as the total column amount (number of molecules) of methane ("CH4") divided by the total amount …
This dataset provides data for high-emitting methane point source detections (kg/hr) over 13 oil and gas or coal extraction areas from Colorado, New Mexico, and Texas in the west to Pennsylvania, Ohio, and West Virginia in the east, plus three urban areas (New York City, …
This early "Public Preview" dataset provides geospatial data for the column-averaged dry-air mole fraction of methane in the atmosphere, "XCH4", retrieved from measurements by the MethaneSAT imaging spectrometer. XCH4 is defined as the total column amount (number of molecules above a unit surface area) of …
The dispersed area emissions model is still in development and not representative of a final product. This early "Public Preview" dataset provides high precision data for methane emissions from dispersed area sources. These emissions data come from the Appalachian, Permian, and Uinta basins in the …
The dispersed area emissions model is still in development and not representative of a final product. This early "Public Preview" dataset provides high precision data for methane emissions from dispersed area sources. These novel measurements demonstrate the importance of quantifying total methane emissions with high …
This early "Public Preview" dataset provides high precision data for methane emissions from discrete point sources. These methane emission fluxes were produced using a point source detection and emissions quantification framework specialized to exploit the high spatial resolution, wide spatial coverage, and high precision of …
Height of the top of canopy above bare earth (Canopy Height Model; CHM). The CHM is derived from the NEON LiDAR point cloud and is generated by creating a continuous surface of canopy height estimates across the entire spatial domain of the LiDAR survey. The …
Modelled canopy nitrogen concentration calibrated with NEON plant foliar chemistry observations and predicted with L1 surface directional reflectance, derived from the NEON Imaging Spectrometer (NIS). Bands include 1) canopy nitrogen percent, 2) canopy nitrogen model uncertainty, 3) classification result for needle vs. non-needle model and …
Digital models of the surface (DSM) and terrain (DTM) derived from NEON LiDAR data. DSM: Surface features (topographic information with vegetation and man-made structures present). DTM: Bare earth elevation (topographic information with vegetation and man-made structures removed). Images are given in meters above mean sea …
High resolution Red-Green-Blue (RGB) orthorectified camera images mosaicked and output onto a fixed, uniform spatial grid using nearest-neighbor resampling; spatial resolution is 0.1 m. The digital camera is part of a suite of instruments on the NEON Airborne Observation Platform (AOP) that also includes a …
The NEON AOP Surface Bidirectional Reflectance is a hyperspectral VSWIR (visible to shortwave infrared) data product, containing 426 bands spanning wavelengths from ~380 nm to 2510 nm. Reflectance is scaled by a factor of 10000. Wavelengths between 1340-1445 nm and 1790-1955 nm are set to …
The NEON AOP Surface Directional Reflectance is a hyperspectral VSWIR (visible to shortwave infrared) data product, containing 426 bands spanning wavelengths from ~380 nm to 2510 nm. Reflectance is scaled by a factor of 10000. Wavelengths between 1340-1445 nm and 1790-1955 nm are set to …
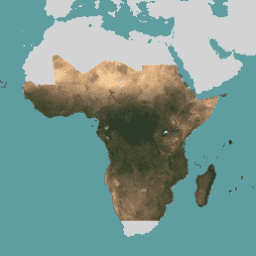
NICFI Satellite Data Program Basemaps for Tropical Forest Monitoring - Africa
This image collection provides access to high-resolution satellite monitoring of the tropics for the primary purpose of reducing and reversing the loss of tropical forests, contributing to combating climate change, conserving biodiversity, contributing to forest regrowth, restoration and enhancement, and facilitating sustainable development, all of …
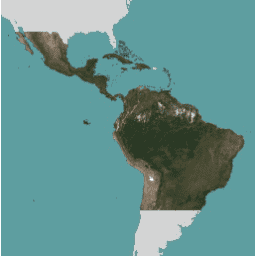
NICFI Satellite Data Program Basemaps for Tropical Forest Monitoring - Americas
This image collection provides access to high-resolution satellite monitoring of the tropics for the primary purpose of reducing and reversing the loss of tropical forests, contributing to combating climate change, conserving biodiversity, contributing to forest regrowth, restoration and enhancement, and facilitating sustainable development, all of …
NICFI Satellite Data Program Basemaps for Tropical Forest Monitoring - Asia
This image collection provides access to high-resolution satellite monitoring of the tropics for the primary purpose of reducing and reversing the loss of tropical forests, contributing to combating climate change, conserving biodiversity, contributing to forest regrowth, restoration and enhancement, and facilitating sustainable development, all of …
Natural Forests of the World 2020, provides a global map of natural forest probability for the year 2020 at a 10-meter resolution. It was developed to support initiatives like the European Union's Deforestation Regulation (EUDR) and other efforts for forest conservation and monitoring. The map …
Atmosphere-Land Exchange Inverse / Disaggregation of the Atmosphere-Land Exchange Inverse (ALEXI/DisALEXI). DisALEXI was ported to Google Earth Engine as part of the OpenET framework. The baseline ALEXI/DisALEXI model structure is described by Anderson et al. (2012, 2018). The ALEXI evapotranspiration (ET) model specifically uses time …
The OpenET dataset includes satellite-based data on the total amount of water that is transferred from the land surface to the atmosphere through the process of evapotranspiration (ET). OpenET provides ET data from multiple satellite-driven models, and also calculates a single "ensemble value" from the …
Priestley-Taylor Jet Propulsion Laboratory (PT-JPL). The core formulation of the PT-JPL model within the OpenET framework has not changed from the original formulation detailed in Fisher et al. (2008). However, enhancements and updates to model inputs and time integration for PT-JPL were made to take …
Satellite Irrigation Management Support (SIMS). The NASA Satellite Irrigation Management Support (SIMS) model was originally developed to support satellite mapping of crop coefficients and evapotranspiration (ET) from irrigated lands and to increase access to this data to support use in irrigation scheduling and regional assessment …
Operational Simplified Surface Energy Balance (SSEBop). The Operational Simplified Surface Energy Balance (SSEBop) model by Senay et al. (2013, 2017) is a thermal-based simplified surface energy model for estimating actual ET based on the principles of satellite psychrometry (Senay 2018). The OpenET SSEBop implementation uses …
Operational Simplified Surface Energy Balance (SSEBop). The Operational Simplified Surface Energy Balance (SSEBop) model (Senay et al., 2013; 2023) is a thermal based approach for estimating actual evapotranspiration (ET) using the principles of satellite psychrometry (Senay, 2018). As one of the core models in the …
Google Earth Engine implementation of the Mapping Evapotranspiration at high Resolution with Internalized Calibration model (eeMETRIC). eeMETRIC applies the advanced METRIC algorithms and process of Allen et al. (2007; 2015) and Allen et al. (2013b), where a singular relationship between the near surface air temperature …
Google Earth Engine implementation of the Surface Energy Balance Algorithm for Land (SEBAL) model. An overview of the current geeSEBAL version can be found in Laipelt et al. (2021), which is based on the original algorithms developed by Bastiaanssen et al. (1998). The OpenET geeSEBAL …
The Overture Maps Places theme contains more than 64 million point representations of real-world entities: businesses, schools, hospitals, religious organizations, landmarks, mountain peaks, and much more. Each place record includes location coordinates, names, categories, contact information (websites, social media, emails, phones), brand information, addresses, and …
Oya is a quasi-global, high-resolution precipitation estimation dataset derived from geostationary (GEO) satellite observations. The Oya model utilizes the full spectrum of visible and infrared (VIS-IR) channels from a constellation of GEO satellites — including GOES-16/18, Meteosat-9/10, and Himawari-8/9 — to generate precipitation estimates covering …
PML_V2.2a: Coupled Evapotranspiration and Gross Primary Product (MODIS Edition)
The dataset is produced by the Large Scale Hydrology Lab, which specializes in advancing global and regional water cycle research by synthesizing multi-source Earth observations with process-based modeling. The PML-V2.2a (MODIS Edition) product provides global terrestrial evapotranspiration (ET) and gross primary production (GPP) at a …
PML_V2.2a: Coupled Evapotranspiration and Gross Primary Product (VIIRS Edition)
The dataset is produced by the Large Scale Hydrology Lab, which specializes in advancing global and regional water cycle research by synthesizing multi-source Earth observations with process-based modeling. The PML-V2.2a (VIIRS Edition) product provides global terrestrial evapotranspiration (ET) and gross primary production (GPP) at a …
This image collection provides estimated per-pixel probability that the underlying area is occupied by the commodity. The probability estimates are provided at 10 meter resolution, and have been generated by a machine learning model. For details, see the technical documentation on the Forest Data Partnership …
SCANFI: the Spatialized CAnadian National Forest Inventory data product1.2
This data publication contains a set of 30m resolution raster files representing 2020 Canadian wall-to-wall maps of broad land cover type, forest canopy height, degree of crown closure and aboveground tree biomass, along with species composition of several major tree species. The Spatialized CAnadian National …
These species distribution model outputs, developed by Google in collaboration with QCIF and EcoCommons, represent estimates of species' relative occurrence likelihoods (ie, higher values indicate a higher likelihood that the species would be detected at a location, for a given survey methodology and given survey …
TCB: Malaria Atlas Project Gap-Filled Tasseled Cap Brightness (8-Daily 1km)
This gap-filled Tasseled Cap Brightness (TCB) dataset was created by applying the tasseled-cap equations defined in Lobser and Cohen (2007) to MODIS BRDF-corrected imagery (MCD43B4). The resulting data were gap-filled using the approach outlined in Weiss et al. (2014) to eliminate missing data caused by …
TCB: Malaria Atlas Project Gap-Filled Tasseled Cap Brightness (Annual 1km)
This gap-filled Tasseled Cap Brightness (TCB) dataset was created by applying the tasseled-cap equations defined in Lobser and Cohen (2007) to MODIS BRDF-corrected imagery (MCD43B4). The resulting data were gap-filled using the approach outlined in Weiss et al. (2014) to eliminate missing data caused by …
TCB: Malaria Atlas Project Gap-Filled Tasseled Cap Brightness (Monthly 1km)
This gap-filled Tasseled Cap Brightness (TCB) dataset was created by applying the tasseled-cap equations defined in Lobser and Cohen (2007) to MODIS BRDF-corrected imagery (MCD43B4). The resulting data were gap-filled using the approach outlined in Weiss et al. (2014) to eliminate missing data caused by …
TCW: Malaria Atlas Project Gap-Filled Tasseled Cap Wetness (8-Daily 1km)
This gap-filled Tasseled Cap Wetness (TCW) dataset was created by applying the tasseled-cap equations defined in Lobser and Cohen (2007) to MODIS BRDF-corrected imagery (MCD43B4). The resulting data were gap-filled using the approach outlined in Weiss et al. (2014) to eliminate missing data caused by …
TCW: Malaria Atlas Project Gap-Filled Tasseled Cap Wetness (Annual 1km)
This gap-filled Tasseled Cap Wetness (TCW) dataset was created by applying the tasseled-cap equations defined in Lobser and Cohen (2007) to MODIS BRDF-corrected imagery (MCD43B4). The resulting data were gap-filled using the approach outlined in Weiss et al. (2014) to eliminate missing data caused by …
TCW: Malaria Atlas Project Gap-Filled Tasseled Cap Wetness (Monthly 1km)
This gap-filled Tasseled Cap Wetness (TCW) dataset was created by applying the tasseled-cap equations defined in Lobser and Cohen (2007) to MODIS BRDF-corrected imagery (MCD43B4). The resulting data were gap-filled using the approach outlined in Weiss et al. (2014) to eliminate missing data caused by …
USFS Landscape Change Monitoring System v2025-11 (CONUS and OCONUS)
This product is part of the Landscape Change Monitoring System (LCMS) data suite. It shows LCMS-modeled change, land cover, and/or land use classes for each year and covers the Conterminous United States (CONUS) as well as areas outside the CONUS (OCONUS) including Alaska (AK), Puerto …
The Tree Canopy Cover (TCC) data suite, produced by the United States Department of Agriculture, Forest Service (USFS), are annual remote sensing-based map outputs spanning from 1985-2025. These data support the National Land Cover Database (NLCD) project, which is managed by the US Geological Survey …
WDKBA: World Database of Key Biodiversity Areas (KBAs) - March 2026
If you are interested in accessing the KBA dataset please complete the KBA data request form which will allow access directly in GEE once approved. Key Biodiversity Areas (KBAs) are 'sites contributing significantly to the global persistence of biodiversity', in terrestrial, freshwater and marine ecosystems. …
WRI/Google DeepMind Global Drivers of Forest Loss 2001-2022 v1.0
This dataset maps the dominant driver of tree cover loss from 2001-2022 globally at 1 km resolution. Produced by the World Resources Institute (WRI) and Google DeepMind, the data were developed using a global neural network model (ResNet) trained on a set of samples collected …
WRI/Google DeepMind Global Drivers of Forest Loss 2001-2023 v1.1
This dataset maps the dominant driver of tree cover loss from 2001-2023 globally at 1 km resolution. Produced by the World Resources Institute (WRI) and Google DeepMind, the data were developed using a global neural network model (ResNet) trained on a set of samples collected …
WRI/Google DeepMind Global Drivers of Forest Loss 2001-2024 v1.2
This dataset maps the dominant driver of tree cover loss from 2001-2024 globally at 1 km resolution. Produced by the World Resources Institute (WRI) and Google DeepMind, the data were developed using a global neural network model (ResNet) trained on a set of samples collected …
WRI/Google DeepMind Global Drivers of Forest Loss 2001-2025 v1.3
This dataset maps the dominant driver of tree cover loss from 2001-2025 globally at 1 km resolution. Produced by the World Resources Institute (WRI) and Google DeepMind, the data were developed using a global neural network model (ResNet) trained on a set of samples collected …
WeatherNext 2 is an experimental dataset of global medium-range ensemble weather forecasts produced by an operational version of Google DeepMind's Functional Network Generative weather model. The experimental dataset includes real-time and historic data. Real-time data is any data that relates to a time that is …
WeatherNext 2 Mean is the mean of 64 ensembles of an experimental dataset of global medium-range ensemble weather forecasts produced by an operational version of Google DeepMind's Functional Network Generative weather model. For a dataset containing all ensemble members, please see the (non-mean) WeatherNext 2 …
WeatherNext 3 (0.05°) dataset is an experimental dataset of global medium-range ensemble weather forecasts by Google DeepMind and Google Research, produced by an operational version of the model described in: WeatherNext 3: Increasing resolution and performance of global weather models with raw observations. Data Access …
WeatherNext 3 (0.1°) dataset is an experimental dataset of global medium-range ensemble weather forecasts by Google DeepMind and Google Research, produced by an operational version of the model described in: WeatherNext 3: Increasing resolution and performance of global weather models with raw observations. Data Access …
This image collection provides estimated per-pixel probability that the underlying area is occupied by the commodity. The probability estimates are provided at 10 meter resolution, and have been generated by a machine learning model. For details, see the technical documentation on the Forest Data Partnership …
EVI: Malaria Atlas Project Gap-Filled Enhanced Vegetation Index (8-Daily 1km)
The underlying dataset for this Enhanced Vegetation Index (EVI) product is MODIS BRDF-corrected imagery (MCD43B4), which was gap-filled using the approach outlined in Weiss et al. (2014) to eliminate missing data caused by factors such as cloud cover. After gap-filling the data was clipped to …
EVI: Malaria Atlas Project Gap-Filled Enhanced Vegetation Index (Annual 1km)
The underlying dataset for this Enhanced Vegetation Index (EVI) product is MODIS BRDF-corrected imagery (MCD43B4), which was gap-filled using the approach outlined in Weiss et al. (2014) to eliminate missing data caused by factors such as cloud cover. After gap-filling the data was clipped to …
EVI: Malaria Atlas Project Gap-Filled Enhanced Vegetation Index (Monthly 1km)
The underlying dataset for this Enhanced Vegetation Index (EVI) product is MODIS BRDF-corrected imagery (MCD43B4), which was gap-filled using the approach outlined in Weiss et al. (2014) to eliminate missing data caused by factors such as cloud cover. After gap-filling the data was clipped to …
The Farmscapes 2020 dataset provides high-resolution (25cm) probability maps for three key semi-natural features within England's agricultural landscapes: hedgerows, woodland, and stone walls. This dataset was developed in collaboration with the Leverhulme Centre for Nature Recovery at Oxford to serve as a baseline for applications …
This is the vectorised version of the Farmscapes 2020 raster dataset. It provides polygon geometries representing fine-scale semi-natural landscape features (specifically hedgerows, woodland, and stone walls) across England's agricultural landscapes. This dataset was developed in collaboration with the Oxford Leverhulme Centre for Nature Recovery to …
This image provides a per-pixel score (in [0, 1]) that indicates whether the pixel area is occupied by undisturbed forest in year 2020. These scores are provided at 30 meter resolution, and have been generated by a convergence of evidence approach to combining multiple forest …
The Forest Typology (ForTy) v1 dataset consists of a global per-class probability map at 10 m resolution covering all land areas between 65°S and 84°N latitude for the year 2020. The six-class typology is aligned with FAO and EU Deforestation Regulation (EUDR) definitions: Class 1 …
This dataset provides global annual dominant class maps of grasslands (cultivated and natural/semi-natural) from 2000 to 2022 at 30-m spatial resolution. Produced by the Land & Carbon Lab Global Pasture Watch initiative, the mapped grassland extent includes any land cover type, which contains at least …
GPW Annual Probabilities of Cultivated Grasslands v1
This dataset provides global annual probability maps of cultivated grassland from 2000 to 2022 at 30-m spatial resolution. Produced by the Land & Carbon Lab Global Pasture Watch initiative, the mapped grassland extent includes any land cover type, which contains at least 30% of dry …
GPW Annual Probabilities of Natural/Semi-natural Grasslands v1
This dataset provides global annual probability maps of natural/semi-natural grassland from 2000 to 2022 at 30-m spatial resolution. Produced by the Land & Carbon Lab Global Pasture Watch initiative, the mapped grassland extent includes any land cover type, which contains at least 30% of dry …
This dataset provides global livestock headcount from 2000 to 2022 at 1-km spatial resolution. Produced by the Land & Carbon Lab's Global Pasture Watch initiative, the current dataset provides global headcount predictions adjusted to FAOSTAT national statistics. The dataset is based on the largest known …
This dataset provides global median vegetation height from 2000 at 30-m spatial resolution. Produced by the Land & Carbon Lab's Global Pasture Watch initiative, this dataset provides median vegetation height values (50th percentile) globally at 30-m spatial resolution from 2000 onwards. The dataset is based …
This dataset provides global uncalibrated EO-based Gross Primary Productivity from 2000 at 30-m spatial resolution. Produced by the Land & Carbon Lab Global Pasture Watch initiative, the current dataset provides Gross Primary Productivity (GPP) values globally at 30-m spatial resolution from 2000 onwards. GPP values …
The CGMD-Extent30 (Continuous Global Mangrove Dynamics-Annual Mangrove Extent at 30-m resolution) dataset provides global annual mangrove extent from 1984 to 2023. The dataset is distributed as a single Earth Engine FeatureCollection, with each feature representing a mapped mangrove polygon for a specific year. The dataset …
Global Annual Mangrove Fractional Canopy Cover (1984-2023)
This dataset provides global annual mangrove fractional canopy cover (FCC) at 30-m spatial resolution from 1984 to 2023 to support large-scale analyses of long-term mangrove dynamics, including canopy degradation and recovery, blue carbon assessment, and coastal ecosystem monitoring. FCC quantifies the proportion of each Landsat …
LST Day: Malaria Atlas Project Gap-Filled Daytime Land Surface Temperature (8-Daily 1km)
Daytime Land Surface Temperature (LST) are derived from the ~1km MODIS MOD11A2 v6.1 products. The 8-daily composites are converted to degrees Celsius and then gap-filled using the approach outlined in Weiss et al (2014) to eliminate missing data caused by factors such as cloud cover. …
LST Day: Malaria Atlas Project Gap-Filled Daytime Land Surface Temperature (Annual 1km)
Daytime Land Surface Temperature (LST) are derived from the ~1km MODIS MOD11A2 v6.1 products. The 8-daily composites are converted to degrees Celsius and then gap-filled using the approach outlined in Weiss et al (2014) to eliminate missing data caused by factors such as cloud cover. …
LST Day: Malaria Atlas Project Gap-Filled Daytime Land Surface Temperature (Monthly 1km)
Daytime Land Surface Temperature (LST) are derived from the ~1km MODIS MOD11A2 v6.1 products. The 8-daily composites are converted to degrees Celsius and then gap-filled using the approach outlined in Weiss et al (2014) to eliminate missing data caused by factors such as cloud cover. …
LST Night: Malaria Atlas Project Gap-Filled Nighttime Land Surface Temperature (8-Daily 1km)
Nighttime Land Surface Temperature (LST) are derived from the ~1km MODIS MOD11A2 v6.1 products. The 8-daily composites are converted to degrees Celsius and then gap-filled using the approach outlined in Weiss et al (2014) to eliminate missing data caused by factors such as cloud cover. …
LST Night: Malaria Atlas Project Gap-Filled Nighttime Land Surface Temperature (Annual 1km)
Nighttime Land Surface Temperature (LST) are derived from the ~1km MODIS MOD11A2 v6.1 products. The 8-daily composites are converted to degrees Celsius and then gap-filled using the approach outlined in Weiss et al (2014) to eliminate missing data caused by factors such as cloud cover. …
LST Night: Malaria Atlas Project Gap-Filled Nighttime Land Surface Temperature (Monthly 1km)
Nighttime Land Surface Temperature (LST) are derived from the ~1km MODIS MOD11A2 v6.1 products. The 8-daily composites are converted to degrees Celsius and then gap-filled using the approach outlined in Weiss et al (2014) to eliminate missing data caused by factors such as cloud cover. …
MAPL-EMIT: Modeled Methane Enhancement and Plume Probability
The Methane Analysis and Plume Localization with EMIT (MAPL-EMIT) enhancements dataset provides high-resolution (60m) methane (CH₄) enhancement maps and plume probabilities derived from radiance data captured by the Earth Surface Mineral Dust Source Investigation (EMIT) instrument which were generated and released as part of the …
The Methane Analysis and Plume Localization with EMIT (MAPL-EMIT) dataset provides high-resolution (60m) methane (CH₄) plume complex maps and plume source locations derived from radiance data captured by the Earth Surface Mineral Dust Source Investigation (EMIT) instrument. Methane point-source emissions are a major driver of …
Malaria Atlas Project Accessibility to Cities 2015
This global accessibility map enumerates land-based travel time to the nearest densely-populated area for all areas between 85 degrees north and 60 degrees south for a nominal year 2015. Densely-populated areas are defined as contiguous areas with 1,500 or more inhabitants per square kilometer or …
Malaria Atlas Project Accessibility to Healthcare 2019
This global accessibility map enumerates land-based travel time (in minutes) to the nearest hospital or clinic for all areas between 85 degrees north and 60 degrees south for a nominal year 2019. Major data collection efforts underway by OpenStreetMap, Google Maps, and academic researchers have …
Malaria Atlas Project Accessibility to Healthcare 2019 (Walking Only)
This global accessibility map enumerates land-based travel time (in minutes) to the nearest hospital or clinic for all areas between 85 degrees north and 60 degrees south for a nominal year 2019. This surface is based on "walking-only" travel time, using non-motorized means of transportation …
Malaria Atlas Project Global Friction Surface 2015
Friction Surface 2019". This global friction surface enumerates land-based travel speed for all land pixels between 85 degrees north and 60 degrees south for a nominal year 2015. This map was produced through a collaboration between the University of Oxford Malaria Atlas Project (MAP), Google, …
Malaria Atlas Project Global Friction Surface 2019
This global friction surface enumerates land-based travel speed for all land pixels between 85 degrees north and 60 degrees south for a nominal year 2019. This map was produced through a collaboration between MAP (University of Oxford), Telethon Kids Institute (Perth, Australia), Google, and the …
Malaria Atlas Project Global Friction Surface 2019 (Walking Only)
This global friction surface enumerates land-based travel speed for all land pixels between 85 degrees north and 60 degrees south for a nominal year 2019. This surface is based on "walking-only" travel speed, using non-motorized means of transportation only. This map was produced through a …
MapBiomas Land Use and Land Cover (LULC) dataset for Bolivia is produced annually by the MapBiomas Project using Landsat satellite imagery and machine learning classification techniques. The dataset provides consistent annual land cover maps at 30-meter resolution covering the period from 1985 to 2024. Bolivia's …
MapBiomas Land Use and Land Cover (LULC) dataset for Brazil is produced annually by the MapBiomas Project using Landsat satellite imagery and machine learning classification techniques. The dataset provides consistent, thematically detailed maps at 30-meter resolution, covering multiple decades and updated each year. Each image …
MapBiomas Land Use and Land Cover (LULC) dataset for Ecuador is produced annually by the MapBiomas Project using Landsat satellite imagery and machine learning classification techniques. The dataset provides consistent annual land cover maps at 30-meter resolution covering the period from 1985 to 2024. Ecuador's …
This dataset provides geospatial data for the total column dry air mole fraction of methane in the atmosphere, "XCH4", as observed by the MethaneAIR imaging spectrometer. XCH4 is defined as the total column amount (number of molecules) of methane ("CH4") divided by the total amount …
This dataset provides data for high-emitting methane point source detections (kg/hr) over 13 oil and gas or coal extraction areas from Colorado, New Mexico, and Texas in the west to Pennsylvania, Ohio, and West Virginia in the east, plus three urban areas (New York City, …
This early "Public Preview" dataset provides geospatial data for the column-averaged dry-air mole fraction of methane in the atmosphere, "XCH4", retrieved from measurements by the MethaneSAT imaging spectrometer. XCH4 is defined as the total column amount (number of molecules above a unit surface area) of …
The dispersed area emissions model is still in development and not representative of a final product. This early "Public Preview" dataset provides high precision data for methane emissions from dispersed area sources. These emissions data come from the Appalachian, Permian, and Uinta basins in the …
The dispersed area emissions model is still in development and not representative of a final product. This early "Public Preview" dataset provides high precision data for methane emissions from dispersed area sources. These novel measurements demonstrate the importance of quantifying total methane emissions with high …
This early "Public Preview" dataset provides high precision data for methane emissions from discrete point sources. These methane emission fluxes were produced using a point source detection and emissions quantification framework specialized to exploit the high spatial resolution, wide spatial coverage, and high precision of …
Height of the top of canopy above bare earth (Canopy Height Model; CHM). The CHM is derived from the NEON LiDAR point cloud and is generated by creating a continuous surface of canopy height estimates across the entire spatial domain of the LiDAR survey. The …
Modelled canopy nitrogen concentration calibrated with NEON plant foliar chemistry observations and predicted with L1 surface directional reflectance, derived from the NEON Imaging Spectrometer (NIS). Bands include 1) canopy nitrogen percent, 2) canopy nitrogen model uncertainty, 3) classification result for needle vs. non-needle model and …
Digital models of the surface (DSM) and terrain (DTM) derived from NEON LiDAR data. DSM: Surface features (topographic information with vegetation and man-made structures present). DTM: Bare earth elevation (topographic information with vegetation and man-made structures removed). Images are given in meters above mean sea …
High resolution Red-Green-Blue (RGB) orthorectified camera images mosaicked and output onto a fixed, uniform spatial grid using nearest-neighbor resampling; spatial resolution is 0.1 m. The digital camera is part of a suite of instruments on the NEON Airborne Observation Platform (AOP) that also includes a …
The NEON AOP Surface Bidirectional Reflectance is a hyperspectral VSWIR (visible to shortwave infrared) data product, containing 426 bands spanning wavelengths from ~380 nm to 2510 nm. Reflectance is scaled by a factor of 10000. Wavelengths between 1340-1445 nm and 1790-1955 nm are set to …
The NEON AOP Surface Directional Reflectance is a hyperspectral VSWIR (visible to shortwave infrared) data product, containing 426 bands spanning wavelengths from ~380 nm to 2510 nm. Reflectance is scaled by a factor of 10000. Wavelengths between 1340-1445 nm and 1790-1955 nm are set to …
NICFI Satellite Data Program Basemaps for Tropical Forest Monitoring - Africa
This image collection provides access to high-resolution satellite monitoring of the tropics for the primary purpose of reducing and reversing the loss of tropical forests, contributing to combating climate change, conserving biodiversity, contributing to forest regrowth, restoration and enhancement, and facilitating sustainable development, all of …
NICFI Satellite Data Program Basemaps for Tropical Forest Monitoring - Americas
This image collection provides access to high-resolution satellite monitoring of the tropics for the primary purpose of reducing and reversing the loss of tropical forests, contributing to combating climate change, conserving biodiversity, contributing to forest regrowth, restoration and enhancement, and facilitating sustainable development, all of …
NICFI Satellite Data Program Basemaps for Tropical Forest Monitoring - Asia
This image collection provides access to high-resolution satellite monitoring of the tropics for the primary purpose of reducing and reversing the loss of tropical forests, contributing to combating climate change, conserving biodiversity, contributing to forest regrowth, restoration and enhancement, and facilitating sustainable development, all of …
Natural Forests of the World 2020, provides a global map of natural forest probability for the year 2020 at a 10-meter resolution. It was developed to support initiatives like the European Union's Deforestation Regulation (EUDR) and other efforts for forest conservation and monitoring. The map …
Atmosphere-Land Exchange Inverse / Disaggregation of the Atmosphere-Land Exchange Inverse (ALEXI/DisALEXI). DisALEXI was ported to Google Earth Engine as part of the OpenET framework. The baseline ALEXI/DisALEXI model structure is described by Anderson et al. (2012, 2018). The ALEXI evapotranspiration (ET) model specifically uses time …
The OpenET dataset includes satellite-based data on the total amount of water that is transferred from the land surface to the atmosphere through the process of evapotranspiration (ET). OpenET provides ET data from multiple satellite-driven models, and also calculates a single "ensemble value" from the …
Priestley-Taylor Jet Propulsion Laboratory (PT-JPL). The core formulation of the PT-JPL model within the OpenET framework has not changed from the original formulation detailed in Fisher et al. (2008). However, enhancements and updates to model inputs and time integration for PT-JPL were made to take …
Satellite Irrigation Management Support (SIMS). The NASA Satellite Irrigation Management Support (SIMS) model was originally developed to support satellite mapping of crop coefficients and evapotranspiration (ET) from irrigated lands and to increase access to this data to support use in irrigation scheduling and regional assessment …
Operational Simplified Surface Energy Balance (SSEBop). The Operational Simplified Surface Energy Balance (SSEBop) model by Senay et al. (2013, 2017) is a thermal-based simplified surface energy model for estimating actual ET based on the principles of satellite psychrometry (Senay 2018). The OpenET SSEBop implementation uses …
Operational Simplified Surface Energy Balance (SSEBop). The Operational Simplified Surface Energy Balance (SSEBop) model (Senay et al., 2013; 2023) is a thermal based approach for estimating actual evapotranspiration (ET) using the principles of satellite psychrometry (Senay, 2018). As one of the core models in the …
Google Earth Engine implementation of the Mapping Evapotranspiration at high Resolution with Internalized Calibration model (eeMETRIC). eeMETRIC applies the advanced METRIC algorithms and process of Allen et al. (2007; 2015) and Allen et al. (2013b), where a singular relationship between the near surface air temperature …
Google Earth Engine implementation of the Surface Energy Balance Algorithm for Land (SEBAL) model. An overview of the current geeSEBAL version can be found in Laipelt et al. (2021), which is based on the original algorithms developed by Bastiaanssen et al. (1998). The OpenET geeSEBAL …
The Overture Maps Places theme contains more than 64 million point representations of real-world entities: businesses, schools, hospitals, religious organizations, landmarks, mountain peaks, and much more. Each place record includes location coordinates, names, categories, contact information (websites, social media, emails, phones), brand information, addresses, and …
Oya is a quasi-global, high-resolution precipitation estimation dataset derived from geostationary (GEO) satellite observations. The Oya model utilizes the full spectrum of visible and infrared (VIS-IR) channels from a constellation of GEO satellites — including GOES-16/18, Meteosat-9/10, and Himawari-8/9 — to generate precipitation estimates covering …
PML_V2.2a: Coupled Evapotranspiration and Gross Primary Product (MODIS Edition)
The dataset is produced by the Large Scale Hydrology Lab, which specializes in advancing global and regional water cycle research by synthesizing multi-source Earth observations with process-based modeling. The PML-V2.2a (MODIS Edition) product provides global terrestrial evapotranspiration (ET) and gross primary production (GPP) at a …
PML_V2.2a: Coupled Evapotranspiration and Gross Primary Product (VIIRS Edition)
The dataset is produced by the Large Scale Hydrology Lab, which specializes in advancing global and regional water cycle research by synthesizing multi-source Earth observations with process-based modeling. The PML-V2.2a (VIIRS Edition) product provides global terrestrial evapotranspiration (ET) and gross primary production (GPP) at a …
This image collection provides estimated per-pixel probability that the underlying area is occupied by the commodity. The probability estimates are provided at 10 meter resolution, and have been generated by a machine learning model. For details, see the technical documentation on the Forest Data Partnership …
SCANFI: the Spatialized CAnadian National Forest Inventory data product1.2
This data publication contains a set of 30m resolution raster files representing 2020 Canadian wall-to-wall maps of broad land cover type, forest canopy height, degree of crown closure and aboveground tree biomass, along with species composition of several major tree species. The Spatialized CAnadian National …
These species distribution model outputs, developed by Google in collaboration with QCIF and EcoCommons, represent estimates of species' relative occurrence likelihoods (ie, higher values indicate a higher likelihood that the species would be detected at a location, for a given survey methodology and given survey …
TCB: Malaria Atlas Project Gap-Filled Tasseled Cap Brightness (8-Daily 1km)
This gap-filled Tasseled Cap Brightness (TCB) dataset was created by applying the tasseled-cap equations defined in Lobser and Cohen (2007) to MODIS BRDF-corrected imagery (MCD43B4). The resulting data were gap-filled using the approach outlined in Weiss et al. (2014) to eliminate missing data caused by …
TCB: Malaria Atlas Project Gap-Filled Tasseled Cap Brightness (Annual 1km)
This gap-filled Tasseled Cap Brightness (TCB) dataset was created by applying the tasseled-cap equations defined in Lobser and Cohen (2007) to MODIS BRDF-corrected imagery (MCD43B4). The resulting data were gap-filled using the approach outlined in Weiss et al. (2014) to eliminate missing data caused by …
TCB: Malaria Atlas Project Gap-Filled Tasseled Cap Brightness (Monthly 1km)
This gap-filled Tasseled Cap Brightness (TCB) dataset was created by applying the tasseled-cap equations defined in Lobser and Cohen (2007) to MODIS BRDF-corrected imagery (MCD43B4). The resulting data were gap-filled using the approach outlined in Weiss et al. (2014) to eliminate missing data caused by …
TCW: Malaria Atlas Project Gap-Filled Tasseled Cap Wetness (8-Daily 1km)
This gap-filled Tasseled Cap Wetness (TCW) dataset was created by applying the tasseled-cap equations defined in Lobser and Cohen (2007) to MODIS BRDF-corrected imagery (MCD43B4). The resulting data were gap-filled using the approach outlined in Weiss et al. (2014) to eliminate missing data caused by …
TCW: Malaria Atlas Project Gap-Filled Tasseled Cap Wetness (Annual 1km)
This gap-filled Tasseled Cap Wetness (TCW) dataset was created by applying the tasseled-cap equations defined in Lobser and Cohen (2007) to MODIS BRDF-corrected imagery (MCD43B4). The resulting data were gap-filled using the approach outlined in Weiss et al. (2014) to eliminate missing data caused by …
TCW: Malaria Atlas Project Gap-Filled Tasseled Cap Wetness (Monthly 1km)
This gap-filled Tasseled Cap Wetness (TCW) dataset was created by applying the tasseled-cap equations defined in Lobser and Cohen (2007) to MODIS BRDF-corrected imagery (MCD43B4). The resulting data were gap-filled using the approach outlined in Weiss et al. (2014) to eliminate missing data caused by …
USFS Landscape Change Monitoring System v2025-11 (CONUS and OCONUS)
This product is part of the Landscape Change Monitoring System (LCMS) data suite. It shows LCMS-modeled change, land cover, and/or land use classes for each year and covers the Conterminous United States (CONUS) as well as areas outside the CONUS (OCONUS) including Alaska (AK), Puerto …
The Tree Canopy Cover (TCC) data suite, produced by the United States Department of Agriculture, Forest Service (USFS), are annual remote sensing-based map outputs spanning from 1985-2025. These data support the National Land Cover Database (NLCD) project, which is managed by the US Geological Survey …
WDKBA: World Database of Key Biodiversity Areas (KBAs) - March 2026
If you are interested in accessing the KBA dataset please complete the KBA data request form which will allow access directly in GEE once approved. Key Biodiversity Areas (KBAs) are 'sites contributing significantly to the global persistence of biodiversity', in terrestrial, freshwater and marine ecosystems. …
WRI/Google DeepMind Global Drivers of Forest Loss 2001-2022 v1.0
This dataset maps the dominant driver of tree cover loss from 2001-2022 globally at 1 km resolution. Produced by the World Resources Institute (WRI) and Google DeepMind, the data were developed using a global neural network model (ResNet) trained on a set of samples collected …
WRI/Google DeepMind Global Drivers of Forest Loss 2001-2023 v1.1
This dataset maps the dominant driver of tree cover loss from 2001-2023 globally at 1 km resolution. Produced by the World Resources Institute (WRI) and Google DeepMind, the data were developed using a global neural network model (ResNet) trained on a set of samples collected …
WRI/Google DeepMind Global Drivers of Forest Loss 2001-2024 v1.2
This dataset maps the dominant driver of tree cover loss from 2001-2024 globally at 1 km resolution. Produced by the World Resources Institute (WRI) and Google DeepMind, the data were developed using a global neural network model (ResNet) trained on a set of samples collected …
WRI/Google DeepMind Global Drivers of Forest Loss 2001-2025 v1.3
This dataset maps the dominant driver of tree cover loss from 2001-2025 globally at 1 km resolution. Produced by the World Resources Institute (WRI) and Google DeepMind, the data were developed using a global neural network model (ResNet) trained on a set of samples collected …
WeatherNext 2 is an experimental dataset of global medium-range ensemble weather forecasts produced by an operational version of Google DeepMind's Functional Network Generative weather model. The experimental dataset includes real-time and historic data. Real-time data is any data that relates to a time that is …
WeatherNext 2 Mean is the mean of 64 ensembles of an experimental dataset of global medium-range ensemble weather forecasts produced by an operational version of Google DeepMind's Functional Network Generative weather model. For a dataset containing all ensemble members, please see the (non-mean) WeatherNext 2 …
WeatherNext 3 (0.05°) dataset is an experimental dataset of global medium-range ensemble weather forecasts by Google DeepMind and Google Research, produced by an operational version of the model described in: WeatherNext 3: Increasing resolution and performance of global weather models with raw observations. Data Access …
WeatherNext 3 (0.1°) dataset is an experimental dataset of global medium-range ensemble weather forecasts by Google DeepMind and Google Research, produced by an operational version of the model described in: WeatherNext 3: Increasing resolution and performance of global weather models with raw observations. Data Access …
[[["সহজে বোঝা যায়","easyToUnderstand","thumb-up"],["আমার সমস্যার সমাধান হয়েছে","solvedMyProblem","thumb-up"],["অন্যান্য","otherUp","thumb-up"]],[["এতে আমার প্রয়োজনীয় তথ্য নেই","missingTheInformationINeed","thumb-down"],["খুব জটিল / অনেক ধাপ","tooComplicatedTooManySteps","thumb-down"],["পুরনো","outOfDate","thumb-down"],["অনুবাদ সংক্রান্ত সমস্যা","translationIssue","thumb-down"],["নমুনা / কোড সংক্রান্ত সমস্যা","samplesCodeIssue","thumb-down"],["অন্যান্য","otherDown","thumb-down"]],[],[],[]]