
Page Summary
-
The Google Analytics Data API v1 supports advanced features like creating reports on custom dimensions and metrics and generating cohort reports and comparisons.
-
You can list registered custom dimensions and metrics using the Metadata API Method and include their API names in Report Requests to the runReport method.
-
Cohort reports show user retention over time for specific user groups defined by criteria like their first session date.
-
Comparisons allow side-by-side analysis of different data subsets based on specified filters and criteria within a report.
-
The
comparisonfield is automatically added to reports using the comparisons feature, indicating the name of the comparison applied.
This document describes several advanced features of the Google Analytics Data API v1. For a detailed reference of the API, see the API Reference.
List custom definitions and create reports
The Data API can create reports on registered Custom Dimensions and Custom Metrics. The Metadata API Method can be used to list the API names of your Property's registered Custom Definitions. These API names can be used in Report Requests to the runReport method for example.
The following sections show examples for each type of Custom Definition. In
these examples, replace GA_PROPERTY_ID with your Property ID.
Event-scoped custom dimensions
Step 1: Query the Metadata API Method with your Property ID.
GET https://analyticsdata.googleapis.com/v1beta/properties/GA_PROPERTY_ID/metadata
Step 2: Find the Event-Scoped Custom Dimension you are interested in creating reports on from the response. If the dimension is not present, you need to register the dimension.
"dimensions": [
...
    {
      "apiName": "customEvent:achievement_id",
      "uiName": "Achievement ID",
      "description": "An event scoped custom dimension for your Analytics property."
    },
...
],
Step 3: Include the custom dimension in a report request. The following is a sample request to the runReport method.
POST https://analyticsdata.googleapis.com/v1beta/properties/GA_PROPERTY_ID:runReport
{
  "dateRanges": [{ "startDate": "2020-09-01", "endDate": "2020-09-15" }],
  "dimensions": [{ "name": "customEvent:achievement_id" }],
  "metrics": [{ "name": "eventCount" }]
}
User-scoped custom dimensions
Step 1: Query the Metadata API Method with your Property ID.
GET https://analyticsdata.googleapis.com/v1beta/properties/GA_PROPERTY_ID/metadata
Step 2: Find the User-Scoped Custom Dimension you are interested in creating reports on from the response. If the dimension is not present, you need to register the dimension.
"dimensions": [
...
    {
      "apiName": "customUser:last_level",
      "uiName": "Last level",
      "description": "A user property for your Analytics property."
    },
...
],
Step 3: Include the custom dimension in a report request. The following is a sample request to the runReport method.
POST https://analyticsdata.googleapis.com/v1beta/properties/GA_PROPERTY_ID:runReport
{
  "entity": { "propertyId": "GA_PROPERTY_ID" },
  "dateRanges": [{ "startDate": "7daysAgo", "endDate": "yesterday" }],
  "dimensions": [{ "name": "customUser:last_level" }],
  "metrics": [{ "name": "activeUsers" }]
}
Event-scoped custom metrics
Step 1: Query the Metadata API Method with your Property ID.
GET https://analyticsdata.googleapis.com/v1beta/properties/GA_PROPERTY_ID/metadata
Step 2: Find the Event-Scoped Custom Metric you are interested in creating reports on from the response. If the metric is not present, you need to register the metric.
"metrics": [
...
    {
      "apiName": "customEvent:credits_spent",
      "uiName": "Credits Spent",
      "description": "An event scoped custom metric for your Analytics property.",
      "type": "TYPE_STANDARD"
    },
...
],
Step 3: Include the custom metric in a report request. The following is a sample request to the runReport method.
POST https://analyticsdata.googleapis.com/v1beta/properties/GA_PROPERTY_ID:runReport
{
  "dateRanges": [{ "startDate": "30daysAgo", "endDate": "yesterday" }],
  "dimensions": [{ "name": "eventName" }],
  "metrics": [{ "name": "customEvent:credits_spent" }]
}
Key event rate metrics for one key event
Step 1: Query the Metadata API Method with your Property ID.
GET https://analyticsdata.googleapis.com/v1beta/properties/GA_PROPERTY_ID/metadata
Step 2: Find the Key Event Rate Metric For One Key Event you are interested in creating reports on from the response. If the key event is not present, you need to set up the key event.
"metrics": [
...
    {
      "apiName": "sessionKeyEventRate:add_to_cart",
      "uiName": "Session key event rate for add_to_cart",
      "description": "The percentage of sessions in which a specific key event was triggered",
    },
...
],
Step 3: Include the key event rate metric in a report request. The following is a sample request to the runReport method.
POST https://analyticsdata.googleapis.com/v1beta/properties/GA_PROPERTY_ID:runReport
{
  "dateRanges": [{ "startDate": "30daysAgo", "endDate": "yesterday" }],
  "dimensions": [{ "name": "eventName" }],
  "metrics": [{ "name": "sessionKeyEventRate:add_to_cart" }]
}
Event-scoped custom metric averages
Step 1: Query the Metadata API Method with your Property ID.
GET https://analyticsdata.googleapis.com/v1beta/properties/GA_PROPERTY_ID/metadata
Step 2: Find the Event-Scoped Custom Metric Average you are interested in creating reports on from the response. If the metric is not present, you need to register the metric.
"metrics": [
...
    {
      "apiName": "averageCustomEvent:credits_spent",
      "uiName": "Average Credits Spent",
      "description": "The average of an event scoped custom metric for your Analytics property.",
      "type": "TYPE_STANDARD"
    },
...
],
Step 3: Include the custom metric average in a report request. The following is a sample request to the runReport method.
POST https://analyticsdata.googleapis.com/v1beta/properties/GA_PROPERTY_ID:runReport
{
  "dateRanges": [{ "startDate": "2020-11-01", "endDate": "2020-11-10" }],
  "dimensions": [{ "name": "eventName" }],
  "metrics": [{ "name": "averageCustomEvent:credits_spent" }]
}
Cohort report examples
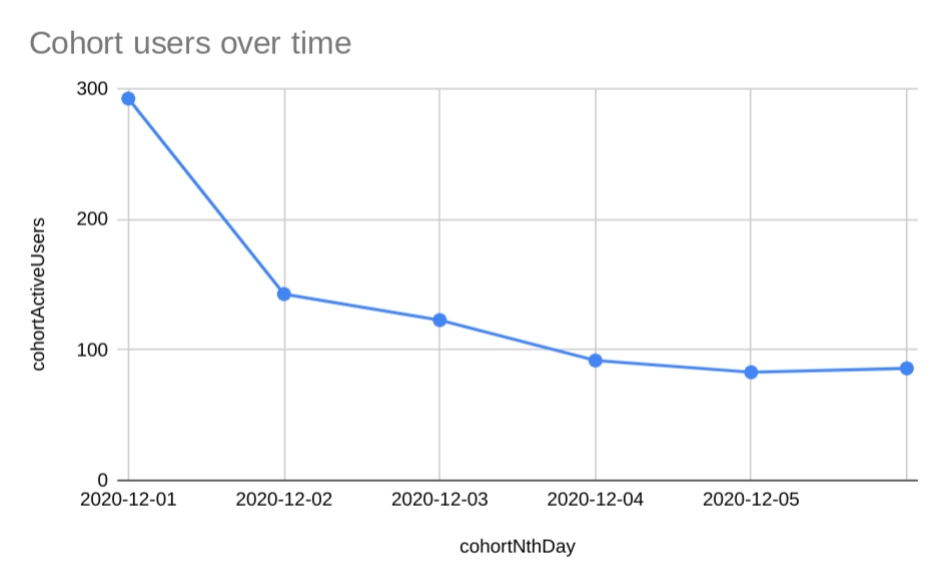
Cohort reports creates a time series of user retention for the cohort. For detailed documentation of each API field, see the REST reference for CohortSpec.
Create a cohort report
Here is a sample cohort report where:
- The cohort is users with a
firstSessionDateof2020-12-01; this is configured by thecohortsobject. The dimensions and metrics in the report response will only be based on the cohort's users. - The cohort report will show three columns; this is configured by the
dimensions and metrics objects.
- The dimension
cohortis the cohort's name. - The dimension
cohortNthDayis the number of days since2020-12-01. - The metric
cohortActiveUsersis the number of users still active.
- The dimension
- The
cohortsRangeobject specifies that the report should contain event data starting from2020-12-01and ending at2020-12-06for this cohort.- When a granularity of
DAILYis used, the dimensioncohortNthDayis recommended for consistency.
- When a granularity of
The report request for the cohort is:
POST https://analyticsdata.googleapis.com/v1beta/properties/GA_PROPERTY_ID:runReport
{
  "dimensions": [{ "name": "cohort" }, { "name": "cohortNthDay" }],
  "metrics": [{ "name": "cohortActiveUsers" }],
  "cohortSpec": {
    "cohorts": [
      {
        "dimension": "firstSessionDate",
        "dateRange": { "startDate": "2020-12-01", "endDate": "2020-12-01" }
      }
    ],
    "cohortsRange": {
      "endOffset": 5,
      "granularity": "DAILY"
    }
  },
}
For this request, an example report response is:
{
  "dimensionHeaders": [
    { "name": "cohort" }, { "name": "cohortNthDay" }
  ],
  "metricHeaders": [
    { "name": "cohortActiveUsers", "type": "TYPE_INTEGER" }
  ],
  "rows": [
    {
      "dimensionValues": [{ "value": "cohort_0" },{ "value": "0000" }],
      "metricValues": [{ "value": "293" }]
    },
    {
      "dimensionValues": [{ "value": "cohort_0" },{ "value": "0001" }],
      "metricValues": [{ "value": "143" }]
    },
    {
      "dimensionValues": [{ "value": "cohort_0" },{ "value": "0002" }],
      "metricValues": [{ "value": "123" }]
    },
    {
      "dimensionValues": [{ "value": "cohort_0" },{ "value": "0003" }],
      "metricValues": [{ "value": "92" }]
    },
    {
      "dimensionValues": [{ "value": "cohort_0" },{ "value": "0005" }],
      "metricValues": [{ "value": "86" }]
    },
    {
      "dimensionValues": [{ "value": "cohort_0" },{ "value": "0004" }],
      "metricValues": [{ "value": "83" }]
    }
  ],
  "metadata": {},
  "rowCount": 6
}
From this report response, a chart for this Cohort report follows. An insight from this report is that the largest drop in active users for this cohort is between the first and second day.
Multiple cohorts and user retention fraction
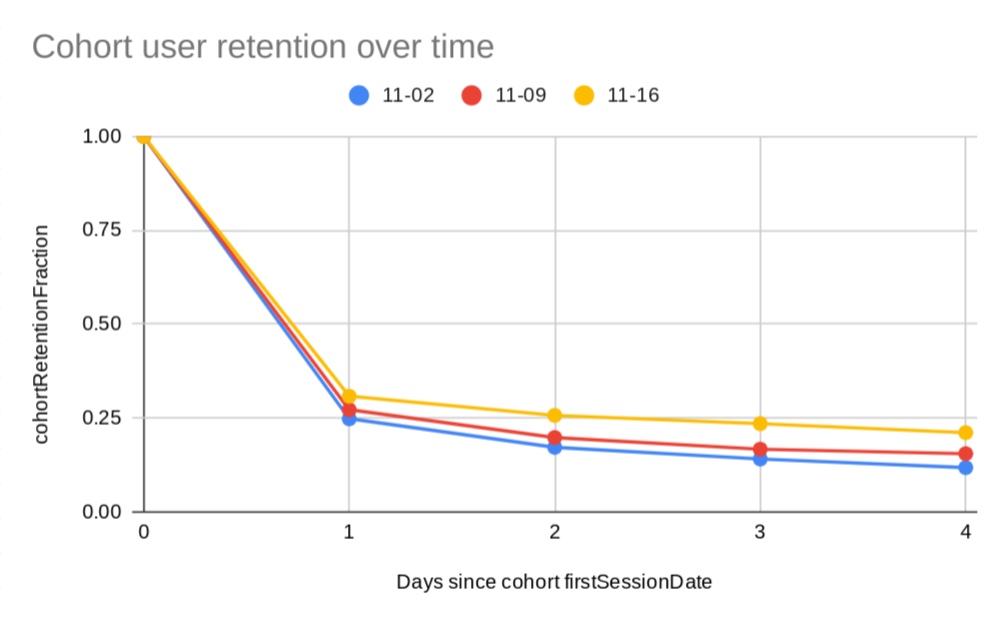
User acquisition and retention are ways to grow your Website or App. Cohort reports focus on user retention. In this example, the report shows this property has improved its 4 day user retention by 10% over the course of two weeks.
To create this report, we specify three cohorts: the first with a
firstSessionDate of 2020-11-02, the second with a firstSessionDate of
2020-11-09, and the third with a firstSessionDate of 2020-11-16. Because the
number of users on your property will be different for these three days, we
compare the cohort's user retention fraction metric of
cohortActiveUsers/cohortTotalUsers rather than use the direct
cohortActiveUsers metric.
The report request for these cohorts is:
POST https://analyticsdata.googleapis.com/v1beta/properties/GA_PROPERTY_ID:runReport
{
  "dimensions": [{ "name": "cohort" },{ "name": "cohortNthDay" }],
  "metrics": [
    {
      "name": "cohortRetentionFraction",
      "expression": "cohortActiveUsers/cohortTotalUsers"
    }
  ],
  "cohortSpec": {
    "cohorts": [
      {
        "dimension": "firstSessionDate",
        "dateRange": { "startDate": "2020-11-02", "endDate": "2020-11-02" }
      },
      {
        "dimension": "firstSessionDate",
        "dateRange": { "startDate": "2020-11-09", "endDate": "2020-11-09" }
      },
      {
        "dimension": "firstSessionDate",
        "dateRange": { "startDate": "2020-11-16", "endDate": "2020-11-16" }
      }
    ],
    "cohortsRange": {
      "endOffset": 4,
      "granularity": "DAILY"
    }
  },
}
For this request, an example report response is:
{
  "dimensionHeaders": [{ "name": "cohort" },{ "name": "cohortNthDay" }],
  "metricHeaders": [{
      "name": "cohortRetentionFraction",
      "type": "TYPE_FLOAT"
    }
  ],
  "rows": [
    {
      "dimensionValues": [{ "value": "cohort_0" },{ "value": "0000" }],
      "metricValues": [{ "value": "1" }]
    },
    {
      "dimensionValues": [{ "value": "cohort_1" },{ "value": "0000" }],
      "metricValues": [{ "value": "1" }]
    },
    {
      "dimensionValues": [{ "value": "cohort_2" },{ "value": "0000" }],
      "metricValues": [{ "value": "1" }]
    },
    {
      "dimensionValues": [{ "value": "cohort_2" },{ "value": "0001" }],
      "metricValues": [{ "value": "0.308" }]
    },
    {
      "dimensionValues": [{ "value": "cohort_1" },{ "value": "0001" }],
      "metricValues": [{ "value": "0.272" }]
    },
    {
      "dimensionValues": [{ "value": "cohort_2" },{ "value": "0002" }],
      "metricValues": [{ "value": "0.257" }]
    },
    {
      "dimensionValues": [{ "value": "cohort_0" },{ "value": "0001" }],
      "metricValues": [{ "value": "0.248" }]
    },
    {
      "dimensionValues": [{ "value": "cohort_2" },{ "value": "0003" }],
      "metricValues": [{ "value": "0.235" }]
    },
    {
      "dimensionValues": [{ "value": "cohort_2" },{ "value": "0004" }],
      "metricValues": [{ "value": "0.211" }]
    },
    {
      "dimensionValues": [{ "value": "cohort_1" },{ "value": "0002" }],
      "metricValues": [{ "value": "0.198" }]
    },
    {
      "dimensionValues": [{ "value": "cohort_0" },{ "value": "0002" }],
      "metricValues": [{ "value": "0.172" }]
    },
    {
      "dimensionValues": [{ "value": "cohort_1" },{ "value": "0003" }],
      "metricValues": [{ "value": "0.167" }]
    },
    {
      "dimensionValues": [{ "value": "cohort_1" },{ "value": "0004" }],
      "metricValues": [{ "value": "0.155" }]
    },
    {
      "dimensionValues": [{ "value": "cohort_0" },{ "value": "0003" }],
      "metricValues": [{ "value": "0.141" }]
    },
    {
      "dimensionValues": [{ "value": "cohort_0" },{ "value": "0004" }],
      "metricValues": [{ "value": "0.118" }]
    }
  ],
  "metadata": {},
  "rowCount": 15
}
From this report response, a chart for this Cohort report follows. An insight
from this report is that the 4 day user retention increased by 10% over the
course of two weeks. The later cohort with firstSessionDate of 2020-11-16
exceeds the retention of the earlier cohort with firstSessionDate
of 2020-11-02.
Weekly cohorts and using cohorts with other API features
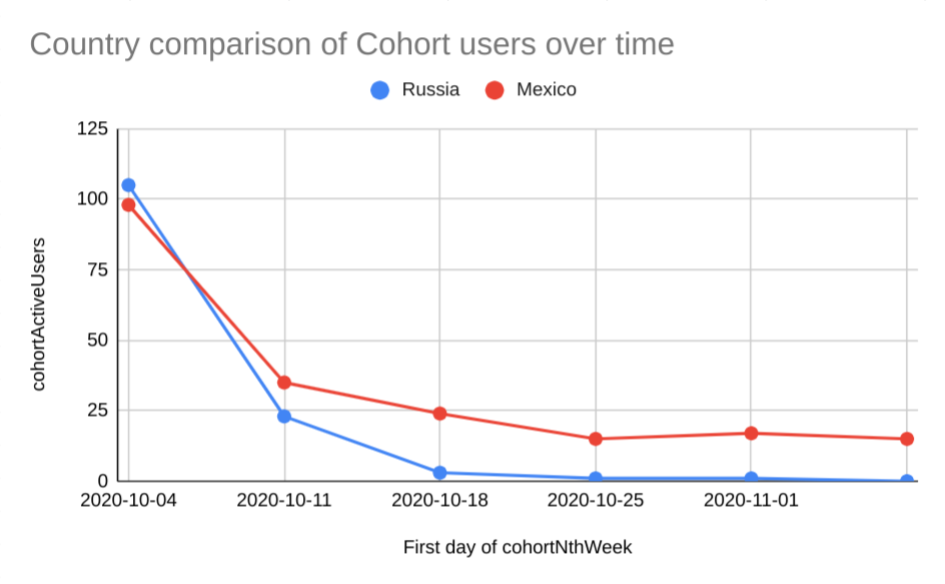
To remove day-to-day variance in user behavior, use weekly cohorts. In weekly
cohort reports, all users with firstSessionDate in the same week form the
cohort. Weeks begin on Sunday and end on Saturday. Also in this report, we are
slicing the cohort to compare the users with activity in Russia with users with
activity in Mexico. This slicing uses the country dimension and a
dimensionFilter to only consider the two countries.
The report request for these cohorts is:
POST https://analyticsdata.googleapis.com/v1beta/properties/GA_PROPERTY_ID:runReport
{
  "dimensions": [
    { "name": "cohort" },
    { "name": "cohortNthWeek" },
    { "name": "country" }
  ],
  "metrics": [{ "name": "cohortActiveUsers" }],
  "dimensionFilter": {
    "filter": {
      "fieldName": "country",
      "inListFilter": {
        "values": [ "Russia", "Mexico" ]
      }
    }
  },
  "cohortSpec": {
    "cohorts": [
      {
        "dimension": "firstSessionDate",
        "dateRange": {
          "startDate": "2020-10-04",
          "endDate": "2020-10-10"
        }
      }
    ],
    "cohortsRange": {
      "endOffset": 5,
      "granularity": "WEEKLY"
    }
  },
}
For this request, an example report response is:
{
  "dimensionHeaders": [
    { "name": "cohort" },
    { "name": "cohortNthWeek" },
    { "name": "country" }
  ],
  "metricHeaders": [
    { "name": "cohortActiveUsers", "type": "TYPE_INTEGER" }
  ],
  "rows": [
    {
      "dimensionValues": [
        { "value": "cohort_0" },{ "value": "0000" },{ "value": "Russia" }
      ],
      "metricValues": [{ "value": "105" }]
    },
    {
      "dimensionValues": [
        { "value": "cohort_0" },{ "value": "0000" },{ "value": "Mexico" }
      ],
      "metricValues": [{ "value": "98" }]
    },
    {
      "dimensionValues": [
        { "value": "cohort_0" },{ "value": "0001" },{ "value": "Mexico" }
      ],
      "metricValues": [{ "value": "35" }]
    },
    {
      "dimensionValues": [
        { "value": "cohort_0" },{ "value": "0002" },{ "value": "Mexico" }
      ],
      "metricValues": [{ "value": "24" }]
    },
    {
      "dimensionValues": [
        { "value": "cohort_0" },{ "value": "0001" },{ "value": "Russia" }
      ],
      "metricValues": [{ "value": "23" }]
    },
    {
      "dimensionValues": [
        { "value": "cohort_0" },{ "value": "0004" },{ "value": "Mexico" }
      ],
      "metricValues": [{ "value": "17" }]
    },
    {
      "dimensionValues": [
        { "value": "cohort_0" },{ "value": "0003" },{ "value": "Mexico" }
      ],
      "metricValues": [{ "value": "15" }]
    },
    {
      "dimensionValues": [
        { "value": "cohort_0" },{ "value": "0005" },{ "value": "Mexico" }
      ],
      "metricValues": [{ "value": "15" }]
    },
    {
      "dimensionValues": [
        { "value": "cohort_0" },{ "value": "0002" },{ "value": "Russia" }
      ],
      "metricValues": [{ "value": "3" }]
    },
    {
      "dimensionValues": [
        { "value": "cohort_0" },{ "value": "0003" },{ "value": "Russia" }
      ],
      "metricValues": [{ "value": "1" }]
    },
    {
      "dimensionValues": [
        { "value": "cohort_0" },{ "value": "0004" },{ "value": "Russia" }
      ],
      "metricValues": [{ "value": "1" }]
    }
  ],
  "metadata": {},
  "rowCount": 11
}
From this report response, a chart of this Cohort report follows. Based on this report, this property is doing better at retaining users with activity in Mexico than users with activity in Russia.
Comparisons
Comparisons let you evaluate subsets of your data side by side. You can
define comparisons by specifying the comparisons
field in a report definition. The Comparisons feature of the Data API is similar
to Comparisons in the Google Analytics frontend.
For detailed documentation of each API field, see the REST reference for Comparison.
Create a Comparison
You can create a separate comparison for each dataset you want to compare. For example, to compare app and web data, you can create one comparison for Android and iOS data and another comparison for Web data.
Here is a sample report which defines two comparisons and returns active users broken down by country.
The first comparison named "App traffic" is using the inListFilter to
match the platform dimension with values "iOS" and "Android". The second
comparison named "Web traffic" uses the stringFilter to match the platform
dimension with "web".
  POST https://analyticsdata.googleapis.com/v1beta/properties/GA_PROPERTY_ID:runReport
  {
    "comparisons": [
      {
        "name": "App traffic",
        "dimensionFilter": {
          "filter": {
            "fieldName": "platform",
            "inListFilter": {
              "values": [
                "iOS",
                "Android"
              ]
            }
          }
        }
      },
      {
        "name": "Web traffic",
        "dimensionFilter": {
          "filter": {
            "fieldName": "platform",
            "stringFilter": {
              "matchType": "EXACT",
              "value": "web"
            }
          }
        }
      }
    ],
    "dateRanges": [
      {
        "startDate": "2024-05-01",
        "endDate": "2024-05-15"
      }
    ],
    "dimensions": [
      {
        "name": "country"
      }
    ],
    "metrics": [
      {
        "name": "activeUsers"
      }
    ]
  }
For all requests using the comparisons feature, the field comparison is
automatically added to the generated report. This field contains the name
of the comparison provided in the request.
Here is a sample snippet of a response containing comparisons:
{
  "dimensionHeaders": [
    {
      "name": "comparison"
    },
    {
      "name": "country"
    }
  ],
  "metricHeaders": [
    {
      "name": "activeUsers",
      "type": "TYPE_INTEGER"
    }
  ],
  "rows": [
    {
      "dimensionValues": [
        {
          "value": "Web traffic"
        },
        {
          "value": "United States"
        }
      ],
      "metricValues": [
        {
          "value": "638572"
        }
      ]
    },
    {
      "dimensionValues": [
        {
          "value": "Web traffic"
        },
        {
          "value": "Japan"
        }
      ],
      "metricValues": [
        {
          "value": "376578"
        }
      ]
    },
  {
      "dimensionValues": [
        {
          "value": "App traffic"
        },
        {
          "value": "United States"
        }
      ],
      "metricValues": [
        {
          "value": "79527"
        }
      ]
    },

    ...

  ],

...

}