The Meridian model health score gives a unified view of model integrity by combining six individual health checks into one metric ranging from 0 to 100. While individual diagnostics provide granular insights into specific model components, the model health score provides an aggregate measure on a model's health for causal inference. For a detailed breakdown of the underlying diagnostics, see Model health checks.
Interpret health scores
We recommend you interpret these scores as directional insights rather than absolute rankings of model quality. A score of 90 or greater suggests the model does not exhibit serious statistical issues and is generally robust for decision making. Conversely, a score of 70 or less indicates potential systematic errors, and we recommend you examine individual diagnostics closely to identify the root cause.
It is important to note that a score of 95 is not necessarily superior to a score of 90 for causal inference. At these high ranges, variations often reflect specific channel nuances or data noise rather than a meaningful difference in reliability. For example, a lack of prior posterior shift is not always a negative signal; it may mean your prior was already well aligned with the observed data. We recommend you analyze the underlying health result details closely to ensure a comprehensive understanding of the model performance and to confirm that key results such as ROI and contribution align with your broader business objectives.
Understand how the model health score is calculated
The health score logic follows a strict hierarchy where statistical validity is a prerequisite for a meaningful result. Model convergence serves as the primary gate. If MCMC chains have not converged, the posterior estimates are unreliable and the model's health score is zero.
For converged models, the health score is calculated as a weighted average of component scores ($S_i$) from performed health checks such as goodness-of-fit, negative baseline, and ROI consistency:
where $w_i$ represents the assigned weight for each check. For more details, see Understand the weighting of each health check.
Each base health check uses a specific mathematical transformation to map its diagnostic output to the 0 to 100 scale.
Bayesian Posterior Predictive P-value (PPP)
The Bayesian PPP serves as a fundamental plausibility gate for assessing model fit. Rather than acting as a continuous quality metric, it is treated as a binary indicator of whether a model meets the threshold for statistical plausibility, see Bayesian Posterior Predictive P-value to learn more.
PASS(Bayesian PPP>= 0.05): component score = 100FAIL(Bayesian PPP< 0.05): component score = 0
Negative Baseline
This check evaluates the posterior probability that the baseline is negative ($P_{\text{neg baseline}}$). The scoring methodology aligns with the health check principle where a probability less than 0.2 represents negligible statistical noise, while a probability exceeding 0.8 indicates a fundamental model failure. See more details for this check in the Negative Baseline section.
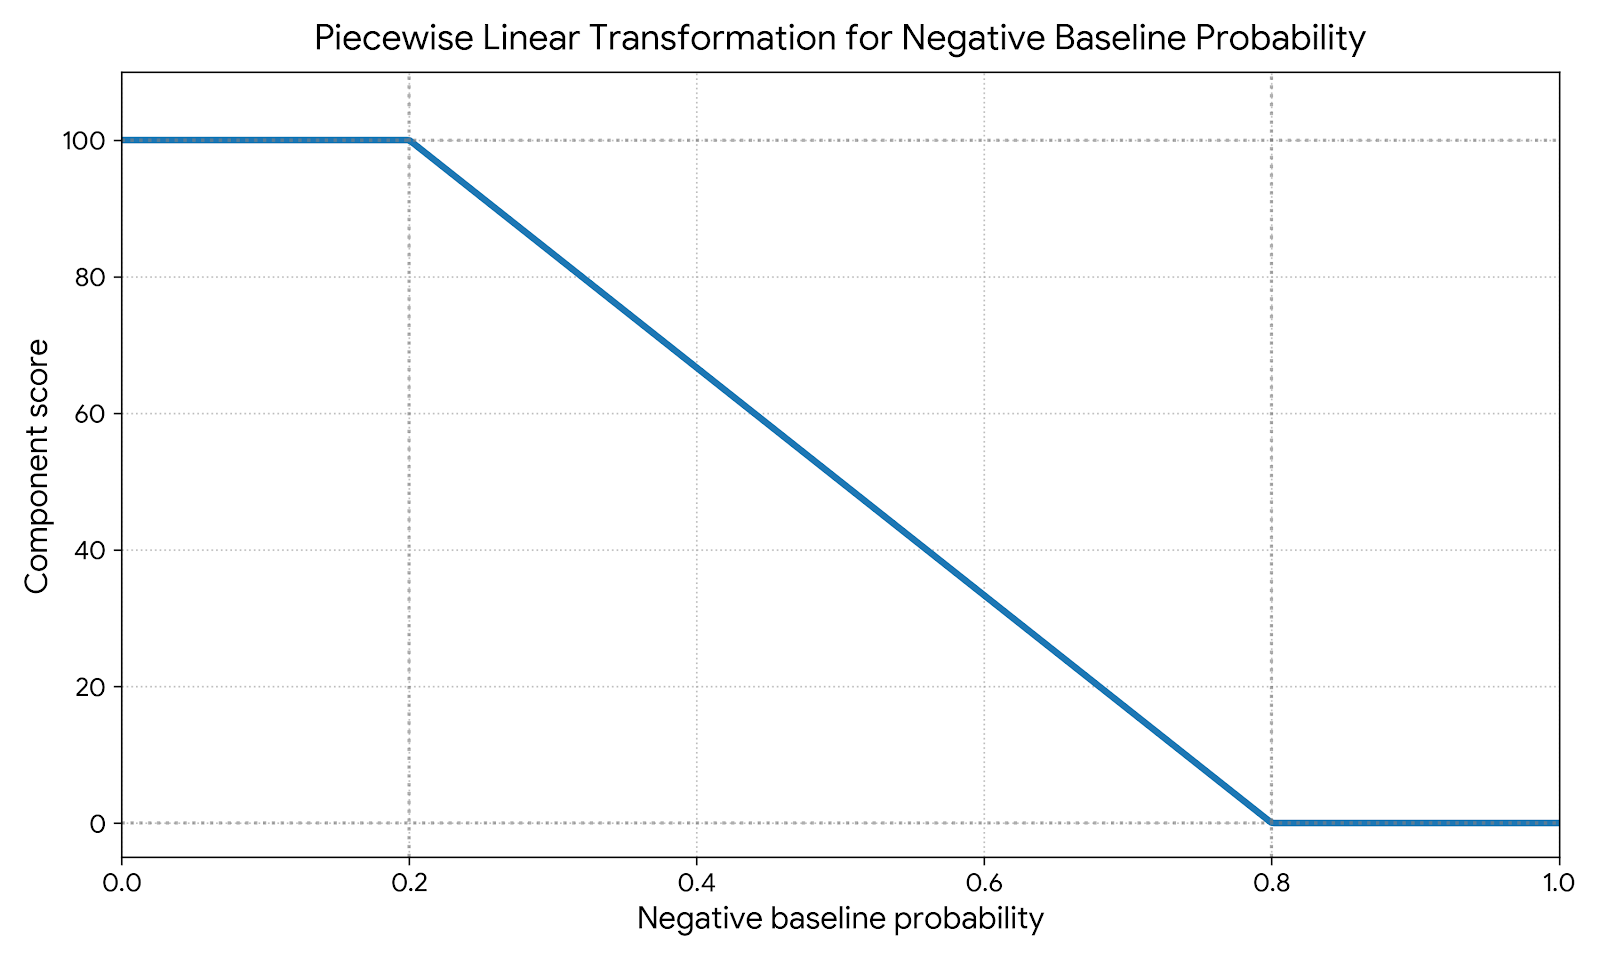
PASS(Negative baseline probability< 0.2): component score = 100REVIEW(Negative baseline probability is between0.2and0.8): The score is linearly interpolated:
FAIL(Negative baseline probability> 0.8): component score = 0
Goodness-of-Fit
For Goodness-of-Fit, the methodology uses a sigmoid function to map R-squared to the 0 to 100 scale, reflecting a principle of diminishing returns. The curve heavily penalizes poor fits, rises steeply through the middle range (0.3 to 0.7), and flattens as R-squared approaches 1.0.
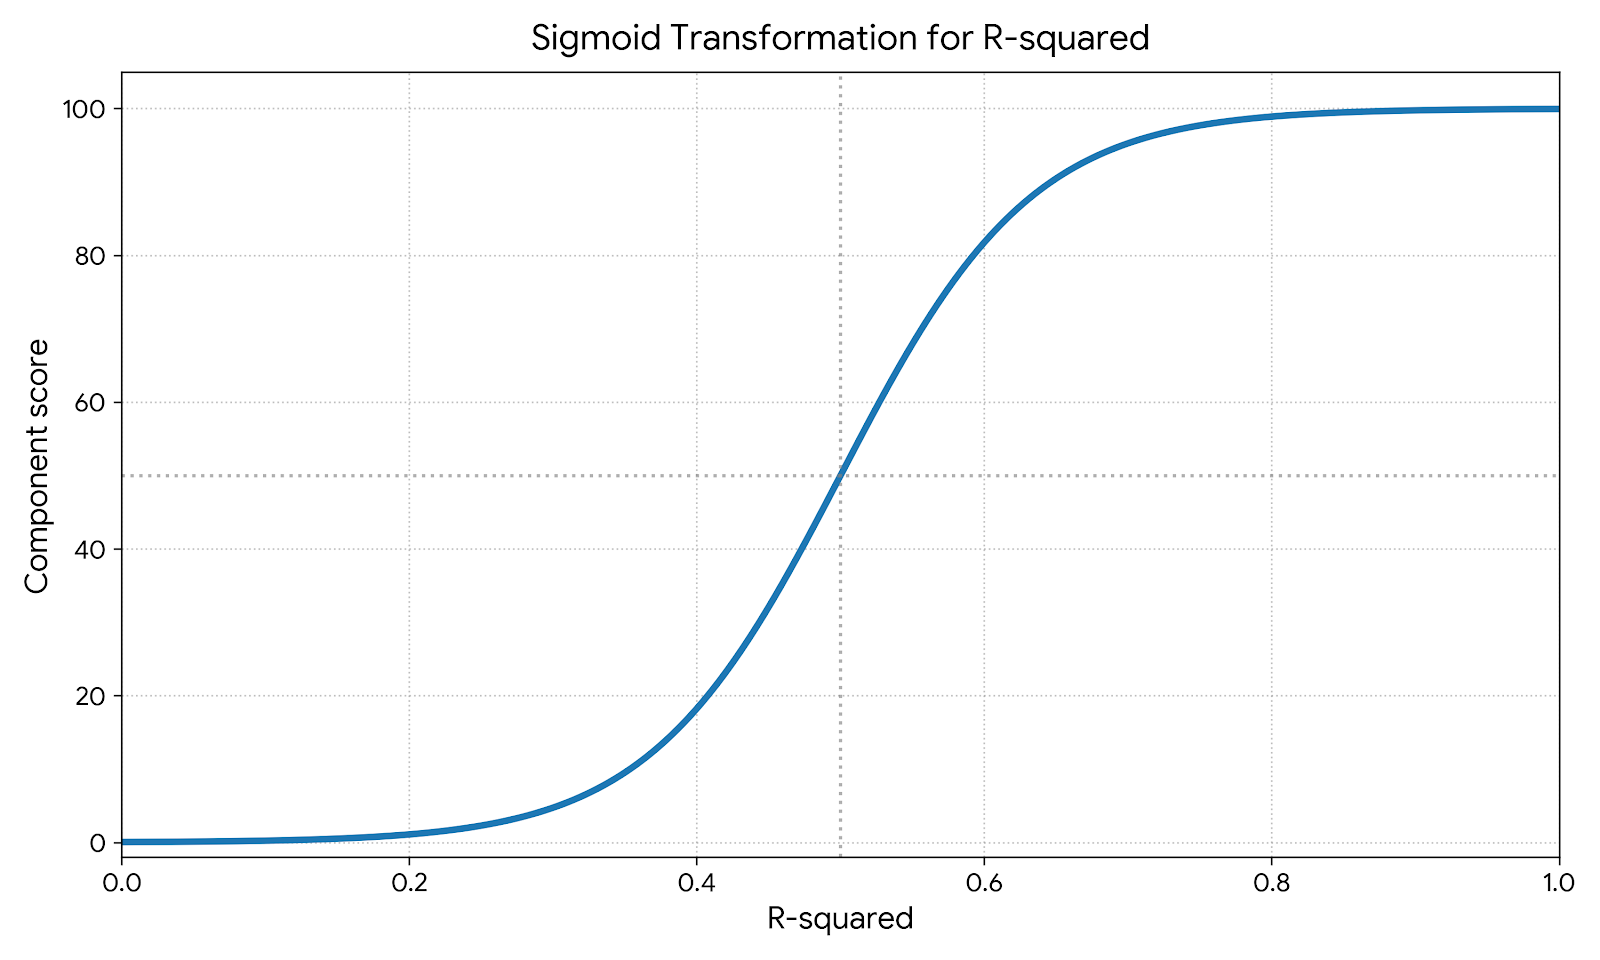
This discourages optimizing for predictive accuracy as a primary means to achieve a higher health score, when causal inference is the true objective. It discounts the marginal effort required to push an estimate from, for example, 0.91 to 0.93, as such gains may not correlate with better causal insights.
Prior Posterior Shift for ROI
The score for Prior Posterior Shift for ROI is derived from the failure rate, defined as the ratio of non-passing channels to the total number of applicable channels, which is then passed through a power transformation function.
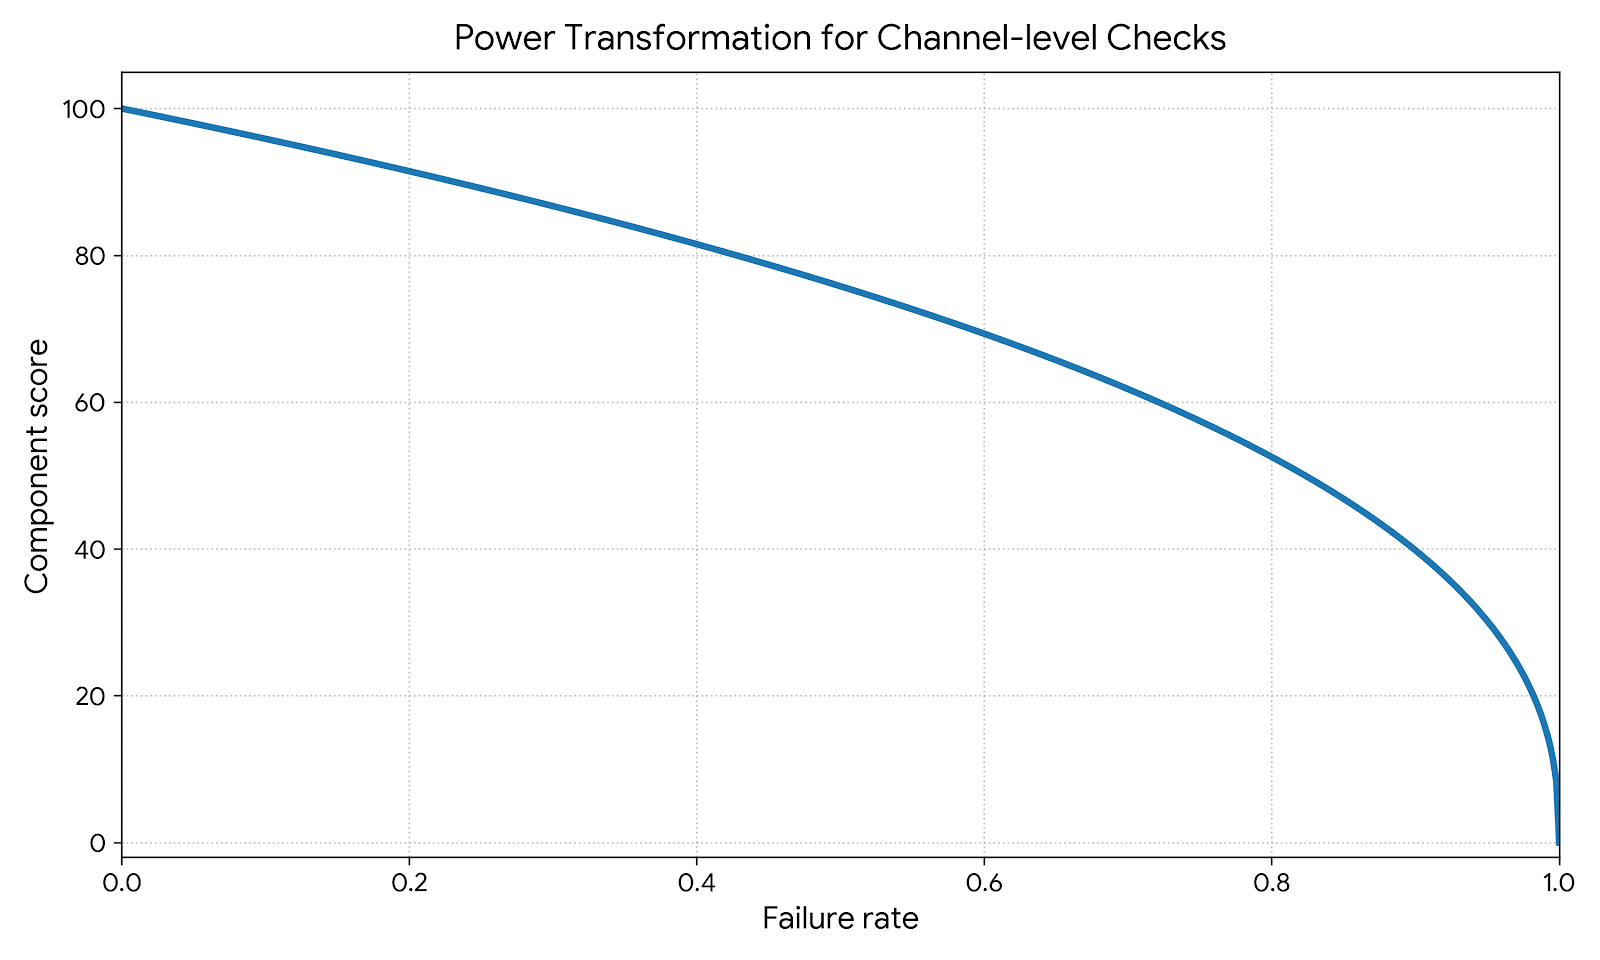
This creates a tolerance zone for minor noise in some channels but ensures the score degrades rapidly if failures become systemic across the marketing mix.
ROI Consistency
The score for ROI Consistency is derived from the channel failure rate using the same power transformation methodology used for ROI prior posterior shift. This ensures that extreme ROI values, which may indicate issues with baseline estimation or model specification, are reflected in the health score.
Understand the weighting of each health check
The health score follows a causal priority philosophy that emphasizes business guardrails and causal plausibility over raw predictive power. A model that fits historical data perfectly but violates fundamental business logic, such as suggesting a negative baseline, receives a low score. This ensures the model is reliable for decision making rather than merely rewarding high R squared values. The weights assigned to each check reflect a principled hierarchy of these criteria. Since no empirical ground truth exists for the relative importance of these diagnostics, the preconfigured values provide a prioritized framework designed to maintain directional reliability. We recommend you investigate each check for a complete understanding of model health.
| Health Check | Weight |
|---|---|
| Negative Baseline | 30% |
| Bayesian PPP | 30% |
| Goodness-of-fit (R-squared) | 10% |
| Prior Posterior Shift for ROI | 15% |
| ROI Consistency | 15% |
Understand score calculation when checks are skipped
To accommodate varying model configurations, the health score uses dynamic normalization. If a specific check is skipped, its weight is removed from both the numerator and the denominator. For example, the ROI Consistency check is not performed if default priors were used; in such cases, its weight is excluded from the calculation. The remaining weights are then normalized to ensure the final score remains on a 0 to 100 scale regardless of the number of active checks.