- Kataloginhaber
- Awesome GEE Community Catalog
- Dataset-Verfügbarkeit
- 2000-01-01T00:00:00Z–2023-12-31T00:00:00Z
- Ersteller des Datasets
- Oak Ridge National Laboratory
- Tags
Beschreibung
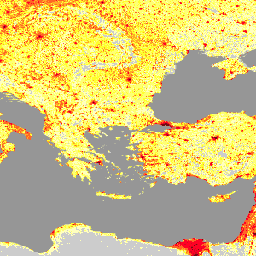
Das vom Oak Ridge National Laboratory (ORNL) bereitgestellte LandScan-Dataset bietet ein umfassendes und hochauflösendes globales Dataset zur Bevölkerungsverteilung, das eine wertvolle Ressource für eine Vielzahl von Anwendungen darstellt. LandScan nutzt modernste räumliche Modellierungstechniken und fortschrittliche georäumliche Datenquellen und bietet detaillierte Informationen zu Bevölkerungszahlen und ‑dichte mit einer Auflösung von 30 Bogensekunden. So erhalten Sie präzise und aktuelle Einblicke in die Muster menschlicher Siedlungen weltweit. Aufgrund seiner Genauigkeit und Granularität unterstützt LandScan verschiedene Bereiche wie Stadtplanung, Katastrophenhilfe, Epidemiologie und Umweltforschung. Damit ist es ein wichtiges Tool für Entscheidungsträger und Forscher, die verschiedene gesellschaftliche und ökologische Herausforderungen auf globaler Ebene verstehen und angehen möchten.
Bänder
Bänder
Pixelgröße: 1.000 Meter (alle Bänder)
| Name | Min. | Max. | Pixelgröße | Beschreibung |
|---|---|---|---|---|
b1 |
0* | 21171* | 1.000 Meter | Geschätzte Bevölkerungszahl |
Nutzungsbedingungen
Nutzungsbedingungen
Landscan-Datasets sind unter der Creative Commons Attribution 4.0 International License lizenziert. Nutzer dürfen das Werk ohne Einschränkung für kommerzielle und nicht kommerzielle Zwecke verwenden, kopieren, verteilen, übertragen und anpassen, sofern die Quelle klar angegeben wird.
Zitationen
Sims, K., Reith, A., Bright, E., Kaufman, J., Pyle, J., Epting, J., Gonzales, J., Adams, D., Powell, E., Urban, M., & Rose, A. (2023). LandScan Global 2022 [Datensatz]. Oak Ridge National Laboratory. https://doi.org/10.48690/1529167
DOIs
Die Earth Engine nutzen
Code-Editor (JavaScript)
var landscan_global =
    ee.ImageCollection('projects/sat-io/open-datasets/ORNL/LANDSCAN_GLOBAL');
var popcount_intervals = '<RasterSymbolizer>' +
    ' <ColorMap type="intervals" extended="false" >' +
    '<ColorMapEntry color="#CCCCCC" quantity="0" label="No Data"/>' +
    '<ColorMapEntry color="#FFFFBE" quantity="5" label="Population Count (Estimate)"/>' +
    '<ColorMapEntry color="#FEFF73" quantity="25" label="Population Count (Estimate)"/>' +
    '<ColorMapEntry color="#FEFF2C" quantity="50" label="Population Count (Estimate)"/>' +
    '<ColorMapEntry color="#FFAA27" quantity="100" label="Population Count (Estimate)"/>' +
    '<ColorMapEntry color="#FF6625" quantity="500" label="Population Count (Estimate)"/>' +
    '<ColorMapEntry color="#FF0023" quantity="2500" label="Population Count (Estimate)"/>' +
    '<ColorMapEntry color="#CC001A" quantity="5000" label="Population Count (Estimate)"/>' +
    '<ColorMapEntry color="#730009" quantity="185000" label="Population Count (Estimate)"/>' +
    '</ColorMap>' +
    '</RasterSymbolizer>';

// Define a dictionary which will be used to make legend and visualize image on
// map
var dict = {
  'names': [
    '0', '1-5', '6-25', '26-50', '51-100', '101-500', '501-2500', '2501-5000',
    '5001-185000'
  ],
  'colors': [
    '#CCCCCC', '#FFFFBE', '#FEFF73', '#FEFF2C', '#FFAA27', '#FF6625', '#FF0023',
    '#CC001A', '#730009'
  ]
};

// Create a panel to hold the legend widget
var legend = ui.Panel({style: {position: 'bottom-left', padding: '8px 15px'}});

// Function to generate the legend
function addCategoricalLegend(panel, dict, title) {
  // Create and add the legend title.
  var legendTitle = ui.Label({
    value: title,
    style: {
      fontWeight: 'bold',
      fontSize: '18px',
      margin: '0 0 4px 0',
      padding: '0'
    }
  });
  panel.add(legendTitle);

  var loading = ui.Label('Loading legend...', {margin: '2px 0 4px 0'});
  panel.add(loading);

  // Creates and styles 1 row of the legend.
  var makeRow = function(color, name) {
    // Create the label that is actually the colored box.
    var colorBox = ui.Label({
      style: {
        backgroundColor: color,
        // Use padding to give the box height and width.
        padding: '8px',
        margin: '0 0 4px 0'
      }
    });

    // Create the label filled with the description text.
    var description = ui.Label({value: name, style: {margin: '0 0 4px 6px'}});

    return ui.Panel({
      widgets: [colorBox, description],
      layout: ui.Panel.Layout.Flow('horizontal')
    });
  };

  // Get the list of palette colors and class names from the image.
  var palette = dict['colors'];
  var names = dict['names'];
  loading.style().set('shown', false);

  for (var i = 0; i < names.length; i++) {
    panel.add(makeRow(palette[i], names[i]));
  }

  Map.add(panel);
}

addCategoricalLegend(legend, dict, 'Population Count(estimate)');

Map.addLayer(
    landscan_global.sort('system:time_start')
        .first()
        .sldStyle(popcount_intervals),
    {}, 'Population Count Estimate 2000');
Map.addLayer(
    landscan_global.sort('system:time_start', false)
        .first()
        .sldStyle(popcount_intervals),
    {}, 'Population Count Estimate 2022');