- Dataset Availability
- 2007-01-01T00:00:00Z–2009-11-26T23:59:59Z
- Dataset Producer
- Tags
Description
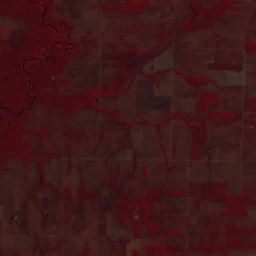
This dataset provides up to a 10-meter resolution multispectral (green, red, and near-infrared) basemap of Brazil, primarily captured in 2008, to support implementation of the Brazil Forest Code. The mosaic is synthesized from SPOT 2, 4, and 5 satellite data. It serves as a higher-resolution alternative to Landsat for identifying consolidated areas, Permanent Protection Areas (APPs), and legal reserves as they existed on the July 22, 2008 regulatory deadline. Gaps in SPOT coverage are represented by a transparent mask to maintain data integrity. This multispectral product is designed to automate Brazil Forest Code related analysis such as identification of forest through vegetation indices like NDVI.
Why Google created this basemap
While raw image collections are also available (see MS, MS_NC, PMS_NC, PAN), this 2008-era multispectral mosaic was synthesized to provide a seamless, ready-to-use product for analysis. By performing radiometric and geometric corrections at scale, raw, disparate satellite scenes were transformed into a unified dataset that supports scientific analysis across Brazil in the context of the Brazil Forest Code, such as historic land cover classification relevant to Brazil's Rural Environmental Registry.
Geographic prioritization and coverage
To maximize immediate environmental impact, image selection prioritized achieving near-complete, high-resolution coverage for privately held lands registered in the Rural Environmental Registry (CAR). Specific focus was given to the Amazon biome and five states in the "Arc of Deforestation" - Maranhão, Mato Grosso, Pará, Rondônia, and Tocantins - where there is an average of 93% state-wide coverage. The average coverage across Brazil is 68% in v1. Gaps in coverage are represented by a transparent mask to maintain data integrity where high-quality 2008-era imagery was unavailable.
Processing methodology
Please see the methodology guide for an in-depth description of the processing, including:
- Radiometric calibration: Raw digital numbers were converted to TOA reflectance using band-specific physical gain and bias metadata, normalized by solar irradiance and Earth-Sun distance.
- Radiometric normalization: To minimize inter-image radiometric discontinuities pixel values were adjusted via histogram matching to a consistent Landsat 2008 mosaic target.
- Edge refinement: Google applied a 2.5-pixel focal minimum erosion to image masks to remove lossy compression artifacts present in the source data.
- Cloud masking: Trained surveyors manually delineated polygons around clouds and shadows, which were converted to a mask to ensure that only the most useful pixels are included in the composite.
- Automated misregistration correction: Select scenes were coregistered using the
ee.Image.registeralgorithm against a 2008-era Landsat reference composite. - Composition: The final mosaic prioritizes the highest resolution pixels available, layering SPOT 5 imagery (10 m) on top of SPOT 4 and 2.
Limitations and known issues
- Spatial completeness: Gaps exist where no imagery met the project’s strict 2008-era temporal window (2007–2009), cloud-cover thresholds, or quality standards.
- Variable native resolution:Boundaries between different nominal resolutions of source imagery may be visible because nearest neighbor resampling was used during processing..
- Residual misregistration: Spatial shifts may persist in some areas, particularly in regions with extreme terrain relief or dense, homogeneous forest areas.
- Atmospheric and cloud artifacts: Manual cloud masking is not exhaustive; users may encounter occasional residual artifacts like thin cirrus haze or small cloud shadows.
- Radiometric inconsistency: Residual spectral variation remains between adjacent images, which may increase spectral variance and reduce the precision of class separation during machine learning inference.
- Spectral saturation: In areas of extreme brightness, pixels may reach the sensor’s maximum detectable limit, resulting in a loss of texture and detail.
Data access
To access this dataset, please fill out the request form.
Bands
Bands
Pixel size: 10 meters (all bands)
| Name | Units | Min | Max | Scale | Pixel Size | Description |
|---|---|---|---|---|---|---|
G |
0* | 10000* | 0.0001 | 10 meters | Green reflectance (top-of-atmosphere) |
|
R |
0* | 10000* | 0.0001 | 10 meters | Red reflectance (top-of-atmosphere) |
|
N |
0* | 10000* | 0.0001 | 10 meters | Near-infrared reflectance (top-of-atmosphere) |
|
date |
seconds | 10 meters | Observation date as epoch (seconds) |
|||
scale |
10 meters | Pixel size of source image (see Methodology) |
||||
satellite |
2 | 5 | 10 meters | Source satellite (SPOT 2, 4, or 5) |
||
coregistered |
0 | 1 | 10 meters | Boolean: 1 if automated misregistration correction was applied (see Methodology) |
Terms of Use
Terms of Use
Use of this dataset is subject to the Brazil Forest Imagery Dataset 2008 license agreement and requires the following attribution:
“Google LLC, Brazil Forest Imagery Dataset 2008 created from circa 2008 SPOT images acquired by CNES's Spot World Heritage Programme.”
Contains modified imagery from SPOT satellites made available by the CNES SPOT World Heritage Programme (https://regards.cnes.fr/html/swh/Home-swh3.html).
Explore with Earth Engine
Code Editor (JavaScript)
// To access this dataset, fill out the form: https://forms.gle/jQmCbWgarjENQBYz6

var analytic = ee.Image('GOOGLE/BRAZIL_FOREST_2008/V1/ANALYTIC');

// Calculate NDVI using the Red (R) and Near-Infrared (N) bands.
var ndvi = analytic.normalizedDifference(['N', 'R']).rename('NDVI');

var ndviParams = {
  min: 0,
  max: 0.75,
  palette: ['white', 'green']
};

Map.setCenter(-55.0, -10.0, 6);
Map.addLayer(ndvi, ndviParams, 'NDVI (Forest Status 2008)');

// Display false color representation.
var nrgVis = {
  bands: ['N', 'R', 'G'],
  min: [156, 62, 53],
  max: [6408, 2584, 2211],
  gamma: [0.9, 0.9, 0.9]
};
Map.addLayer(analytic, nrgVis, 'Multispectral (NIR/R/G)');