
店舗検索は、ユーザーに実店舗への来店を促すために、よく利用される商用ウェブサイトの一部です。この Codelab では、Google App Engine を活用して、位置情報を提供し、自動的にスケールするウェブサイトを構築します。Google Maps JavaScript API を使って、ニューヨーク市の地下鉄をわかりやすくナビゲートする方法を紹介します。
作成するアプリの概要
この Codelab では、ニューヨーク市の地下鉄駅のデータセットを可視化します。内容は次のとおりです。
|
|
ラボの内容
- Google Cloud Shell や Google App Engine などの Google Cloud サービスの使い方
- ウェブで GIS データをスケーラブルな方法で提供する方法
- アプリで Google マップのスタイルを設定する方法
必要なもの
- HTML、CSS、JavaScript、Go、Chrome DevTools の基本的な知識
- ES6 対応のウェブブラウザ(最近のバージョンの Chrome、Firefox、Safari、Edge など)
この Codelab では、Google Maps JavaScript API を中心に説明します。関連のない概念やコードブロックについては詳しく触れず、コードはコピーして貼るだけの状態で提供されています。
環境のセットアップ
Google アカウント(Gmail または Google Apps)をまだお持ちでない場合は、アカウントを作成する必要があります。
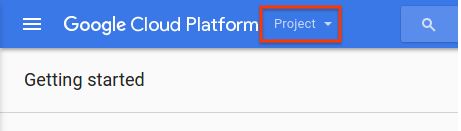
Google Cloud Platform Console(console.cloud.google.com)にログインして、新しいプロジェクトを作成します。画面上部に [プロジェクト] プルダウン メニューがあります。
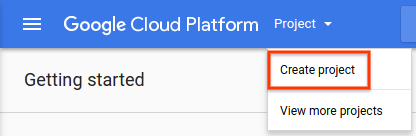
このプロジェクトのプルダウンをクリックすると、新しいプロジェクトを作成するためのメニュー項目が表示されます。
表示されたフォームでプロジェクトの名前を選択します。
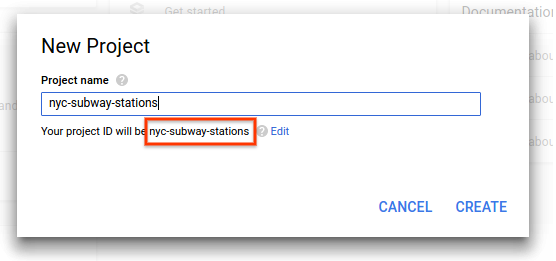
プロジェクト ID は後で使用するため、覚えておいてください。プロジェクト ID は、すべての Google Cloud プロジェクトで一意の名前です。上記の名前はすでに使われており、正しく機能しません。この Codelab の YOUR_PROJECT_ID には、独自のプロジェクト ID を挿入します。
Google Cloud Shell
Google Cloud はノートパソコンからリモートで操作できますが、この Codelab では Cloud で実行するコマンドライン環境である Cloud Shell を使用します。Cloud Shell には、必要なすべての開発ツール(gcloud、go など)を読み込む、自動プロビジョニングされた Linux 仮想マシンが用意されています。永続的なホーム ディレクトリが 5 GB 用意されており、Google Cloud で稼働します。そのため、ネットワークのパフォーマンスと認証機能が大幅に向上しています。
Cloud Shell を有効にするには、Cloud Platform Console の右上のボタンをクリックします(環境のプロビジョニングと接続には少し時間がかかります)。
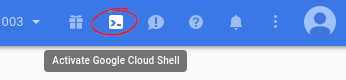
上記のボタンをクリックすると、導入時のインタースティシャルが表示された後、ブラウザの下部に新しいシェルが表示されます。
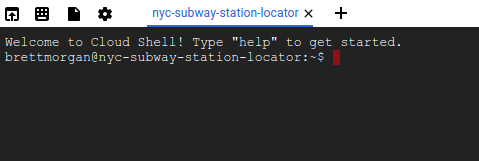
Cloud Shell に接続すると、認証が完了していて、プロジェクトが YOUR_PROJECT_ID に設定されていることがわかります。
gcloud auth list
gcloud config list project
なんらかの理由でプロジェクトが設定されていない場合は、次のコマンドを実行します。
gcloud config set project <YOUR_PROJECT_ID>
Hello World での開発を開始する
Cloud Shell インスタンスで、まずこの Codelab のベースとなる Go App Engine アプリを作成します。
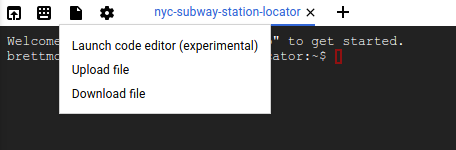
Cloud Shell のツールバーで、ファイル アイコンをクリックしてメニューを開き、[コードエディタを起動] を選択してコードエディタを新しいタブで開きます。このウェブベースのコードエディタを使用すると、Cloud Shell インスタンス内で簡単にファイルを編集できます。
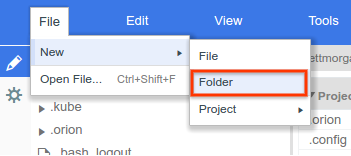
コードエディタでアプリケーションの [nyc-subway] ディレクトリを作成します。それには、[File] メニューを開いて [New > Folder] を選択します。
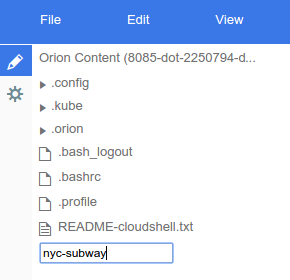
新しいフォルダの名前を nyc-subway とします。
次に、すべてが正常に機能することを確認するための簡単な Go App Engine アプリを作成します。こんにちは世界!
nyc-subway ディレクトリに app.yaml というファイルを作成します。次の内容を app.yaml ファイルに追加します。
app.yaml
runtime: go
api_version: go1

handlers:
- url: /.*
  script: _go_app
この構成ファイルでは、Go スタンダード ランタイムを使用するように App Engine アプリを構成します。このファイルの設定項目の背景情報については、Google App Engine Go スタンダード環境のドキュメントをご覧ください。
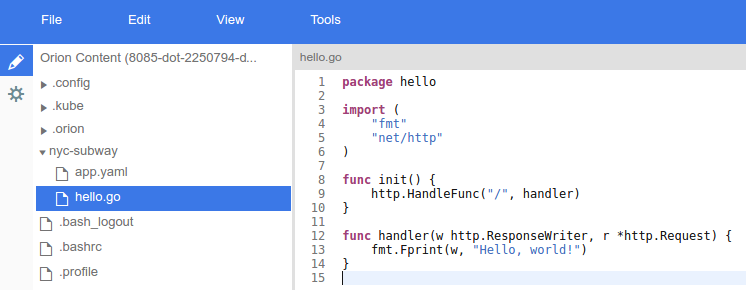
次に、app.yaml ファイルとともに hello.go ファイルを作成します。
hello.go
package hello

import (
    "fmt"
    "net/http"
)

func init() {
    http.HandleFunc("/", handler)
}

func handler(w http.ResponseWriter, r *http.Request) {
        // Writes Hello, World! to the user's web browser via `w`
        fmt.Fprint(w, "Hello, world!")
}ここで少し時間を取り、このコードの機能を大まかに理解しておくことが重要です。init 関数のパス "/" に一致する HTTP リクエストのハンドラ関数を登録する hello というパッケージを定義しました。この関数は、起動時に Go App Engine ランタイムによって呼び出されます。
handler と呼ばれるこのハンドラ関数は、テキスト文字列 "Hello, world!" を単に出力します。このテキストがブラウザに送り返され、読めるようになります。以降のステップでは、簡単なハードコードされた文字列ではなく、GeoJSON データを返すハンドラを作成します。
これらの手順を実行すると、エディタは次のようになります。
このアプリケーションをテストするには、Cloud Shell インスタンス内で App Engine 開発サーバーを実行します。Cloud Shell コマンドラインに戻り、次のように入力します。
cd nyc-subway && goapp serve
数行のログ出力が表示されます。これは、localhost のポート 8080 でリッスンしている Hello World ウェブアプリを使って、Cloud Shell インスタンスで開発サーバーを実行していることを示しています。このアプリでウェブブラウザのタブを開くには、Cloud Shell ツールバーから [ポート 8080 でプレビュー] を選択します。
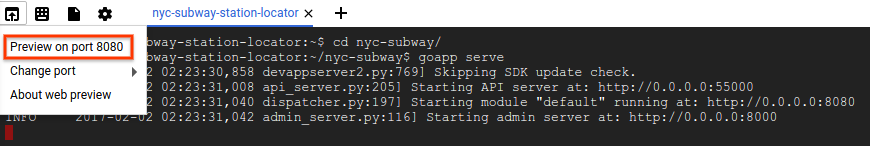
このメニュー項目をクリックするとウェブブラウザに新しいタブが開き、App Engine 開発用サーバーから配信される HTML の内容が表示されます。次のステップでは、このアプリにニューヨーク市の地下鉄データを追加して可視化を開始します。
GeoJSON(GIS 世界の共通語)
前の手順で、後で GeoJSON データをウェブブラウザにレンダリングするハンドラを Go コードで作成すると述べましたが、GeoJSON とは何でしょうか。
地理情報システム(GIS)の世界では、地理エンティティに関する知識をコンピュータ システム間で通信できなければなりません。マップは人間にとって読みやすい形で表示されていますが、コンピュータでは通常、より消化しやすい形式のデータが好まれます。
GeoJSON は、ニューヨーク市の地下鉄駅などの地理的データ構造をエンコードするための形式です。GeoJSON は、インターネット技術特別調査委員会によって制定された RFC7946 という標準を基に標準化されています。GeoJSON は JSON(JavaScript Object Notation)を基準に定義されており、JSON 自体も、JavaScript を標準化した組織である Ecma International によって標準化された ECMA-404 を基に標準化されています。
つまり、GeoJSON は、地理情報を伝えるために広くサポートされている転送形式です。この Codelab では、次のように GeoJSON を使用します。
- Go パッケージを使用して、NYC データを内部 GIS 固有のデータ構造に解析して、リクエストしたデータをフィルタする際に使用します。
- リクエストしたデータをウェブサーバーとウェブブラウザ間の転送用にシリアル化します。
- JavaScript ライブラリを使用して、レスポンスを地図上のマーカーとポリラインに変換します。
これにより、コードを入力する手間が省けます。これは、データ ストリームをメモリ内表現に変換するためにパーサーとジェネレータを記述する必要がないためです。
データの確認
NYC オープンデータは、ニューヨーク市のさまざまな行政機関やその他の市の組織が生成した豊富な一般公開データを一般公開します。この Codelab では、地下鉄駅と地下鉄路線のデータセットを可視化します。
Google Maps JavaScript API のデータレイヤーを使用してレンダリングされた地図上のマーカーを使ってデータを視覚化します。
まず、NYC Open Data ウェブサイトからアプリに GeoJSON データをダウンロードし、Cloud Shell インスタンスのコマンドライン ウィンドウで「[CTRL] + [C]」と入力してサーバーをシャットダウンします。次に、nyc-subway ディレクトリ内に data ディレクトリを作成し、そのディレクトリに移動します。
mkdir data && cd data
次に、curl を使用して地下鉄駅を取得します。
curl "https://data.cityofnewyork.us/api/geospatial/arq3-7z49?method=export&format=GeoJSON" -o subway-stations.geojson
繰り返しになりますが、地下鉄路線は以下のようになります。
curl "https://data.cityofnewyork.us/api/geospatial/3qz8-muuu?method=export&format=GeoJSON" -o subway-lines.geojson
最後に、データ ディレクトリからポップアウトします。
cd ..
次に、より複雑な App Engine アプリケーションを反映するように app.yaml ファイルを更新します。
app.yaml
runtime: go
api_version: go1

handlers:
- url: /
  static_files: static/index.html
  upload: static/index.html
- url: /(.*\.(js|html|css))$
  static_files: static/\1
  upload: static/.*\.(js|html|css)$
- url: /.*
  script: _go_app
この app.yaml 構成は、/、/*.js、/*.css、/*.html に対するリクエストを一連の静的ファイルに送信します。つまり、アプリの静的 HTML コンポーネントは、Go アプリではなく App Engine のファイル配信インフラストラクチャによって直接配信されます。これにより、サーバーの負荷が軽減され、配信速度が向上します。
テキスト エディタに戻り、アプリのメイン ディレクトリの下に static というディレクトリ(nyc-subway/static ディレクトリを作成します)を作成し、この新しいディレクトリに次の 3 つのファイルを追加します。
index.html
<html>
  <head>
    <title>NYC Subway Stations</title>
    <link rel="stylesheet" type="text/css" href="style.css">
  </head>
  <body>
    <div id="map" class="map"></div>

    <script src="app.js"></script>
    <!-- TODO: Replace YOUR_API_KEY in the following line -->
    <script async defer src="https://maps.googleapis.com/maps/api/js?key=YOUR_API_KEY&callback=initMap">
    </script>
  </body>
</html>
index.html は、ブラウザがウェブ アプリケーションのルートをリクエストしたときに最初に提供されるファイルです。このファイルは、地図を格納する <div> を設定し、地図のスタイルを設定する CSS を読み込み、地図を設定する JavaScript ファイルを取得して、最後に Google Maps JavaScript API を読み込みます。
上記の簡単な HTML ソースの YOUR_API_KEY を実際の Google Maps API キーに置き換えるには、簡単なバージョンがあります。次のステップに従って、API キーを取得します。
- Google API Console に移動します。(適切な API を有効にするためのスマート機能があるため、このリンクを使用します)。
- この Codelab の前半で作成したプロジェクトを選択します。
- [続行] をクリックして API と関連サービスを有効にします。
- 認証情報のページで [公開データ] をクリックし、[次へ] をクリックして API キーを取得します。この Codelab の目的では、この API キーに制限を追加する必要はありません。
- API キーをコピーして、上記の HTML ファイルに入力します。このチュートリアルの次のステップでは、この API キーも必要になります。
YOUR_API_KEY を置き換えると、スクリプト リソースは次のようになります。
<script async defer
    src="https://maps.googleapis.com/maps/api/js?key=AIza12345678ABC_DEFGHIJ&callback=initMap">
style.css
.map {
    height: 100%;
}

html, body {
    height: 100%;
    margin: 0;
    padding: 0;
}
新しいファイル static/style.css を作成します。これは、地図が余白やパディングなしでページ全体を占有する CSS スタイル ファイルです。
app.js
// Eslint configuration for editor.
/* globals google */
/* eslint-env browser */
/* eslint quotes: ["warn", "single"]*/

function initMap() {
  const map = new google.maps.Map(document.querySelector('#map'), {
    zoom: 11,
    center: {
      // New York City
      lat: 40.7305,
      lng: -73.9091
    }
  });
  map.data.loadGeoJson('/data/subway-stations');
  map.data.loadGeoJson('/data/subway-lines');
}
static/app.js という新しいファイルを作成します。これは、ズームレベル 11 の地図をニューヨーク市の中央に配置する JavaScript ファイルです。次に、前のステップで取得した地下鉄駅と地下鉄の GeoJSON データの両方を読み込みます。
目を見張るようなワシ。あなたはアプリケーション フォルダ内に GeoJSON データがありますが、app.yaml ファイルには公開されていません。ここでは Go アプリから GeoJSON データが提供されるため、以降の手順でデータを使用してスマートな作業を行うことができます。
次に、Go のソースコードを更新します。このアプリの動作を反映させるために、前の手順の hello.go ファイルの名前を nycsubway.go に変更します(メニュー: 編集 - > 名前変更)。
nycsubway.go
package nycsubway

import (
        "io/ioutil"
        "log"
        "net/http"
        "path/filepath"
)

// GeoJSON is a cache of the NYC Subway Station and Line data.
var GeoJSON = make(map[string][]byte)

// cacheGeoJSON loads files under data into `GeoJSON`.
func cacheGeoJSON() {
        filenames, err := filepath.Glob("data/*")
        if err != nil {
                log.Fatal(err)
        }
        for _, f := range filenames {
                name := filepath.Base(f)
                dat, err := ioutil.ReadFile(f)
                if err != nil {
                        log.Fatal(err)
                }
                GeoJSON[name] = dat
        }
}

// init is called from the App Engine runtime to initialize the app.
func init() {
        cacheGeoJSON()
        http.HandleFunc("/data/subway-stations", subwayStationsHandler)
        http.HandleFunc("/data/subway-lines", subwayLinesHandler)
}

func subwayStationsHandler(w http.ResponseWriter, r *http.Request) {
        w.Header().Set("Content-type", "application/json")
        w.Write(GeoJSON["subway-stations.geojson"])
}

func subwayLinesHandler(w http.ResponseWriter, r *http.Request) {
        w.Header().Set("Content-type", "application/json")
        w.Write(GeoJSON["subway-lines.geojson"])
}
このコードはいくつかのことを行います。起動時に data/ の下にあるすべてのファイルがメモリに読み込まれ、/data/ 下のファイル リクエストを処理するように自動的に構成されます。これは、リンクがないリンクです。以降のステップでは、卸売に提供するだけでなく、GeoJSON データを使用してよりインテリジェントな処理を行います。
これで、ウェブ アプリケーションをローカルで再実行する準備ができました。また、go fmt コマンドを定期的に使用し、コードに紛らわしい書式ミスがあれば修正することもおすすめします。nyc-subway ディレクトリに移動して、次のコマンドを実行します。
go fmt nycsubway.go && goapp serve
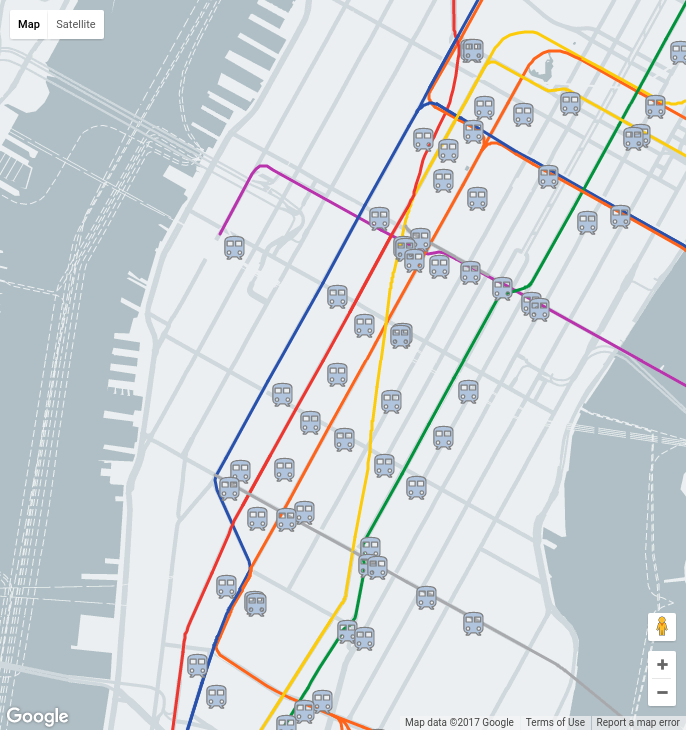
ウェブ プレビューを再度開くと、次のようなビューが表示されます。
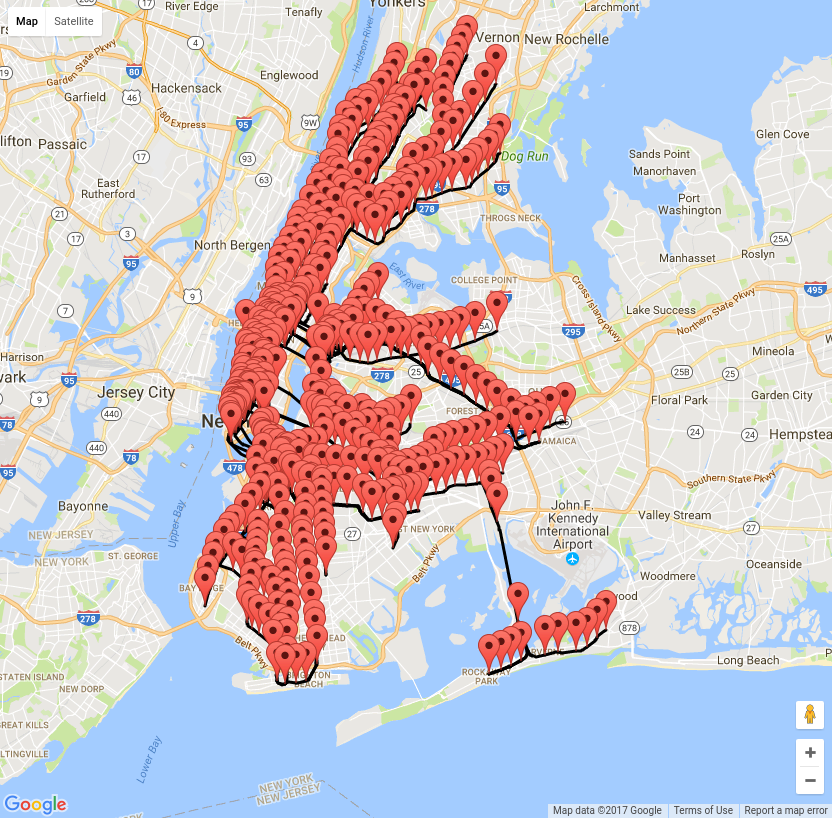
ここまでに達成したことは何ですか。Go サーバーが、ニューヨーク市の地下鉄駅と鉄道路線をすべて含んだブラウザにコンテンツを提供しているとします。実際は地下鉄の地図のようには見えません。
次のステップでは、この地図のスタイルを地下鉄路線図のように変更します。
地図に関する重要な要件の 1 つは、効果的なコミュニケーションを図ることです。地下鉄路線が基本地図タイルのすべての情報と競合していない方がよいでしょう。このステップでは、地図のスタイルを使用して地図上の情報を非表示にし、色をグレーにドロップします。次に、ニューヨーク市の地下鉄の命名法に基づいて地下鉄路線のスタイルを設定する JavaScript コードを追加します。
地図のスタイルを設定する
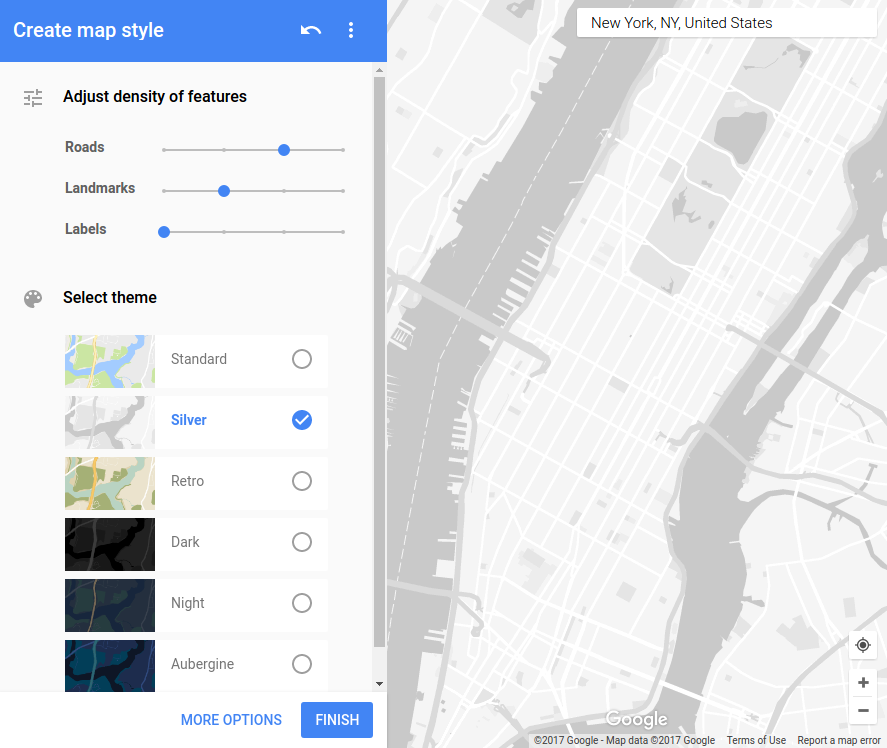
mapstyle.withgoogle.com を開き、[Create a Style] ボタンをクリックします。
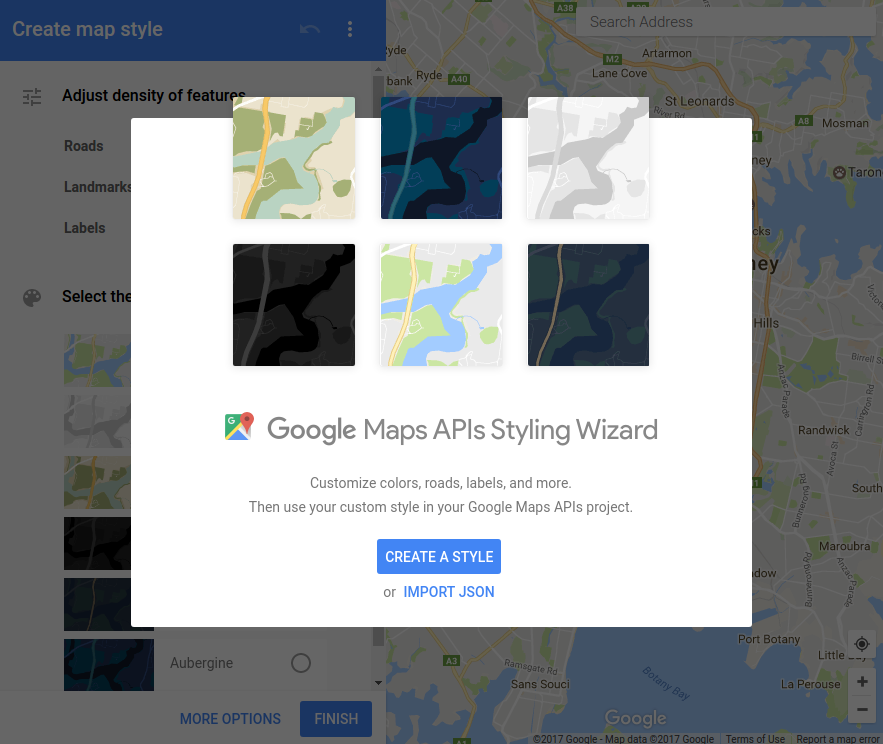
これにより、左側に地図のスタイル属性のコレクション、右側にスタイルなしの地図を示す画面が表示されます。以下のスクリーンショットでは、ランドマークとラベルの密度を下げ、シルバー テーマを使用して基本地図の色をドロップしています。別のテーマを試すか、画面下部の [その他のオプション] ボタンをクリックして、利用可能なすべてのスタイル設定機能を確認してください。
準備ができたら、[Finish] ボタンをクリックします。
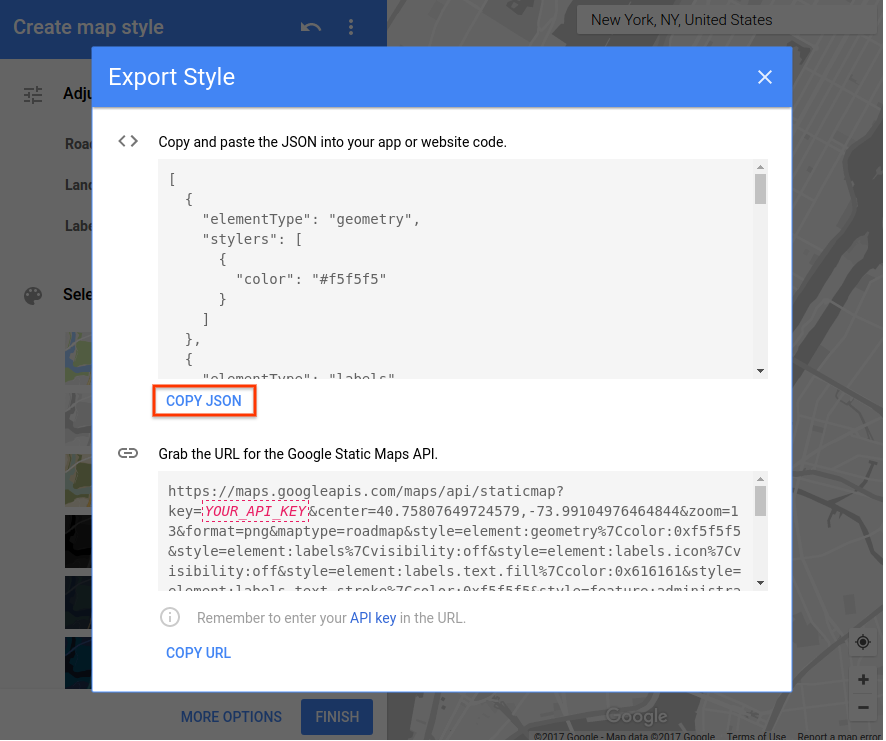
次に、設定した地図のスタイルの JSON 記述を抽出します。これにより、次のステップではスタイル設定 JSON をコードに追加できます。[JSON をコピー] ボタンをクリックします。
前のステップで作成した app.js ファイルに戻ります。ここでは、作成した地図のスタイルを地図に適用するためのコードと、駅やラインのスタイルを設定するためのコードを追加します。
app.js
// Eslint configuration for editor.
/* globals google */
/* eslint-env browser */
/* eslint quotes: ["warn", "single"]*/

// Replace the following with the JSON from the Styling Wizard
const mapStyle = [
  {
    elementType: 'geometry',
    stylers: [
      {
        color: '#eceff1'
      }
    ]
  },
  {
    elementType: 'labels',
    stylers: [
      {
        visibility: 'off'
      }
    ]
  },
  {
    featureType: 'administrative',
    elementType: 'labels',
    stylers: [
      {
        visibility: 'off'
      }
    ]
  },
  {
    featureType: 'road',
    elementType: 'geometry',
    stylers: [
      {
        color: '#cfd8dc'
      }
    ]
  },
  {
    featureType: 'road',
    elementType: 'geometry.stroke',
    stylers: [
      {
        visibility: 'off'
      }
    ]
  },
  {
    featureType: 'road.local',
    stylers: [
      {
        visibility: 'off'
      }
    ]
  },
  {
    featureType: 'water',
    stylers: [
      {
        color: '#b0bec5'
      }
    ]
  }
];

// Colors from https://en.wikipedia.org/wiki/New_York_City_Subway_nomenclature#Colors_and_trunk_lines
const routeColors = {
  // IND Eighth Avenue Line
  A: '#2850ad',
  C: '#2850ad',
  E: '#2850ad',

  // IND Sixth Avenue Line
  B: '#ff6319',
  D: '#ff6319',
  F: '#ff6319',
  M: '#ff6319',

  // IND Crosstown Line
  G: '#6cbe45',

  // BMT Canarsie Line
  L: '#a7a9ac',

  // BMT Nassau Street Line
  J: '#996633',
  Z: '#996633',

  // BMT Broadway Line
  N: '#fccc0a',
  Q: '#fccc0a',
  R: '#fccc0a',
  W: '#fccc0a',

  // IRT Broadway – Seventh Avenue Line
  '1': '#ee352e',
  '2': '#ee352e',
  '3': '#ee352e',

  // IRT Lexington Avenue Line
  '4': '#00933c',
  '5': '#00933c',
  '6': '#00933c',

  // IRT Flushing Line
  '7': '#b933ad',

  // Shuttles
  S: '#808183'
};

// initMap is called from the Google Maps JS library after the library has initialised itself.
function initMap() {
  const map = new google.maps.Map(document.querySelector('#map'), {
    zoom: 12,
    center: {
      // New York City
      lat: 40.7305,
      lng: -73.9091
    },
    styles: mapStyle
  });
  const infowindow = new google.maps.InfoWindow();

  // Load GeoJSON data from the back end
  map.data.loadGeoJson('/data/subway-stations');
  map.data.loadGeoJson('/data/subway-lines');

  // Style the GeoJSON features (stations & lines)
  map.data.setStyle(feature => {
    const line = feature.getProperty('line');
    // Stations have line property, while lines do not.
    if (line) {
      // Icon path from: https://material.io/icons/#ic_train
      return {
        icon: {
          fillColor: '#00b0ff',
          strokeColor: '#3c8cb8',
          fillOpacity: 1.0,
          scale: 1.2,
          path: 'M12 2c-4 0-8 .5-8 4v9.5C4 17.43 5.57 19 7.5 19L6 20.5v.5h2.2' +
            '3l2-2H14l2 2h2v-.5L16.5 19c1.93 0 3.5-1.57 3.5-3.5V6c0-3.5-3.58-' +
            '4-8-4zM7.5 17c-.83 0-1.5-.67-1.5-1.5S6.67 14 7.5 14s1.5.67 1.5 1' +
            '.5S8.33 17 7.5 17zm3.5-7H6V6h5v4zm2 0V6h5v4h-5zm3.5 7c-.83 0-1.5' +
            '-.67-1.5-1.5s.67-1.5 1.5-1.5 1.5.67 1.5 1.5-.67 1.5-1.5 1.5z'
        }
      };
    }

    // if type is not a station, it's a subway line
    const routeSymbol = feature.getProperty('rt_symbol');

    return {
      strokeColor: routeColors[routeSymbol]
    };
  });

  map.data.addListener('click', ev => {
    const f = ev.feature;
    const stationName = f.getProperty('name');
    let line = f.getProperty('line');
    // Stations have line property, while lines do not.
    if (!line) {
      return;
    }
    if (line.includes('-')) {
      line += ' lines';
    } else {
      line += ' line';
    }
    infowindow.setContent(`<b>${stationName} Station</b><br/>Serves ${line}`);
    // Hat tip geocodezip: http://stackoverflow.com/questions/23814197
    infowindow.setPosition(f.getGeometry().get());
    infowindow.setOptions({
      pixelOffset: new google.maps.Size(0, -30)
    });
    infowindow.open(map);
  });
}
ここでは多くのコードを追加しています。それでは内容を確認していきましょう。
最初に定義する定数は mapStyle です。このブロックを、mapstyle.withgoogle.com で作成した JSON コンテンツに置き換える必要があります。これにより、基本地図タイルのスタイルが変更されます。上のスニペットのスタイルは、地図をユーザーの注意に合わせて背景にドロップし、地下鉄の路線と駅が支配するように設計されています。
次に定義する定数は、routeColors という名前のハッシュマップです。この定数は、ニューヨーク市の地下鉄の命名法に応じて地下鉄路線のスタイル設定に使用されます。次に、Google Maps JavaScript API が呼び出し、地図の内容を初期化するための initMap 関数を用意します。
この関数の前半の行に、前のステップの知識が付くはずです。地図を初期化し、ステーションと線の両方の GeoJSON を読み込みます。ここでは 2 つの追加方法があります。1 つ目は styles 属性を Google マップ コンストラクタに追加して mapStyle にリンクするものです。2 つ目は InfoWindow の定数定義です。
InfoWindow は、地下鉄駅をクリックすると表示されるポップアップ ウィンドウです。これを、データレイヤーに追加するクリック リスナーで使用します。ユーザーがクリックしたステーションの有用なテキストを記述し、InfoWindow を開く JavaScript ブロックがあります。
新しいコードは、Google マップのデータレイヤのコンテンツのスタイルです。このインライン関数は、データレイヤー内の各アイテムに対して、Google マップのデータレイヤによって呼び出されます。画面上のスタイルを定義する JavaScript オブジェクトが返されます。この機能の使用方法について詳しくは、GeoJSON データのスタイル設定をご覧ください。
ウェブブラウザでアプリを再度プレビューすると、次のように表示されます。
基本地図のスタイルや駅アイコンを変更するなど、このコードを 1 ~ 5 分使ってみてください。わからないコードは、機能を解読して解明する方法が最善です。次のステップでは、ブラウザでのダウンロードと解析の両方で必要な GeoJSON データの量を減らす方法について説明します。
このステップでは、Go バックエンドにコードを追加して、返されるステーションを地図の表示領域だけに絞り込みます。フィルタリングの長所は、ユーザーのブラウザに送信されるデータセットのサイズが小さくなり、サイトのパフォーマンスが向上することです。
フロントエンドではステーションの取得に使用される API エンドポイントがありますが、現在、クライアントはユーザーが閲覧している可視エリアを提供していません。そのため、まず、リクエストされた URL に表示可能なマップ領域をパラメータとして追加します。その場合は、アイドル状態のコールバックが呼び出されるまで、地下鉄駅の GeoJSON の読み込みを遅らせます。これで、地図のビューポートにアクセスできます。
app.js
// Eslint configuration for editor.
/* globals google */
/* eslint-env browser */
/* eslint quotes: ["warn", "single"]*/

// Map Style for the basemap tiles.
const mapStyle = [
  {
    elementType: 'geometry',
    stylers: [
      {
        color: '#eceff1'
      }
    ]
  },
  {
    elementType: 'labels',
    stylers: [
      {
        visibility: 'off'
      }
    ]
  },
  {
    featureType: 'administrative',
    elementType: 'labels',
    stylers: [
      {
        visibility: 'off'
      }
    ]
  },
  {
    featureType: 'road',
    elementType: 'geometry',
    stylers: [
      {
        color: '#cfd8dc'
      }
    ]
  },
  {
    featureType: 'road',
    elementType: 'geometry.stroke',
    stylers: [
      {
        visibility: 'off'
      }
    ]
  },
  {
    featureType: 'road.local',
    stylers: [
      {
        visibility: 'off'
      }
    ]
  },
  {
    featureType: 'water',
    stylers: [
      {
        color: '#b0bec5'
      }
    ]
  }
];

// Colors from https://en.wikipedia.org/wiki/New_York_City_Subway_nomenclature#Colors_and_trunk_lines
const routeColors = {
  // IND Eighth Avenue Line
  A: '#2850ad',
  C: '#2850ad',
  E: '#2850ad',

  // IND Sixth Avenue Line
  B: '#ff6319',
  D: '#ff6319',
  F: '#ff6319',
  M: '#ff6319',

  // IND Crosstown Line
  G: '#6cbe45',

  // BMT Canarsie Line
  L: '#a7a9ac',

  // BMT Nassau Street Line
  J: '#996633',
  Z: '#996633',

  // BMT Broadway Line
  N: '#fccc0a',
  Q: '#fccc0a',
  R: '#fccc0a',
  W: '#fccc0a',

  // IRT Broadway – Seventh Avenue Line
  '1': '#ee352e',
  '2': '#ee352e',
  '3': '#ee352e',

  // IRT Lexington Avenue Line
  '4': '#00933c',
  '5': '#00933c',
  '6': '#00933c',

  // IRT Flushing Line
  '7': '#b933ad',

  // Shuttles
  S: '#808183'
};

// initMap is called from the Google Maps JS library after the library has initialised itself.
function initMap() {
  const map = new google.maps.Map(document.querySelector('#map'), {
    zoom: 12,
    center: {
      // New York City
      lat: 40.7305,
      lng: -73.9091
    },
    styles: mapStyle
  });
  const infowindow = new google.maps.InfoWindow();
  let stationDataFeatures = [];

  // Load GeoJSON for subway lines. Stations are loaded in the idle callback.
  map.data.loadGeoJson('/data/subway-lines');

  // Style the GeoJSON features (stations & lines)
  map.data.setStyle(feature => {
    const line = feature.getProperty('line');
    // Stations have line property, while lines do not.
    if (line) {
      // Icon path from: https://material.io/icons/#ic_train
      return {
        icon: {
          fillColor: '#00b0ff',
          strokeColor: '#3c8cb8',
          fillOpacity: 1.0,
          scale: 1.2,
          path: 'M12 2c-4 0-8 .5-8 4v9.5C4 17.43 5.57 19 7.5 19L6 20.5v.5h2.2' +
            '3l2-2H14l2 2h2v-.5L16.5 19c1.93 0 3.5-1.57 3.5-3.5V6c0-3.5-3.58-' +
            '4-8-4zM7.5 17c-.83 0-1.5-.67-1.5-1.5S6.67 14 7.5 14s1.5.67 1.5 1' +
            '.5S8.33 17 7.5 17zm3.5-7H6V6h5v4zm2 0V6h5v4h-5zm3.5 7c-.83 0-1.5' +
            '-.67-1.5-1.5s.67-1.5 1.5-1.5 1.5.67 1.5 1.5-.67 1.5-1.5 1.5z'
        }
      };
    }

    // if type is not a station, it's a subway line
    const routeSymbol = feature.getProperty('rt_symbol');
    return {
      strokeColor: routeColors[routeSymbol]
    };
  });

  map.data.addListener('click', ev => {
    const f = ev.feature;
    const stationName = f.getProperty('name');
    let line = f.getProperty('line');
    // Stations have line property, while lines do not.
    if (!line) {
      return;
    }
    if (line.includes('-')) {
      line += ' lines';
    } else {
      line += ' line';
    }
    infowindow.setContent(`<b>${stationName} Station</b><br/>Serves ${line}`);
    // Hat tip geocodezip: http://stackoverflow.com/questions/23814197
    infowindow.setPosition(f.getGeometry().get());
    infowindow.setOptions({
      pixelOffset: new google.maps.Size(0, -30)
    });
    infowindow.open(map);
  });

  // The idle callback is called every time the map has finished
  // moving, zooming,  panning or animating. We use it to load
  // Geojson for the new viewport.
  google.maps.event.addListener(map, 'idle', () => {
    const sw = map.getBounds().getSouthWest();
    const ne = map.getBounds().getNorthEast();
    map.data.loadGeoJson(
      `/data/subway-stations?viewport=${sw.lat()},${sw.lng()}|${ne.lat()},${ne.lng()}`,
      null,
      features => {
        stationDataFeatures.forEach(dataFeature => {
          map.data.remove(dataFeature);
        });
        stationDataFeatures = features;
      }
    );
  });
}
更新された app.js には、JavaScript を読みやすくするための ES6 機能がいくつか導入されています。これは、現在のほぼすべてのウェブブラウザで正常に動作します。この JavaScript を本番環境のウェブサイトに使用する前に、ES5 にトランスパイルする必要がありますが、このチュートリアルでは ES6 を使用しても問題ありません。Google では、ES6 スタイルのテンプレート リテラルとファットアローの構文を使用して、ボイラープレート コードを削減しています。
このコードには、前のステップよりもいくつかの追加が含まれています。地図にビューポートの境界を確認し、地下鉄 GeoGeo データをリクエストするために使用する URL にそれを追加するアイドル コールバックがあります。これらのパラメータを利用するように、バックエンドを更新します。新しいステーションをロードした後にステーションの機能を削除できるよう、状態を追加しました。
次に、フロントエンドから報告されたビューポートに基づいて、返されるステーションをフィルタする機能を追加する必要があります。サーバー用にいくつかの Go パッケージをインストールする必要があります。Cloud Shell コマンドラインで [CTRL] + [c] を使用してサーバーをシャットダウンし、次のコマンドを入力します。
go get github.com/paulmach/go.geojson
および:
go get github.com/dhconnelly/rtreego
これらのパッケージには次の機能があります。
- github.com/paulmach/go.geojson で GeoJSON を解析します。
- github.com/dhconnelly/rtreego を使用して、ビューボックス制限付きクエリを効率的に実行する
次に、新しい go ファイルを作成して、subway-stations.geojson ファイルからコンテンツを解析して結果のステーションを R ツリーデータ構造に保存し、/subway-stations リクエストに応答します。エディタで、stations.go という名前の nycsubway.go ファイルとともに新しいファイルを作成します。
stations.go
package nycsubway

import (
        "encoding/json"
        "fmt"
        "log"
        "math"
        "net/http"
        "strconv"
        "strings"

        rtree "github.com/dhconnelly/rtreego"
        geojson "github.com/paulmach/go.geojson"
)

// Stations is an RTree housing the stations
var Stations = rtree.NewTree(2, 25, 50)

// Station is a wrapper for `*geojson.Feature` so that we can implement
// `rtree.Spatial` interface type.
type Station struct {
        feature *geojson.Feature
}

// Bounds implements `rtree.Spatial` so we can load
// stations into an `rtree.Rtree`.
func (s *Station) Bounds() *rtree.Rect {
        return rtree.Point{
                s.feature.Geometry.Point[0],
                s.feature.Geometry.Point[1],
        }.ToRect(1e-6)
}

// loadStations loads the geojson features from
// `subway-stations.geojson` into the `Stations` rtree.
func loadStations() {
        stationsGeojson := GeoJSON["subway-stations.geojson"]
        fc, err := geojson.UnmarshalFeatureCollection(stationsGeojson)
        if err != nil {
                // Note: this will take down the GAE instance by exiting this process.
                log.Fatal(err)
        }
        for _, f := range fc.Features {
                Stations.Insert(&Station{f})
        }
}

// subwayStationsHandler reads r for a "viewport" query parameter
// and writes a GeoJSON response of the features contained in
// that viewport into w.
func subwayStationsHandler(w http.ResponseWriter, r *http.Request) {
        w.Header().Set("Content-type", "application/json")
        vp := r.FormValue("viewport")
        rect, err := newRect(vp)
        if err != nil {
                str := fmt.Sprintf("Couldn't parse viewport: %s", err)
                http.Error(w, str, 400)
                return
        }
        s := Stations.SearchIntersect(rect)
        fc := geojson.NewFeatureCollection()
        for _, station := range s {
                fc.AddFeature(station.(*Station).feature)
        }
        err = json.NewEncoder(w).Encode(fc)
        if err != nil {
                str := fmt.Sprintf("Couldn't encode results: %s", err)
                http.Error(w, str, 500)
                return
        }
}

// newRect constructs a `*rtree.Rect` for a viewport.
func newRect(vp string) (*rtree.Rect, error) {
        ss := strings.Split(vp, "|")
        sw := strings.Split(ss[0], ",")
        swLat, err := strconv.ParseFloat(sw[0], 64)
        if err != nil {
                return nil, err
        }
        swLng, err := strconv.ParseFloat(sw[1], 64)
        if err != nil {
                return nil, err
        }
        ne := strings.Split(ss[1], ",")
        neLat, err := strconv.ParseFloat(ne[0], 64)
        if err != nil {
                return nil, err
        }
        neLng, err := strconv.ParseFloat(ne[1], 64)
        if err != nil {
                return nil, err
        }
        minLat := math.Min(swLat, neLat)
        minLng := math.Min(swLng, neLng)
        distLat := math.Max(swLat, neLat) - minLat
        distLng := math.Max(swLng, neLng) - minLng

        r, err := rtree.NewRect(
                rtree.Point{
                        minLng,
                        minLat,
                },
                []float64{
                        distLng,
                        distLat,
                })
        if err != nil {
                return nil, err
        }
        return r, nil
}このファイルはかなりの量を占めているため、論理ユニットで確認していきましょう。package 行と import スタンザは、nycsubway.go で宣言されたものと同じパッケージにこのファイルを配置し、必要な依存関係をインポートします。
stations 変数は、ニューヨーク市の地下鉄のすべてのステーションを格納する R ツリーを宣言します。R ツリーデータ構造は、指定された境界ボックス内にあるすべてのポイントを表示するなどの地理的クエリを念頭に置いて設計されています。ビューポート内のステーションを見つけるのに役立ちます。
次に、Station 構造体を定義します。これは、解析された GeoJSON データを Stations R ツリーにインポートする方法です。*geojson.Feature をラップし、Bounds() を関数として *Station に実装します。このようにすることで、Station は rtree.Insert で要求されている rtree.Spatial インターフェースを実装します。
次に、このモジュールが初期化されたときに呼び出される loadStations() 関数を定義します。この関数は、以下の nycsubway.go を更新したときに表示されます。最後に、subwayStationsHandler() 関数とその newRect(string) ヘルパー関数を定義します。newRect は長いですが、上記の app.js で作成した viewport パラメータを、Stations R ツリーが理解できる検索クエリに変換するだけです。
フロントエンドが /data/subway-stations エンドポイントにリクエストを行うと、subwayStationsHandler が呼び出されます。この関数は基本的に viewport パラメータを取得し、前述の newRect ヘルパー関数を使用して検索クエリに変換します。さらに、Stations R ツリーに対してクエリを実行し、返されたステーションを JSON に変換してからブラウザに書き込まれます。
nycsubway.go 関数に nycsubway.go を少し変更します。これは、subwayStationsHandler 関数が stations.go に移動し、init() 関数に loadStations() の呼び出しを追加する必要があるためです。
nycsubway.go
package nycsubway

import (
        "io/ioutil"
        "log"
        "net/http"
        "path/filepath"
)

// GeoJSON is a cache of the NYC Subway Station and Line data.
var GeoJSON = make(map[string][]byte)

// cacheGeoJSON loads files under data into `GeoJSON`.
func cacheGeoJSON() {
        filenames, err := filepath.Glob("data/*")
        if err != nil {
                // Note: this will take down the GAE instance by exiting this process.
                log.Fatal(err)
        }
        for _, f := range filenames {
                name := filepath.Base(f)
                dat, err := ioutil.ReadFile(f)
                if err != nil {
                        log.Fatal(err)
                }
                GeoJSON[name] = dat
        }
}

// init is called from the App Engine runtime to initialize the app.
func init() {
        cacheGeoJSON()
        loadStations()
        http.HandleFunc("/data/subway-stations", subwayStationsHandler)
        http.HandleFunc("/data/subway-lines", subwayLinesHandler)
}

func subwayLinesHandler(w http.ResponseWriter, r *http.Request) {
        w.Header().Set("Content-type", "application/json")
        w.Write(GeoJSON["subway-lines.geojson"])
}
これで、サーバーを再起動すると、更新されたコンテンツがウェブブラウザに表示されるようになります。
go fmt *.go && goapp serve
地図をズームインまたはズームアウトしたり、地図をパンしたりすると、ビューポートの端付近でステーションが奇妙な形で再表示されます。これは、このバージョンでは、返されたステーションを現在のブラウザのビューポートに厳密に切り抜いたためです。この問題を回避するには、Stations R ツリーのクエリに使用するビューポートを開きます。また、ステーションをクラスタ化することで、地図が最初に表示されるときに表示されるステーションの数を減らすこともできます。これが次のステップの焦点です。
このステップでは、ニューヨーク市の地下鉄の約 400 のステーションをクラスタ化し、マップの閲覧中に、ユーザーがステーションに圧倒されないようにします。そのためには、フロントエンドとバックエンドの両方のコードを変更する必要があります。ポイントは単なるステーションではなく、フロントエンドの変更が必要です。各地点は、ステーションまたはステーションのクラスタのいずれかになります。バックエンドでは、ステーションをクラスタにグループ化し、クラスタと個々のステーションの両方で機能する情報ウィンドウ(ポップアップ)用の有用な情報を生成するコードを追加する必要があります。
app.js ファイルには 3 つの主要な変更を加える必要があります。
- clusterer の実装で使用する、地図の現在のズームレベルを
/data/subway-stationsAJAX リクエストに追加します。 - 地下鉄駅と駅のクラスタを視覚的に区別できるように、マーカーの動的なスタイル設定を追加します。
- バックエンドから返される GeoJSON がタイトルと説明のコンテンツの入力を行うようになったため、クリック ハンドラの情報ウィンドウの構成コードを簡略化できます。
app.js
// Eslint configuration for editor.
/* globals google */
/* eslint-env browser */
/* eslint quotes: ["warn", "single"]*/

// Map Style for the basemap tiles.
const mapStyle = [
  {
    elementType: 'geometry',
    stylers: [
      {
        color: '#eceff1'
      }
    ]
  },
  {
    elementType: 'labels',
    stylers: [
      {
        visibility: 'off'
      }
    ]
  },
  {
    featureType: 'administrative',
    elementType: 'labels',
    stylers: [
      {
        visibility: 'off'
      }
    ]
  },
  {
    featureType: 'road',
    elementType: 'geometry',
    stylers: [
      {
        color: '#cfd8dc'
      }
    ]
  },
  {
    featureType: 'road',
    elementType: 'geometry.stroke',
    stylers: [
      {
        visibility: 'off'
      }
    ]
  },
  {
    featureType: 'road.local',
    stylers: [
      {
        visibility: 'off'
      }
    ]
  },
  {
    featureType: 'water',
    stylers: [
      {
        color: '#b0bec5'
      }
    ]
  }
];

// Colors from https://en.wikipedia.org/wiki/New_York_City_Subway_nomenclature#Colors_and_trunk_lines
const routeColors = {
  // IND Eighth Avenue Line
  A: '#2850ad',
  C: '#2850ad',
  E: '#2850ad',

  // IND Sixth Avenue Line
  B: '#ff6319',
  D: '#ff6319',
  F: '#ff6319',
  M: '#ff6319',

  // IND Crosstown Line
  G: '#6cbe45',

  // BMT Canarsie Line
  L: '#a7a9ac',

  // BMT Nassau Street Line
  J: '#996633',
  Z: '#996633',

  // BMT Broadway Line
  N: '#fccc0a',
  Q: '#fccc0a',
  R: '#fccc0a',
  W: '#fccc0a',

  // IRT Broadway – Seventh Avenue Line
  '1': '#ee352e',
  '2': '#ee352e',
  '3': '#ee352e',

  // IRT Lexington Avenue Line
  '4': '#00933c',
  '5': '#00933c',
  '6': '#00933c',

  // IRT Flushing Line
  '7': '#b933ad',

  // Shuttles
  S: '#808183'
};

// initMap is called from the Google Maps JS library after the library has initialised itself.
function initMap() {
  const map = new google.maps.Map(document.querySelector('#map'), {
    zoom: 12,
    center: {
      // New York City
      lat: 40.7305,
      lng: -73.9091
    },
    styles: mapStyle
  });
  const infowindow = new google.maps.InfoWindow();
  let stationDataFeatures = [];

  // Load GeoJSON for subway lines. Stations are loaded in the idle callback.
  map.data.loadGeoJson('/data/subway-lines');

  // Style the GeoJSON features (stations & lines)
  map.data.setStyle(feature => {
    const type = feature.getProperty('type');
    if (type === 'cluster') {
      // Icon path from: https://material.io/icons/#ic_add_circle_outline
      return {
        icon: {
          fillColor: '#00b0ff',
          strokeColor: '#3c8cb8',
          fillOpacity: 1.0,
          scale: 1.2,
          path: 'M13 7h-2v4H7v2h4v4h2v-4h4v-2h-4V7zm-1-5C6.48 2 2 6.48 2 12s4' +
            '.48 10 10 10 10-4.48 10-10S17.52 2 12 2zm0 18c-4.41 0-8-3.59-8-8' +
            's3.59-8 8-8 8 3.59 8 8-3.59 8-8 8z'
        }
      };
    } else if (type === 'station') {
      // Icon path from: https://material.io/icons/#ic_train
      return {
        icon: {
          fillColor: '#00b0ff',
          strokeColor: '#3c8cb8',
          fillOpacity: 1.0,
          scale: 1.2,
          path: 'M12 2c-4 0-8 .5-8 4v9.5C4 17.43 5.57 19 7.5 19L6 20.5v.5h2.2' +
            '3l2-2H14l2 2h2v-.5L16.5 19c1.93 0 3.5-1.57 3.5-3.5V6c0-3.5-3.58-' +
            '4-8-4zM7.5 17c-.83 0-1.5-.67-1.5-1.5S6.67 14 7.5 14s1.5.67 1.5 1' +
            '.5S8.33 17 7.5 17zm3.5-7H6V6h5v4zm2 0V6h5v4h-5zm3.5 7c-.83 0-1.5' +
            '-.67-1.5-1.5s.67-1.5 1.5-1.5 1.5.67 1.5 1.5-.67 1.5-1.5 1.5z'
        }
      };
    }

    // if type is not a station or a cluster, it's a subway line
    const routeSymbol = feature.getProperty('rt_symbol');
    return {
      strokeColor: routeColors[routeSymbol]
    };
  });

  map.data.addListener('click', ev => {
    const f = ev.feature;
    const title = f.getProperty('title');
    const description = f.getProperty('description');

    if (!description) {
      return;
    }

    infowindow.setContent(`<b>${title}</b><br/> ${description}`);
    // Hat tip geocodezip: http://stackoverflow.com/questions/23814197
    infowindow.setPosition(f.getGeometry().get());
    infowindow.setOptions({
      pixelOffset: new google.maps.Size(0, -30)
    });
    infowindow.open(map);
  });

  // The idle callback is called every time the map has finished
  // moving, zooming,  panning or animating. We use it to load
  // Geojson for the new viewport.
  google.maps.event.addListener(map, 'idle', () => {
    const sw = map.getBounds().getSouthWest();
    const ne = map.getBounds().getNorthEast();
    const zm = map.getZoom();
    map.data.loadGeoJson(
      `/data/subway-stations?viewport=${sw.lat()},${sw.lng()}|${ne.lat()},${ne.lng()}&zoom=${zm}`,
      null,
      features => {
        stationDataFeatures.forEach(dataFeature => {
          map.data.remove(dataFeature);
        });
        stationDataFeatures = features;
      }
    );
  });
}
次に、バックエンド コードを変更します。nycsubway.go ファイルは前のステップから変更されていませんが、ステーション クラスタリング コードに clusterer.go を追加する前に、stations.go に 2 つの変更を加える必要があります。
clusterStationsを呼び出して、R ツリーストアから取得したステーションをクラスタ化します。clusterStations関数は、フロントエンドから渡される新しいパラメータ ズームに依存し、特定のズームレベルに適したクラスタを作成します。- R ツリークエリのサイズを
newRectの末尾まで増やして、前のステップの最後で説明したマーカーの異常な動作を防ぎます。
stations.go
package nycsubway

import (
        "encoding/json"
        "fmt"
        "log"
        "math"
        "net/http"
        "strconv"
        "strings"

        rtree "github.com/dhconnelly/rtreego"
        geojson "github.com/paulmach/go.geojson"
)

// Stations is an RTree housing the stations
var Stations = rtree.NewTree(2, 25, 50)

// Station is a wrapper for `*geojson.Feature` so that we can implement
// `rtree.Spatial` interface type.
type Station struct {
        feature *geojson.Feature
}

// Bounds implements `rtree.Spatial` so we can load
// stations into an `rtree.Rtree`.
func (s *Station) Bounds() *rtree.Rect {
        return rtree.Point{
                s.feature.Geometry.Point[0],
                s.feature.Geometry.Point[1],
        }.ToRect(1e-6)
}

// loadStations loads the geojson features from
// `subway-stations.geojson` into the `Stations` rtree.
func loadStations() {
        stationsGeojson := GeoJSON["subway-stations.geojson"]
        fc, err := geojson.UnmarshalFeatureCollection(stationsGeojson)
        if err != nil {
                // Note: this will take down the GAE instance by exiting this process.
                log.Fatal(err)
        }
        for _, f := range fc.Features {
                Stations.Insert(&Station{f})
        }
}

// subwayStationsHandler reads r for a "viewport" query parameter
// and writes a GeoJSON response of the features contained in
// that viewport into w.
func subwayStationsHandler(w http.ResponseWriter, r *http.Request) {
        w.Header().Set("Content-type", "application/json")
        vp := r.FormValue("viewport")
        rect, err := newRect(vp)
        if err != nil {
                str := fmt.Sprintf("Couldn't parse viewport: %s", err)
                http.Error(w, str, 400)
                return
        }
        zm, err := strconv.ParseInt(r.FormValue("zoom"), 10, 0)
        if err != nil {
                str := fmt.Sprintf("Couldn't parse zoom: %s", err)
                http.Error(w, str, 400)
                return
        }
        s := Stations.SearchIntersect(rect)
        fc, err := clusterStations(s, int(zm))
        if err != nil {
                str := fmt.Sprintf("Couldn't cluster results: %s", err)
                http.Error(w, str, 500)
                return
        }
        err = json.NewEncoder(w).Encode(fc)
        if err != nil {
                str := fmt.Sprintf("Couldn't encode results: %s", err)
                http.Error(w, str, 500)
                return
        }
}

// newRect constructs a `*rtree.Rect` for a viewport.
func newRect(vp string) (*rtree.Rect, error) {
        ss := strings.Split(vp, "|")
        sw := strings.Split(ss[0], ",")
        swLat, err := strconv.ParseFloat(sw[0], 64)
        if err != nil {
                return nil, err
        }
        swLng, err := strconv.ParseFloat(sw[1], 64)
        if err != nil {
                return nil, err
        }
        ne := strings.Split(ss[1], ",")
        neLat, err := strconv.ParseFloat(ne[0], 64)
        if err != nil {
                return nil, err
        }
        neLng, err := strconv.ParseFloat(ne[1], 64)
        if err != nil {
                return nil, err
        }
        minLat := math.Min(swLat, neLat)
        minLng := math.Min(swLng, neLng)
        distLat := math.Max(swLat, neLat) - minLat
        distLng := math.Max(swLng, neLng) - minLng

        // Grow the rect to ameliorate issues with stations
        // disappearing on Zoom in, and being slow to appear
        // on Pan or Zoom out.
        r, err := rtree.NewRect(
                rtree.Point{
                        minLng - distLng/10,
                        minLat - distLat/10,
                },
                []float64{
                        distLng * 1.2,
                        distLat * 1.2,
                })
        if err != nil {
                return nil, err
        }
        return r, nil
}
新しい clusterer.go ファイルに到達する前に、Go パッケージをもう 1 つインストールする必要があります。Cloud Shell コマンドラインで [CTRL] + [c] を使用してサーバーを停止し、Cloud Shell コマンドラインに次のコマンドを入力します。
go get github.com/smira/go-point-clustering
次に、ステーションをクラスタリングするコードを追加します。その際、これまでに作成した他の 2 つの go ファイルとともに clusterer.go ファイルを作成します。このコードは、適切なクラスタサイズを把握するための数学的な計算を行うため、かなり複雑です。コードはコメントされていますが、ここの状況を正確に理解する必要はありません。偏球の表面を平面投影に投影する技術については、Wikipedia で詳しく説明されています。
clusterer.go
package nycsubway

import (
        "fmt"
        "math"

        rtree "github.com/dhconnelly/rtreego"
        geojson "github.com/paulmach/go.geojson"
        cluster "github.com/smira/go-point-clustering"
)

// The zoom level to stop clustering at
const minZoomLevelToShowUngroupedStations = 14

// Latitude of NYC, used to guestimate the size of a pixel at a specific
// zoom level.
const nycLatitude float64 = 40.7128

// Station marker image width.
const stationMarkerWidth float64 = 28

// EarthRadius is a rough estimate of earth's radius in km at latitude 0
// if earth was a perfect sphere.
const EarthRadius = 6378.137

// Point enables clustering over `Station`s.
func (s *Station) Point() cluster.Point {
        var p cluster.Point
        p[0] = s.feature.Geometry.Point[0]
        p[1] = s.feature.Geometry.Point[1]
        return p
}

func clusterStations(spatials []rtree.Spatial, zoom int) (*geojson.FeatureCollection, error) {
        var pl cluster.PointList

        for _, spatial := range spatials {
                station := spatial.(*Station)
                pl = append(pl, station.Point())
        }
        clusteringRadius, minClusterSize := getClusteringRadiusAndMinClusterSize(zoom)
        // The following operation groups stations determined to be nearby into elements of
        // "clusters". Some stations may end up not part of any cluster ("noise") - we
        // present these as individual stations on the map.
        clusters, noise := cluster.DBScan(pl, clusteringRadius, minClusterSize)
        fc := geojson.NewFeatureCollection()
        for _, id := range noise {
                f := spatials[id].(*Station).feature
                name, err := f.PropertyString("name")
                if err != nil {
                        return nil, err
                }
                notes, err := f.PropertyString("notes")
                if err != nil {
                        return nil, err
                }
                f.SetProperty("title", fmt.Sprintf("%v Station", name))
                f.SetProperty("description", notes)
                f.SetProperty("type", "station")
                fc.AddFeature(f)
        }
        for _, clstr := range clusters {
                ctr, _, _ := clstr.CentroidAndBounds(pl)
                f := geojson.NewPointFeature([]float64{ctr[0], ctr[1]})
                n := len(clstr.Points)
                f.SetProperty("title", fmt.Sprintf("Station Cluster #%v", clstr.C+1))
                f.SetProperty("description", fmt.Sprintf("Contains %v stations", n))
                f.SetProperty("type", "cluster")
                fc.AddFeature(f)
        }
        return fc, nil
}

func getClusteringRadiusAndMinClusterSize(zoom int) (float64, int) {
        // For highest zoom levels, consider stations 10 meters apart as
        // the same.  Allow for groups of size 2.
        if zoom >= minZoomLevelToShowUngroupedStations {
                return 0.01, 2
        }
        groundResolution := groundResolutionByLatAndZoom(nycLatitude, zoom)
        // Multiply ground resolution per pixel by the width (in pixels).. +
        // "manually adjust".
        clusteringRadius := groundResolution * stationMarkerWidth
        // Set min group size to 3
        return clusteringRadius, 3
}

// groundResolution indicates the distance in km on the ground that is
// represented by a single pixel in the map.
func groundResolutionByLatAndZoom(lat float64, zoom int) float64 {
        // number of pixels for the width of the (square) world map in web
        // mercator.  i.e. for zoom level 0, this would give 256 pixels.
        numPixels := math.Pow(2, float64(8+zoom))
        // We return earth's circumference (at given latitude) divided by
        // number of pixels for the map's width.  Note: EarthRadius is given in
        // km.
        return cos(lat) * 2 * math.Pi * EarthRadius / numPixels
}

// cos returns the cosine function (like math.cos) but accepts degrees as input.
func cos(degree float64) float64 {
        return math.Cos(degree * math.Pi / 180)
}
ファイルの先頭にある定数(通常の package 行と import スタンザの後)に注意してください。Clusterer はこれらの定数をさまざまな方法で使用します。
minZoomLevelToShowUngroupedStationsは、クラスタリングを効率的に停止するズームレベルを構成します。nycLatitudeとearthRadiusは、getClusteringRadiusAndMinClusterSizeとそのヘルパー関数groundResolutionByLatAndZoomで使用されます。マップピクセルで表されます。実際の世界サイズは km 単位で示されます。stationMarkerWidthは、クラスタリングする領域の規模を把握するために使用されます。
次に、関数を定義します。*Station で Point メソッドを定義すると、clusterStations でステーションを簡単にクラスタ化できます。このファイル clusterStations のメイン エントリ ポイントは、R ツリーにあるステーションをクラスタ化するために stations.go から呼び出されます。この関数のコードの大部分はテールエンドにあります。ここでは、生成された clusters と、クラスタ化されていない個々のステーション(noise ラベル)を反復処理しています。clusterer パッケージの呼び出し規則はあまり意味がなく、元のポイントリストに渡されるインデックスとして機能する整数のリストを返します。clusters と noise の 2 つのリストから、フロントエンドによってレンダリングされる geojson.PointFeature のリストを生成します。
getClusteringRadiusAndMinClusterSize、groundResolutionByLatAndZoom、cos の 3 つのヘルパー関数は、election-au-2016 プロジェクト(GitHub でホストされているオープンソース プロジェクト)からわずかに編集されたものです。このプロジェクトは、2016 年のオーストラリア連邦選挙で ausvotes.withgoogle.com を推進するために使用されたバックエンドを示しています。これらのヘルパー関数は、clusterStations の途中に呼び出されるクラスタリング アルゴリズムの構成に使用されます。
サーバーを再起動します。
go fmt *.go && goapp serve
地図をもう一度確認してみてください。ズームレベルに応じてステーションをクラスタリングすることで、ステーションを動的に除外できるようになりました。
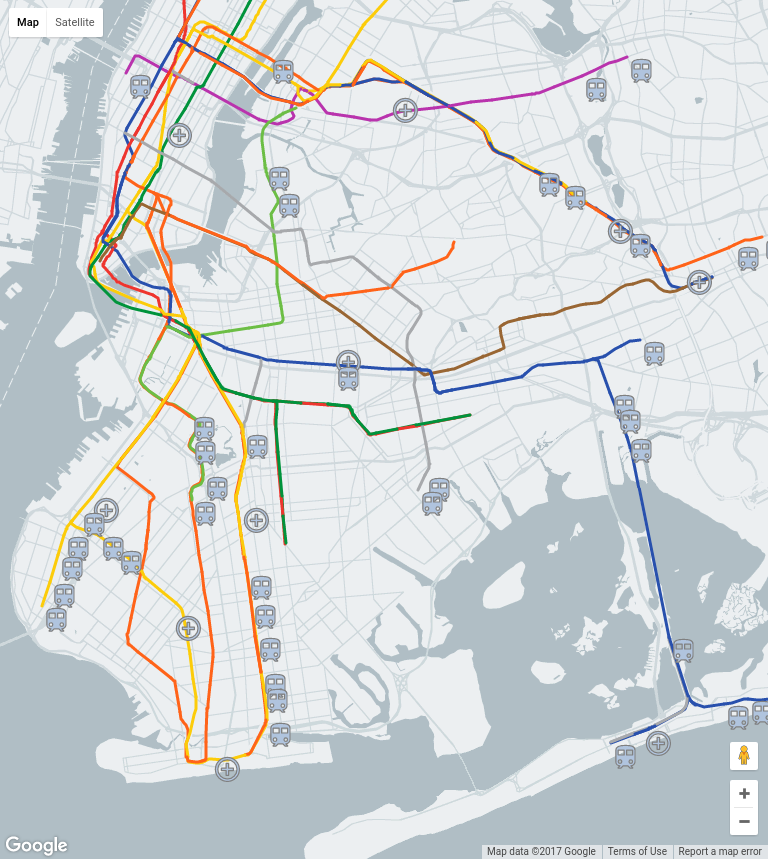
これで、ステーションが正常に動作し、正常に表示される地図が完成しました。友だちにも見てもらうのは素晴らしいことですか?次のステップでは、このアプリケーションを Google App Engine インフラストラクチャに公開します。これにより、誰でもアプリケーションを見ることができます。
自慢のウェブアプリができたので、次は世界に発信しましょう。同時受信リクエストの数に基づいて、バックエンドを自動的にスケーリングする必要があります。幸いなことに、Google App Engine ではこれを簡単に実行できます。必要な作業は、アプリをデプロイすることだけです。
nyc-subway ディレクトリで、次のコマンドを入力します。gcloud app deploy
App Engine アプリを作成するリージョンを尋ねられたら、「2'」と入力して us-central を選択します。
$ gcloud app deploy
You are creating an app for project [nyc-subway-station-locator].
WARNING: Creating an app for a project is irreversible.
Please choose a region for your application. After choosing a region,
you cannot change it. Which region would you like to choose?
 [1] europe-west   (supports standard)
 [2] us-central    (supports standard and flexible)
 [3] us-east1      (supports standard and flexible)
 [4] asia-northeast1 (supports standard and flexible)
 [5] cancel
Please enter your numeric choice:  2
Creating App Engine application in project [nyc-subway-station-locator] and region [us-central]....done.
You are about to deploy the following services:
 - nyc-subway-station-locator/default/20170202t141202 (from [/home/brettmorgan/nyc-subway/app.yaml])
     Deploying to URL: [https://nyc-subway-station-locator.appspot.com]
Do you want to continue (Y/n)?  y
Beginning deployment of service [default]...
File upload done.
Updating service [default]...done.
Deployed service [default] to [https://nyc-subway-station-locator.appspot.com]
You can read logs from the command line by running:
  $ gcloud app logs read -s default
To view your application in the web browser run:
  $ gcloud app browse
サービスがデプロイされた URL で新しいブラウザタブを開きます。上の例において、導入されている URL は https://nyc-subway-station-locator.appspot.com ですが、実際の URL は異なります。
このプロジェクトで作成されたすべてのリソースをクリーンアップする最も簡単な方法は、このチュートリアルの開始時に作成した Google Cloud プロジェクトをシャットダウンすることです。
- Google Cloud Platform Console で [設定] ページを開きます。
- [プロジェクトを選択] をクリックします。
- このチュートリアルの冒頭で作成したプロジェクトを選択します。
- [プロジェクトを削除] をクリックします。
- プロジェクトの ID を入力し、[シャットダウン] をクリックします。
この Codelab は楽しめたものの、より完全なサンプル サンプルについては、github.com/google/election-au-2016 にあるオーストラリア総選挙 2016 年のソースコード リポジトリをご覧ください。この Codelab は、election-au-2016 コードベースの簡略化されたバージョンとして設計、実装されています。ブラウン ランド全体における選挙ブースの設置場所を探すのに役立つ手法の紹介として最適です。
オーストラリアおよびニュージーランド キャンパス アウトリーチの一環でこの Codelab を完了した場合は、以下のボタンをクリックしてください。
これで、この Codelab は終了です。