
The mapTypes endpoint provides raster map tiles representing various weather
phenomena, such as precipitation forecasts. These map tiles can be overlaid onto
standard Google Maps.
Terms
These terms are issued under Section 6 (Pre-GA Offerings Terms) of the Google Maps Platform Service Specific Terms, as agreed to by Google and you.
1.1 Attribution Requirements. Customer must provide Google with attribution in accordance with the Documentation if Customer uses Google Maps Content from the Weather API.
1.2 Restrictions. Customers can not use Google Maps Content retrieved from Weather API to recreate a Google service or product (e.g. use data retrieved from Weather API in a weather app or weather model whose primary purpose is to provide weather information).
1.3 Caching. Customers can temporarily cache the applicable Google Maps Content from the Weather API for the applicable Caching Period, as described in Table 1.3.1 (Caching Permissions).
Table 1.3.1 (Caching Permissions)
These permissions are in addition to those described in Table 17.2.1 of the Google Maps Platform Service Specific Terms.
| Google Maps Content | Caching Period |
|---|---|
| Weather map tiles | One hour, after which Customer must delete the cached Google Maps Content |
About weather map requests
To request weather maps, send an HTTP GET request to:
https://weather.googleapis.com/v1/mapTypes/{map_type}/mapTiles/{zoom}/{x}/{y}Map types
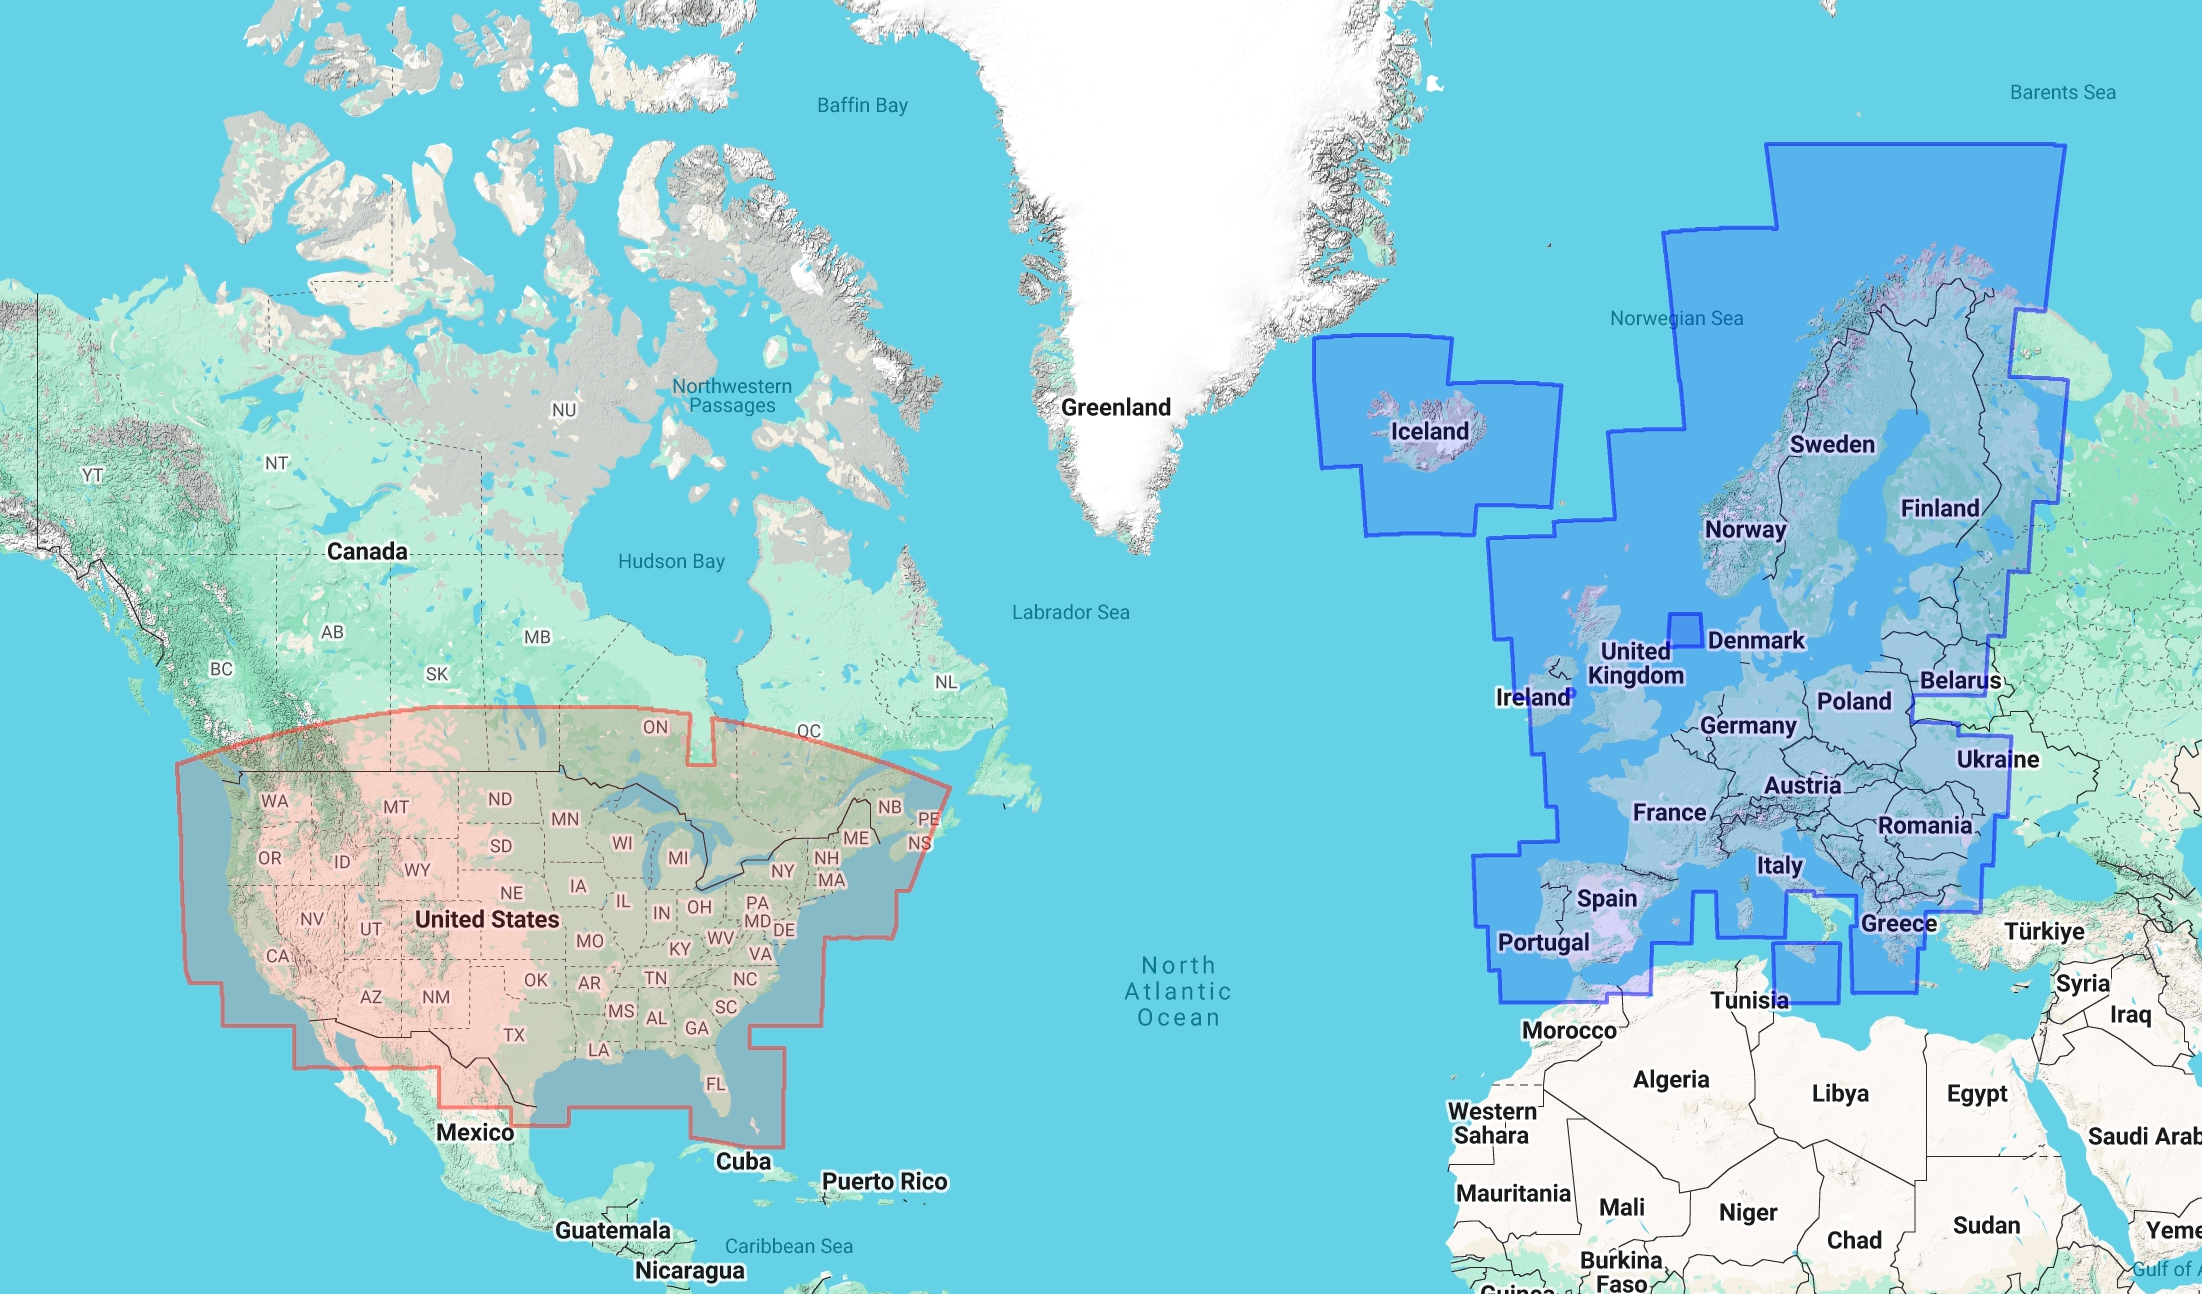
The Weather API supports different weather map types, which correspond to different underlying weather models and geographic areas:
US_PRECIPITATION_CURRENT: High-resolution United States precipitation nowcast.EU_PRECIPITATION_CURRENT: High-resolution European precipitation nowcast.
The coverage map below shows the regions where weather map tiles are available:
Tile coordinates system
The API uses the standard Web Mercator tile coordinate system. For a comprehensive explanation of map and tile coordinates, see Roadmap tiles and Map and Tile Coordinates.
In this system:
zoom: The zoom level (0 to 16). Zoom level 0 represents the entire world in a single tile (20 x 20 = 1 tile). Zoom level z divides the world into a grid of 2z x 2z tiles.x: The X coordinate (column) of the tile, ranging from 0 (westernmost) to 2zoom - 1 (easternmost).y: The Y coordinate (row) of the tile, ranging from 0 (northernmost) to 2zoom - 1 (southernmost).
Display weather map
To display these tiles in a web application using the Google Maps JavaScript
API, you can create a custom google.maps.ImageMapType:
const weatherMapType = new google.maps.ImageMapType({
  getTileUrl: function(coord, zoom) {
    const mapType = "US_PRECIPITATION_CURRENT";
    return `https://weather.googleapis.com/v1/mapTypes/${mapType}/mapTiles/${zoom}/${coord.x}/${coord.y}`;
  },
  tileSize: new google.maps.Size(256, 256),
  maxZoom: 16,
  minZoom: 0,
  name: "Weather"
});

// Overlay on existing map
map.overlayMapTypes.insertAt(0, weatherMapType);
Weather map request example
The following example requests US precipitation weather map tiles for New Orleans:
curl -o tile.png -X GET "https://weather.googleapis.com/v1/mapTypes/US_PRECIPITATION_CURRENT/mapTiles/12/1025/1688?key=API_KEY"
The response is binary. The JSON wrapper only appears under specific
serialization settings, such as ?alt=json.