
Google Earth provides several tools to help you analyze terrain within a defined area of interest. These tools allow you to generate layers visualizing contours, slope, aspect, and cut and fill of a selected terrain interval for site assessment and planning.
Types of analysis tools
The following analysis tools are available in Google Earth:
| Tool | Description | Input(s) |
|---|---|---|
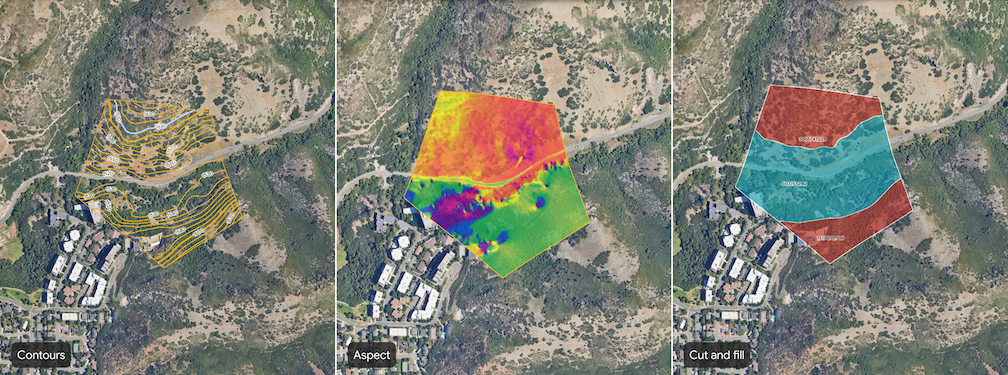
| The contours tool visualizes terrain with contour lines at designated elevation intervals. | Contour interval for the site. Select an integer value between 1 and 20 meters, inclusive. Smaller contour intervals will result in higher fidelity results (for example, 1 contour line for each meter change in elevation.) | |
| The slope tool generates a layer that visualizes the steepness of the terrain. The slope is calculated for each point on the surface, typically represented in degrees or percentage. This analysis is useful for understanding site accessibility, potential for erosion, and suitability for construction. | Resolution (in meters) | |
| The aspect tool generates a layer that visualizes the directional facing of slopes. Aspect identifies the downslope direction of the maximum rate of change in elevation in degrees. This is useful for understanding sun exposure, prevailing wind effects, and vegetation patterns. | Resolution (in meters) | |
| The cut and fill tool calculates the volume of material that needs to be excavated (cut) or added (fill) to reshape the terrain within the defined site to a target elevation of 0 (in other words, flattening the site). This is essential for site grading, road construction, and other earthworks projects. | None |
Generate site-level analysis
Open an existing project or create a new one in Google Earth.
In the toolbar, click the area_chart Analyze a site button.
Select a tool to open the tool dialog.
Draw a polygon to designate your site. Click the map to set points that outline your site.
- To remove a point, click Undo on the right.
To complete your site, select your first point to close the polygon.
Enter any inputs.
After entering or adjusting the input, click Create layer to start the generation process.
View analysis results
When analysis begins, your project's Map contents panel on the left starts listing the associated polygon and tracks the generation using a progress bar. The generation time depends on the site's size and hilliness.
When analysis is complete, a data layer titled Untitled < tool name > will be added to your project's Map contents panel. To view analysis results, do the following:
- Select the new data layer from the Map contents panel to open an inspector panel on the right. Learn how to manage and style site assessment data layers.
- Zoom and rotate the map around the analysis data layer to explore the visualization and make your assessments.
- Click a label on line or feature to view more details.
Important notes
- You can generate analysis for only one site at a time.
- For the best experience viewing analysis results, disable 3D Buildings under Basemap settings.
- All generated site assessment data layers adhere to specific data usage policies and restrictions. Exporting raw data from these layers is not supported. Collaborate with the site assessment data layers by sharing the project.