تنظيم صفحاتك في مجموعات
يمكنك حفظ المحتوى وتصنيفه حسب إعداداتك المفضّلة.
التخصيص المفرط يعني إنشاء نموذج
يتطابق (يحفظ) مع
مجموعة التدريب بشكلٍ
قريب جدًا لدرجة أنّ النموذج لا يستطيع تقديم تنبؤات صحيحة بشأن البيانات الجديدة.
يشبه النموذج المُعدَّل بشكل مفرط اختراعًا يحقّق أداءً جيدًا في المختبر ولكنه
لا يُجدي نفعًا في العالم الواقعي.
في الشكل 11، تخيل أنّ كل شكل هندسي يمثّل موضع شجرة
في غابة مربّعة. تشير الماسّات الزرقاء إلى مواقع الأشجار السليمة،
بينما تشير الدوائر البرتقالية إلى مواقع الأشجار المريضة.
الشكل 11. مجموعة التدريب: مواقع الأشجار السليمة والمريضة في غابة مربّعة
ارسم في ذهنك أي أشكال، مثل الخطوط والمنحنيات والأشكال البيضاوية...أي شيء، لفصل
الأشجار السليمة عن الأشجار المريضة. بعد ذلك، وسِّع السطر التالي لفحص
فاصلة محتملة.
وسِّع الصورة للاطّلاع على أحد الحلول المحتملة (الشكل 12).
الشكل 12. نموذج معقّد للتمييز بين الأشجار المريضة والصحية
نجحت الأشكال المعقّدة الموضّحة في الشكل 12 في تصنيف كل الأشجار باستثناء شجرتين. إذا اعتبرنا الأشكال نموذجًا، هذا نموذج
رائع.
لكن، من يدري؟ نموذج ممتاز حقًا يصنف بنجاح الأمثلة الجديدة.
يوضّح الرسم 13 ما يحدث عندما يقدّم النموذج نفسه توقّعات بشأن مثالين جديدين
من مجموعة الاختبار:
الشكل 13: مجموعة الاختبار: نموذج معقّد للتمييز بين الأشجار المريضة والصحية
وبالتالي، كان النموذج المعقّد المعروض في الشكل 12 فعّالاً بشكل كبير في مجموعة التدريب، ولكنه كان سيئًا جدًا في مجموعة الاختبار. هذه حالة نموذجية لحالة الملاءمة الزائدة لبيانات مجموعة التدريب.
التخصيص وفرط التخصيص وفرط التعميم
يجب أن يقدّم النموذج تنبؤات جيدة عن البيانات الجديدة.
وهذا يعني أنّك تستهدف إنشاء نموذج "يناسب" البيانات الجديدة.
كما رأيت، يقدّم النموذج الذي تمّ تدريبه بشكل مفرط توقّعات ممتازة في مجموعة data training، ولكنّه يقدّم توقّعات سيئة في البيانات الجديدة. إنّ النموذج الذي يتسم
بالتخصيص غير الكافي
لا يقدّم حتى توقّعات جيدة لبيانات التدريب. إذا كان النموذج الذي تمّ تدريبه بشكلٍ مفرط يشبه منتجًا يحقّق أداءً جيدًا في المختبر ولكنّه يحقّق أداءً ضعيفًا في العالم الحقيقي،
فإنّ النموذج الذي تمّ تدريبه بشكلٍ غير كافٍ يشبه منتجًا لا يحقّق أداءً جيدًا حتى في
المختبر.
الشكل 14. النماذج التي لا تتطابق مع البيانات، والنماذج التي تتطابق مع البيانات، والنماذج التي تتطابق بشكل مفرط مع البيانات
التعميم هو
عكس فرط التكيّف. وهذا يعني أنّ النموذج الذي يُجري تعميمات بشكل جيد يقدّم تنبؤات جيدة
بالبيانات الجديدة. هدفك هو إنشاء نموذج يُطبَّق بشكلٍ جيد على البيانات الجديدة.
رصد فرط التخصيص
تساعدك المنحنيات التالية في رصد حالات التكيّف المفرط:
منحنيات الخسارة
منحنيات التعميم
يوضِّح منحنى الخسارة خسارة النموذج مقارنةً بعدد تكرارات التدريب.
يُعرف الرسم البياني الذي يعرض منحنيات خسارة أو أكثر باسم منحنى
التعميم. يعرض منحنى التجميع التالي منحنى فقدانَين:
الشكل 15. منحنى التعميم الذي يشير بقوة إلى التكيّف المفرط
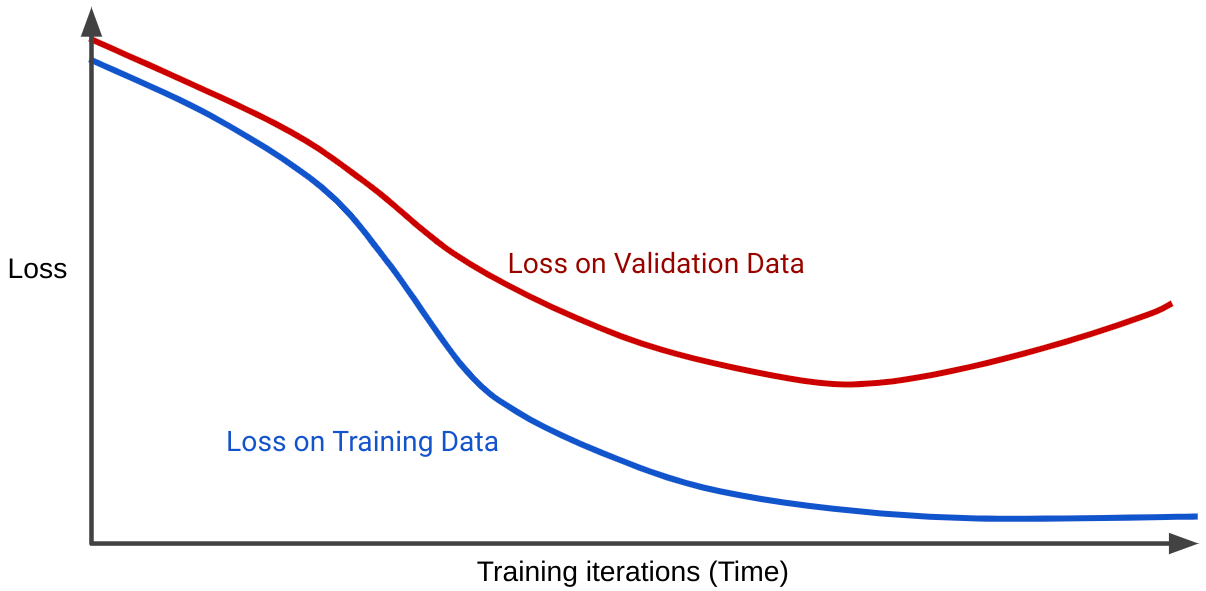
يُرجى ملاحظة أنّ منحنيات الخسارة تتصرف بشكلٍ مشابه في البداية ثمّ تتباعد.
وهذا يعني أنّه بعد عدد معيّن من التكرارات، ينخفض الخسارة أو
يبقى ثابتًا (يتقارب) لمجموعة التدريب، ولكن يزداد
للمجموعة التحقّق. يشير ذلك إلى فرط التكيّف.
في المقابل، يعرض منحنى التعميم لنموذج ملائم منحنيات خسارة
لها أشكال مشابهة.
ما هي أسباب فرط التوافق؟
بشكل عام، تحدث مشكلة التكيّف المفرط لأحد السببَين التاليَين أو كليهما:
لا تمثّل مجموعة التدريب البيانات الواقعية بشكلٍ كافٍ (أو
مجموعة التحقّق أو مجموعة الاختبار).
النموذج معقّد للغاية.
شروط التعميم
يتم تدريب النموذج على مجموعة تدريب، ولكن الاختبار الحقيقي لقيمة النموذج هو مدى
نجاحه في إجراء توقّعات بشأن أمثلة جديدة، لا سيما البيانات الواقعية.
أثناء تطوير نموذج، تُستخدَم مجموعة الاختبار كبديل لبيانات العالم الواقعي.
يشير تدريب نموذج يُعمِّم بشكلٍ جيد إلى شروط مجموعة البيانات التالية:
يجب أن تكون الأمثلة
موزَّعة بشكل مستقل ومتطابق،
وهي طريقة أنيقة للقول بأنّه
لا يمكن للأمثلة التأثير في بعضها.
تكون مجموعة البيانات
ثابتة، ما يعني أنّ
مجموعة البيانات لا تتغيّر بشكل ملحوظ بمرور الوقت.
تتضمّن أقسام مجموعة البيانات التوزيع نفسه.
وهذا يعني أنّ الأمثلة في مجموعة التدريب مشابهة إحصائيًا لتلك المتوفّرة في مجموعة التحقّق ومجموعة الاختبار والبيانات الواقعية.
استكشِف الشروط السابقة من خلال التمارين التالية.
تمارين: التحقّق من فهمك
راجِع أقسام مجموعة البيانات التالية.
ما الذي يجب فعله لضمان أنّ الأمثلة في مجموعة التدريب
لها توزيع إحصائي مشابه للأمثلة في
مجموعة التحقّق ومجموعة الاختبار؟
امزج الأمثلة في مجموعة البيانات بشكلٍ مكثّف قبل
تقسيمها.
نعم. إنّ ترتيب الأمثلة بشكل عشوائي يجعل التقسيمات أكثر احتمالًا
للتشابه إحصائيًا.
ترتيب الأمثلة من الأقدم إلى الأحدث
إذا لم تكن الأمثلة في مجموعة البيانات ثابتة، يؤدي الترتيب إلى جعل الأقسام أقل
تشابهًا.
عدم اتّخاذ أي إجراء: في حال توفّر أمثلة كافية، يضمن قانون المتوسطات
بشكل طبيعي أن تكون التوزيعات
متشابهة إحصائيًا.
للأسف، هذا ليس صحيحًا. قد تختلف الأمثلة
في أقسام معيّنة من مجموعة البيانات عن الأمثلة في الأقسام
الأخرى.
تعمل خدمة بث على تطوير نموذج للتنبؤ بمدى رواج
البرامج التلفزيونية الجديدة المحتملة خلال السنوات الثلاث المقبلة. تخطّط
خدمة البث لتدريب النموذج على مجموعة بيانات
تحتوي على مئات الملايين من الأمثلة التي تعود إلى
السنوات العشر السابقة. هل سيواجه هذا النموذج مشكلة؟
على الأرجح. تتغيّر أذواق المشاهدين بطرق لا يمكن توقّعها بالاستناد إلى السلوك السابق.
نعم. إنّ أذواق المشاهدين ليست ثابتة. وتتغيّر هذه الأحكام باستمرار.
بالتأكيد لا. أن تكون مجموعة البيانات كبيرة بما يكفي لإجراء توقّعات جيدة
إنّ أذواق المشاهدين غير ثابتة.
على الأرجح أنّ هذه المطالبات لن تسبّب لك أي مشكلة. تتغيّر أذواق المشاهدين بطرق دورية يمكن توقّعها.
ستتيح البيانات التي تعود إلى عشر سنوات للنموذج تقديم توقّعات جيدة
بشأن المؤشرات المستقبلية.
على الرغم من أنّ بعض جوانب الترفيه تكون دورية إلى حدّ ما، فمن المؤكد تقريبًا أنّه لن يتمكّن
النموذج الذي تم تدريبه من سجلّ الترفيه السابق من
إجراء توقّعات بشأن السنوات القليلة المقبلة.
يهدف أحد النماذج إلى توقّع الوقت الذي يستغرقه الأشخاص في المشي لمسافة ميل واحد
استنادًا إلى بيانات الطقس (درجة الحرارة ونقطة الندى
والأمطار) التي تم جمعها على مدار عام في مدينة يختلف فيها الطقس
بشكل كبير حسب الموسم. هل يمكنك إنشاء نموذج واختباره من مجموعة بيانات
هذه، على الرغم من أنّ قراءات الطقس تتغيّر بشكل كبير تبعًا
للموسم؟
نعم
نعم، من الممكن إنشاء نموذج واختباره من مجموعة البيانات هذه.
ما عليك سوى التأكّد من تقسيم البيانات بالتساوي، بحيث تتم مشاركة البيانات من جميع الفصول الأربعة بالتساوي في الأقسام المختلفة.
لا
بافتراض أنّ مجموعة البيانات هذه تحتوي على أمثلة كافية على درجة الحرارة ونقطة
الندى وهطول الأمطار، يمكنك إنشاء نموذج واختباره من
هذه المجموعة. ما عليك سوى التأكّد من تقسيم البيانات
بالتساوي، بحيث يتم توزيع البيانات من جميع الفصول الأربعة بالتساوي
على الأقسام المختلفة.
تمرين التحدّي
أنت بصدد إنشاء نموذج يتوقّع التاريخ المثالي للركاب لشراء تذكرة قطار لمسار معيّن. على سبيل المثال، قد يقترح النموذج
على المستخدمين شراء تذكرتهم في 8 تموز (يوليو) لركوب قطار يغادر في 23 تموز (يوليو).
تعدّل شركة القطارات الأسعار كل ساعة استنادًا إلى مجموعة متنوعة
من العوامل، ولكن بشكل أساسي استنادًا إلى العدد الحالي للمقاعد المتاحة. والمقصود:
إذا كانت هناك مقاعد كثيرة متاحة، تكون أسعار التذاكر عادةً منخفضة.
إذا كانت المقاعد المتوفّرة قليلة جدًا، تكون أسعار التذاكر عادةً مرتفعة.
يُظهر نموذجك خسائر منخفضة
في مجموعة التحقّق ومجموعة الاختبار، ولكنه يقدّم أحيانًا
توقّعات سيئة للبيانات في العالم الواقعي. لماذا؟
انقر هنا للاطّلاع على الإجابة.
الإجابة: يواجه نموذج العالم الواقعي مشكلة في
حلقة الملاحظات.
على سبيل المثال، لنفترض أنّ النموذج يقترح على المستخدمين شراء التذاكر في 8 تموز (يوليو).
يشتري بعض الركاب الذين يستعينون باقتراحات النموذج تذاكرهم في الساعة 8:30 صباحًا في 8 تموز (يوليو). في الساعة 9:00، ترفع شركة القطارات الأسعار لأنّه
لم يعُد هناك مقاعد متاحة. يحصل الركاب الذين يستخدِمون اقتراح النموذج على
أسعار متغيّرة. وفي المساء، قد تكون أسعار التذاكر أعلى بكثير مما هي عليه في
الصباح.
تاريخ التعديل الأخير: 2024-11-14 (حسب التوقيت العالمي المتفَّق عليه)
[[["يسهُل فهم المحتوى.","easyToUnderstand","thumb-up"],["ساعَدني المحتوى في حلّ مشكلتي.","solvedMyProblem","thumb-up"],["غير ذلك","otherUp","thumb-up"]],[["لا يحتوي على المعلومات التي أحتاج إليها.","missingTheInformationINeed","thumb-down"],["الخطوات معقدة للغاية / كثيرة جدًا.","tooComplicatedTooManySteps","thumb-down"],["المحتوى قديم.","outOfDate","thumb-down"],["ثمة مشكلة في الترجمة.","translationIssue","thumb-down"],["مشكلة في العيّنات / التعليمات البرمجية","samplesCodeIssue","thumb-down"],["غير ذلك","otherDown","thumb-down"]],["تاريخ التعديل الأخير: 2024-11-14 (حسب التوقيت العالمي المتفَّق عليه)"],[[["\u003cp\u003eOverfitting occurs when a model performs well on training data but poorly on new, unseen data.\u003c/p\u003e\n"],["\u003cp\u003eA model is considered to generalize well if it accurately predicts on new data, indicating it hasn't overfit.\u003c/p\u003e\n"],["\u003cp\u003eOverfitting can be detected by observing diverging loss curves for training and validation sets on a generalization curve.\u003c/p\u003e\n"],["\u003cp\u003eCommon causes of overfitting include unrepresentative training data and overly complex models.\u003c/p\u003e\n"],["\u003cp\u003eDataset conditions for good generalization include examples being independent, identically distributed, and stationary, with similar distributions across partitions.\u003c/p\u003e\n"]]],[],null,["# Overfitting\n\n[**Overfitting**](/machine-learning/glossary#overfitting) means creating a model\nthat matches (*memorizes* ) the\n[**training set**](/machine-learning/glossary#training-set) so\nclosely that the model fails to make correct predictions on new data.\nAn overfit model is analogous to an invention that performs well in the lab but\nis worthless in the real world.\n| **Tip:** Overfitting is a common problem in machine learning, not an academic hypothetical.\n\nIn Figure 11, imagine that each geometric shape represents a tree's position\nin a square forest. The blue diamonds mark the locations of healthy trees,\nwhile the orange circles mark the locations of sick trees.\n**Figure 11.** Training set: locations of healthy and sick trees in a square forest.\n\nMentally draw any shapes---lines, curves, ovals...anything---to separate the\nhealthy trees from the sick trees. Then, expand the next line to examine\none possible separation.\n\n#### Expand to see one possible solution (Figure 12).\n\n**Figure 12.** A complex model for distinguishing sick from healthy trees.\n\nThe complex shapes shown in Figure 12 successfully categorized all but two of\nthe trees. If we think of the shapes as a model, then this is a fantastic\nmodel.\n\nOr is it? A truly excellent model successfully categorizes *new* examples.\nFigure 13 shows what happens when that same model makes predictions on new\nexamples from the test set:\n**Figure 13.**Test set: a complex model for distinguishing sick from healthy trees.\n\nSo, the complex model shown in Figure 12 did a great job on the training set\nbut a pretty bad job on the test set. This is a classic case of a model\n*overfitting* to the training set data.\n\nFitting, overfitting, and underfitting\n--------------------------------------\n\nA model must make good predictions on *new* data.\nThat is, you're aiming to create a model that \"fits\" new data.\n\nAs you've seen, an overfit model makes excellent predictions on the training\nset but poor predictions on new data. An\n[**underfit**](/machine-learning/glossary#underfitting) model\ndoesn't even make good predictions on the training data. If an overfit model is\nlike a product that performs well in the lab but poorly in the real world,\nthen an underfit model is like a product that doesn't even do well in\nthe lab.\n**Figure 14.** Underfit, fit, and overfit models.\n\n[**Generalization**](/machine-learning/glossary#generalization) is the\nopposite of overfitting. That is, a model that *generalizes well* makes good\npredictions on new data. Your goal is to create a model that generalizes\nwell to new data.\n\nDetecting overfitting\n---------------------\n\nThe following curves help you detect overfitting:\n\n- loss curves\n- generalization curves\n\nA [**loss curve**](/machine-learning/glossary#loss-curve) plots a model's loss\nagainst the number of training iterations.\nA graph that shows two or more loss curves is called a [**generalization\ncurve**](/machine-learning/glossary#generalization-curve). The following\ngeneralization curve shows two loss curves:\n**Figure 15.** A generalization curve that strongly implies overfitting.\n\nNotice that the two loss curves behave similarly at first and then diverge.\nThat is, after a certain number of iterations, loss declines or\nholds steady (converges) for the training set, but increases\nfor the validation set. This suggests overfitting.\n\nIn contrast, a generalization curve for a well-fit model shows two loss curves\nthat have similar shapes.\n\nWhat causes overfitting?\n------------------------\n\nVery broadly speaking, overfitting is caused by one or both of the following\nproblems:\n\n- The training set doesn't adequately represent real life data (or the validation set or test set).\n- The model is too complex.\n\nGeneralization conditions\n-------------------------\n\nA model trains on a training set, but the real test of a model's worth is how\nwell it makes predictions on new examples, particularly on real-world data.\nWhile developing a model, your test set serves as a proxy for real-world data.\nTraining a model that generalizes well implies the following dataset conditions:\n\n- Examples must be [**independently and identically distributed**](/machine-learning/glossary#independently-and-identically-distributed-i.i.d), which is a fancy way of saying that your examples can't influence each other.\n- The dataset is [**stationary**](/machine-learning/glossary#stationarity), meaning the dataset doesn't change significantly over time.\n- The dataset partitions have the same distribution. That is, the examples in the training set are statistically similar to the examples in the validation set, test set, and real-world data.\n\nExplore the preceding conditions through the following exercises.\n\nExercises: Check your understanding\n-----------------------------------\n\nConsider the following dataset partitions. What should you do to ensure that the examples in the training set have a similar statistical distribution to the examples in the validation set and the test set? \nShuffle the examples in the dataset extensively before partitioning them. \nYes. Good shuffling of examples makes partitions much more likely to be statistically similar. \nSort the examples from earliest to most recent. \nIf the examples in the dataset are not stationary, then sorting makes the partitions *less* similar. \nDo nothing. Given enough examples, the law of averages naturally ensures that the distributions will be statistically similar. \nUnfortunately, this is not the case. The examples in certain sections of the dataset may differ from those in other sections. \nA streaming service is developing a model to predict the popularity of potential new television shows for the next three years. The streaming service plans to train the model on a dataset containing hundreds of millions of examples, spanning the previous ten years. Will this model encounter a problem? \nProbably. Viewers' tastes change in ways that past behavior can't predict. \nYes. Viewer tastes are not stationary. They constantly change. \nDefinitely not. The dataset is large enough to make good predictions. \nUnfortunately, viewers' tastes are nonstationary. \nProbably not. Viewers' tastes change in predictably cyclical ways. Ten years of data will enable the model to make good predictions on future trends. \nAlthough certain aspects of entertainment are somewhat cyclical, a model trained from past entertainment history will almost certainly have trouble making predictions about the next few years. \nA model aims to predict the time it takes for people to walk a mile based on weather data (temperature, dew point, and precipitation) collected over one year in a city whose weather varies significantly by season. Can you build and test a model from this dataset, even though the weather readings change dramatically by season? \nYes \nYes, it is possible to build and test a model from this dataset. You just have to ensure that the data is partitioned equally, so that data from all four seasons is distributed equally into the different partitions. \nNo \nAssuming this dataset contains enough examples of temperature, dew point, and precipitation, then you can build and test a model from this dataset. You just have to ensure that the data is partitioned equally, so that data from all four seasons is distributed equally into the different partitions.\n\n### Challenge exercise\n\nYou are creating a model that predicts the ideal date for riders to buy a\ntrain ticket for a particular route. For example, the model might recommend\nthat users buy their ticket on July 8 for a train that departs July 23.\nThe train company updates prices hourly, basing their updates on a variety\nof factors but mainly on the current number of available seats. That is:\n\n- If a lot of seats are available, ticket prices are typically low.\n- If very few seats are available, ticket prices are typically high.\n\nYour model exhibits low loss on the validation set and the test set but sometimes makes terrible predictions on real-world data. Why? \nClick here to see the answer \n**Answer:** The real world model is struggling with a\n**[feedback loop](/machine-learning/glossary#feedback-loop)**.\n\nFor example, suppose the model recommends that users buy tickets on July 8.\nSome riders who use the model's recommendation buy their tickets at 8:30\nin the morning on July 8. At 9:00, the train company raises prices because\nfewer seats are now available. Riders using the model's recommendation have\naltered prices. By evening, ticket prices might be much higher than in the\nmorning.\n| **Key terms:**\n|\n| - [Feedback loop](/machine-learning/glossary#feedback-loop)\n| - [Generalization](/machine-learning/glossary#generalization)\n| - [Generalization curve](/machine-learning/glossary#generalization-curve)\n| - [Independently and identically distributed (i.i.d)](/machine-learning/glossary#independently-and-identically-distributed-i.i.d)\n| - [Loss curve](/machine-learning/glossary#loss-curve)\n| - [Overfitting](/machine-learning/glossary#overfitting)\n| - [Stationarity](/machine-learning/glossary#stationarity)\n| - [Training set](/machine-learning/glossary#training-set)\n- [Underfitting](/machine-learning/glossary#underfitting) \n[Help Center](https://support.google.com/machinelearningeducation)"]]