-
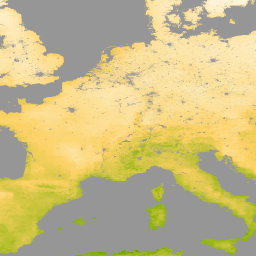
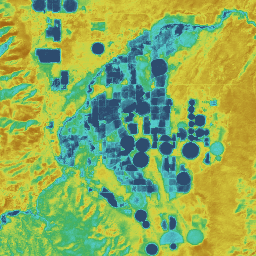
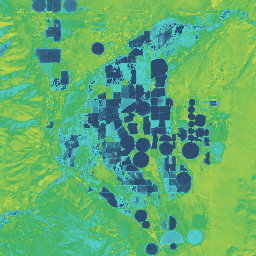
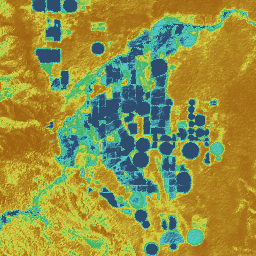
澳大利亚实际蒸散量 (CMRSET Landsat V2.2)

此数据集使用 CMRSET 算法提供澳大利亚的准确实际蒸散量(AET 或 ETa)。AET 波段(名为“ETa”)包含该月所有无云 Landsat 观测的 CMRSET 模型的平均每日值(在 AET 数据中以值 3 表示)… agriculture australia csiro evaporation evapotranspiration landsat-derived -
Breathing Earth System Simulator (BESS) Radiation v1

Breathing Earth System Simulator (BESS) 是一种简化的基于过程的模型,它将大气和冠层辐射传输、冠层光合作用、蒸腾作用和能量平衡相结合。它将大气辐射传输模型和人工神经网络与 MODIS 大气产品的驱动力相结合,以生成 5 公里的每日产品。… climate evapotranspiration gpp modis-derived par radiation -
FLDAS:Famine Early Warning Systems Network (FEWS NET) Land Data Assimilation System

FLDAS 数据集(McNally 等人,2017 年)旨在帮助在数据稀疏的发展中国家/地区进行粮食安全评估。它包含许多与气候相关的变量的信息,包括湿度、蒸散量、平均土壤温度、总降水率等。有多个不同的 FLDAS 数据集;… climate cryosphere evapotranspiration humidity ldas monthly -
GRIDMET DROUGHT:美国本土干旱指数

此数据集包含从 4 公里每日网格化地面气象 (GRIDMET) 数据集得出的干旱指数。提供的干旱指数包括标准化降水指数 (SPI)、蒸发干旱需求指数 (EDDI)、标准化降水蒸散指数 (SPEI)、帕默干旱严重程度指数 (PDSI) 和帕默… climate conus crop drought evapotranspiration geophysical -
MOD16A2.061:Terra 净蒸散量 8 天全球 500 米

MOD16A2 版本 6.1 蒸散量/潜热通量产品是一种以 500 米像素分辨率生成的 8 天合成产品。用于 MOD16 数据产品收集的算法基于 Penman-Monteith 方程的逻辑,其中包括每日气象再分析数据的输入… 8-day evapotranspiration global mod16a2 modis nasa -
MOD16A2:MODIS 全球陆地蒸散量 8 天全球 1 公里

MOD16A2 V105 产品提供有关 8 天全球陆地蒸散量的信息,像素分辨率为 1 公里。蒸散量 (ET) 是从地球表面到大气层的蒸发量和植物蒸腾量的总和。借助长期 ET 数据,可以了解气候、土地利用和… 8-day evapotranspiration global mod16a2 modis water-vapor -
MOD16A2GF.061:Terra 净蒸散量填补缺口 8 天全球 500 米

Terra 中分辨率成像光谱仪 (MODIS) MOD16A2GF 版本 6.1 蒸散量/潜热通量 (ET/LE) 产品是一种年末填补缺口的 8 天合成数据集,以 500 米 (m) 像素分辨率生成。用于 MOD16 数据产品收集的算法基于… 8-day evapotranspiration global modis nasa water-vapor -
MYD16A2.061:Aqua 净蒸散量 8 天 L4 全球 500 米 SIN 网格 V061
MYD16A2 版本 6.1 蒸散量/潜热通量产品是一种以 500 米像素分辨率生成的 8 天合成产品。用于 MOD16 数据产品收集的算法基于 Penman-Monteith 方程的逻辑,其中包括每日气象再分析数据的输入… 8-day evapotranspiration global modis nasa water-vapor -
OpenET DisALEXI 月度蒸散量 v2.0
大气-陆地交换逆向 / 大气-陆地交换逆向 (ALEXI/DisALEXI) 的分解。DisALEXI 作为 OpenET 框架的一部分移植到 Google Earth Engine。Anderson 等人(2012 年、2018 年)介绍了基准 ALEXI/DisALEXI 模型结构。ALEXI 蒸散量 (ET) 模型专门使用时间… evapotranspiration landsat-derived monthly openet publisher-dataset water -
OpenET DisALEXI 月度蒸散量 v2.1
大气-陆地交换逆向 / 大气-陆地交换逆向 (ALEXI/DisALEXI) 的分解。DisALEXI 作为 OpenET 框架的一部分移植到 Google Earth Engine。Anderson 等人(2012 年、2018 年)介绍了基准 ALEXI/DisALEXI 模型结构。ALEXI 蒸散量 (ET) 模型专门使用时间… evapotranspiration landsat-derived monthly openet publisher-dataset water -
OpenET Ensemble 月度蒸散量 v2.0
OpenET 数据集包含基于卫星的数据,这些数据涉及通过蒸散量 (ET) 过程从陆地表面转移到大气中的总水量。OpenET 提供来自多个卫星驱动模型的 ET 数据,还根据…计算单个“集成值” evapotranspiration gridmet-derived landsat-derived monthly openet publisher-dataset -
OpenET Ensemble 月度蒸散量 v2.1
OpenET 数据集包含基于卫星的数据,这些数据涉及通过蒸散量 (ET) 过程从陆地表面转移到大气中的总水量。OpenET 提供来自多个卫星驱动模型的 ET 数据,还根据…计算单个“集成值” evapotranspiration gridmet-derived landsat-derived monthly openet publisher-dataset -
OpenET PT-JPL 月度蒸散量 v2.0
Priestley-Taylor Jet Propulsion Laboratory (PT-JPL)。OpenET 框架内 PT-JPL 模型的核心公式与 Fisher 等人(2008 年)详述的原始公式相比没有变化。不过,PT-JPL 的模型输入和时间集成得到了增强和更新,以… evapotranspiration gridmet-derived landsat-derived monthly openet publisher-dataset -
OpenET PT-JPL 月度蒸散量 v2.1
Priestley-Taylor Jet Propulsion Laboratory (PT-JPL)。OpenET 框架内 PT-JPL 模型的核心公式与 Fisher 等人(2008 年)详述的原始公式相比没有变化。不过,PT-JPL 的模型输入和时间集成得到了增强和更新,以… evapotranspiration gridmet-derived landsat-derived monthly openet publisher-dataset -
OpenET SIMS 月度蒸散量 v2.0
Satellite Irrigation Management Support (SIMS)。NASA Satellite Irrigation Management Support (SIMS) 模型最初旨在支持灌溉土地的作物系数和蒸散量 (ET) 的卫星制图,并增加对此数据的访问权限,以支持在灌溉调度和区域评估中使用… evapotranspiration gridmet-derived landsat-derived monthly openet publisher-dataset -
OpenET SIMS 月度蒸散量 v2.1
Satellite Irrigation Management Support (SIMS)。NASA Satellite Irrigation Management Support (SIMS) 模型最初旨在支持灌溉土地的作物系数和蒸散量 (ET) 的卫星制图,并增加对此数据的访问权限,以支持在灌溉调度和区域评估中使用… evapotranspiration gridmet-derived landsat-derived monthly openet publisher-dataset -
OpenET SSEBop 月度蒸散量 v2.0
Operational Simplified Surface Energy Balance (SSEBop)。Senay 等人(2013 年、2017 年)的 Operational Simplified Surface Energy Balance (SSEBop) 模型是一种基于热的简化表面能量模型,用于根据卫星湿度测量原理 (Senay 2018) 估算实际 ET。OpenET SSEBop 实现使用… evapotranspiration gridmet-derived landsat-derived monthly openet publisher-dataset -
OpenET SSEBop 月度蒸散量 v2.1
Operational Simplified Surface Energy Balance (SSEBop)。Operational Simplified Surface Energy Balance (SSEBop) 模型(Senay 等人,2013 年;2023 年)是一种基于热的方法,用于使用卫星湿度测量原理 (Senay, 2018) 估算实际蒸散量 (ET)。作为…的核心模型之一 evapotranspiration gridmet-derived landsat-derived monthly openet publisher-dataset -
OpenET eeMETRIC 月度蒸散量 v2.0
Google Earth Engine 实现了 Mapping Evapotranspiration at high Resolution with Internalized Calibration 模型 (eeMETRIC)。eeMETRIC 应用了 Allen 等人(2007 年;2015 年)和 Allen 等人(2013b 年)的高级 METRIC 算法和流程,其中近地表气温… evapotranspiration gridmet-derived landsat-derived monthly openet publisher-dataset -
OpenET eeMETRIC 月度蒸散量 v2.1
Google Earth Engine 实现了 Mapping Evapotranspiration at high Resolution with Internalized Calibration 模型 (eeMETRIC)。eeMETRIC 应用了 Allen 等人(2007 年;2015 年)和 Allen 等人(2013b 年)的高级 METRIC 算法和流程,其中近地表气温… evapotranspiration gridmet-derived landsat-derived monthly openet publisher-dataset -
OpenET geeSEBAL 月度蒸散量 v2.0
Google Earth Engine 实现了 Surface Energy Balance Algorithm for Land (SEBAL) 模型。如需了解当前 geeSEBAL 版本的概况,请参阅 Laipelt 等人(2021 年),该版本基于 Bastiaanssen 等人(1998 年)开发的原始算法。OpenET geeSEBAL… evapotranspiration gridmet-derived landsat-derived monthly openet publisher-dataset -
OpenET geeSEBAL 月度蒸散量 v2.1
Google Earth Engine 实现了 Surface Energy Balance Algorithm for Land (SEBAL) 模型。如需了解当前 geeSEBAL 版本的概况,请参阅 Laipelt 等人(2021 年),该版本基于 Bastiaanssen 等人(1998 年)开发的原始算法。OpenET geeSEBAL… evapotranspiration gridmet-derived landsat-derived monthly openet publisher-dataset -
PML_V2.2a:耦合蒸散量和总初级生产力 (GPP)
该数据集由 Large Scale Hydrology Lab 生成,该实验室专门通过将多源地球观测与基于过程的建模相结合,推进全球和区域水循环研究。PML-V2.2a 产品提供 500 米 8 天分辨率的全球陆地蒸散量 (ET) 和总初级生产力 (GPP),数据来自… evapotranspiration gpp plant-productivity publisher-dataset water-vapor -
SPEIbase:标准化降水蒸散指数数据库,版本 2.10

全球 SPEI 数据库 (SPEIbase) 提供有关全球干旱状况的长期可靠信息,像素大小为 0.5 度,每月更新一次。它提供 1 到 48 个月的 SPEI 时间尺度。标准化降水蒸散指数 (SPEI) 以标准化变量的形式表示… climate climate-change drought evapotranspiration global monthly -
TerraClimate:全球陆地表面的月度气候和气候水平衡,爱达荷大学

TerraClimate 是一个数据集,其中包含全球陆地表面的月度气候和气候水平衡。它使用气候辅助插值,将 WorldClim 数据集的高空间分辨率气候正常值与 CRU Ts4.0 和 Japanese 55-year Reanalysis (JRA55) 的较低空间分辨率但随时间变化的数据相结合。… climate drought evapotranspiration geophysical global merced