Page Summary
-
This public preview dataset provides high precision data for methane emissions from dispersed area sources in specific US, Turkmenistan, and Venezuela basins.
-
The dataset uses an inverse model based on MethaneSAT observations and an atmospheric transport model to estimate dispersed area emissions.
-
Access to this data requires filling out a request form and is subject to MethaneSAT's Content License Terms of Use, with restrictions on distribution of raw data.
-
An important update notes the loss of contact with the satellite, but existing and additional previously collected data will remain accessible.
-
The dataset includes bands for mean, lower bound, and upper bound methane emissions flux in kg/h, and image properties like total area emissions and collection ID.
- Catalog Owner
- Environmental Defense Fund - MethaneSAT
- Dataset Availability
- 2024-05-01T00:00:00Z–2025-06-14T11:12:26.422000Z
- Dataset Producer
- Environmental Defense Fund - MethaneSAT
- Contact
- EDF-MethaneSAT
- Cadence
- 14 Days
- Tags
Description
The dispersed area emissions model is still in development and not representative of a final product.
This early "Public Preview" dataset provides high precision data for methane emissions from dispersed area sources. These novel measurements demonstrate the importance of quantifying total methane emissions with high resolution to meet global methane mitigation goals.
Total emissions for a scene may be obtained by summing the area emissions for a given collection ID.
Dispersed area emissions are estimated from methane concentration observations in the form of column-averaged dry-air mole fractions of methane (XCH4) using an inverse model. An atmospheric transport model - the Stochastic Time-Inverted Lagrangian Transport (STILT) model; Lin et al. (2003), Fasoli et al. (2018); driven by meteorological data from the National Centers for Environmental Prediction (NCEP) Global Forecast System (GFS) - is used to link variations in observed XCH4 to potential upwind sources.
These predictive linkages are used to invert an estimated set of emissions from the observations of MethaneSAT using a novel Markov Chain Monte Carlo technique nicknamed CORE (Conserved and Optimized Retrieval of Emissions). Inflow across the domain boundary and pre-existing background concentrations are estimated, but not reported.
This set of initial observations made by MethaneSAT are consistent with independent empirical data where available from other sources. Not all data products (L3 concentration, L4 area and L4 points) are available for all collection IDs. Individual heat maps can have spatial misallocations due to several factors, including wind field uncertainty, observational uncertainty and variable emission rates. Users are advised to interpret individual emission grids with caution. For more about definitions and limitations, see our technical explanation. Contact the data provider for more information about the project at this link: https://www.methanesat.org/contact/.
7/2/2025 Important Update:
As you may be aware, we recently lost contact with the satellite. After exploring all possible recovery options, we have now confirmed that it is no longer functioning, due to an undetermined problem with the outer platform carrying our methane detector. While there is no question this is a setback, we are undeterred in our efforts to drive down methane pollution. Please see our official statement here: MethaneSAT Loses Contact with Satellite | MethaneSAT.
What this means for the Public Preview data: The existing datasets will remain accessible on Google platforms and on our web portal for the foreseeable future. Additionally, over the next few months, we will release substantial new data collected by MethaneSAT prior to the loss of contact. This will include hundreds of scenes (of targets that are roughly 200kmx200km). We hope this will be useful for you. Should there be any changes to data availability, we will notify you well in advance.
Looking ahead: While we don’t have all the answers yet, we plan to leverage our advanced Data Processing Platform (DPP) to quantify other streams of satellite and/or aerial data. We will also take the necessary time to evaluate the best next step in our efforts to enable methane reductions. To stay up to date with further updates, feel free to sign up for our newsletter.
Bands
Bands
Pixel size: 4000 meters (all bands)
| Name | Units | Min | Max | Pixel Size | Description |
|---|---|---|---|---|---|
mean_flux |
kg/h | 0* | 15000* | 4000 meters | Methane emissions traceable to a 4km^2 area. |
lower_bound_flux |
kg/h | 0* | 15000* | 4000 meters | Lower bound on the 95% confidence interval of flux. |
upper_bound_flux |
kg/h | 0* | 15000* | 4000 meters | Upper bound on the 95% confidence interval of flux. |
l4_retained_emitter |
count | 4000 meters |
Only present on two step CORE products. |
Image Properties
Image Properties
| Name | Type | Description |
|---|---|---|
| mean_total_kg_hr | DOUBLE | Total value of area emissions for this collection in kg/hr. Missing values are indicated by -1. |
| total_flux_lower_bound_kg_hr | DOUBLE | Lower bound on the 95% confidence interval of the total value of area emissions for this collection in kg/hr. |
| total_flux_upper_bound_kg_hr | DOUBLE | Upper bound on the 95% confidence interval of the total value of area emissions for this collection in kg/hr. |
| target_mean_total_kg_hr | DOUBLE | Total value of area emissions in the target for this collection in kg/hr. Missing values are indicated by -1. |
| target_total_flux_lower_bound_kg_hr | DOUBLE | Lower bound on the 95% confidence interval of the total value of area emissions in the target for this collection in kg/hr. |
| target_total_flux_upper_bound_kg_hr | DOUBLE | Upper bound on the 95% confidence interval of the total value of area emissions in the target for this collection in kg/hr. |
| flux_noise_floor_kg_hr | DOUBLE | Below this value, we believe fluxes are indistinguishable from 0. |
| collection_id | STRING | satellite observation number. |
| ovr_resampling | STRING | Resampling method used. |
| processing_id | STRING | (internal) Processing run identifier that represents the calculations that led to the features. It is not an attribute describing the flight, but the processing pipeline. |
| target_id | INT | Satellite Target ID. |
| time_coverage_end | STRING | Data collection end time in YYYY-MM-DDThh:mm:ssZ format STRING (ISO 8601). |
| time_coverage_start | STRING | Data collection start time in YYYY-MM-DDThh:mm:ssZ format STRING (ISO 8601). |
| two_step_core | STRING | Only present on two step CORE products. |
Terms of Use
Terms of Use
Use of this data is subject to MethaneSAT's Content License Terms of Use.
YOUR LICENSE TO ACCESS THE DATA
- We hereby grant you a limited, nonexclusive, nonassignable, nontransferable, revocable license to use, reproduce, publish, make derivative works, display and perform publicly any Data first made available through the Platform pursuant to the terms set forth herein, subject to your agreement to, compliance with and satisfaction of these Terms of Use (the “License”)
You agree to and acknowledge the following restrictions relating to the License:
- (1) To access the Data, you must complete this Request Form, which will ask for your contact information, intended use cases, target customers, and other details that will assist MethaneSAT’s understanding of how the Data is being used by you, and, upon submission of such form, MethaneSAT may (in its sole discretion) grant you access to the Data;
(2) With respect to certain aspects of the Data as described herein, you may use methane concentrations, in parts per billion or any other unit of concentration (“Level 3 Data” or “L3 Data”) and methane emission fluxes, in kilograms per hour (“Level 4 Data” or “L4 Data”) for:
- (i) internal business evaluation and testing,
- (ii) commercial applications, such as developing and selling derivative products and services that incorporate or are informed by the L3 Data or L4 Data,
- (iii) distribution of the Data made available herein to wholly controlled affiliates of which you will be responsible and liable on their behalf for adherence to these Terms of Use, or
- (iv) methane mitigation activities, including both commercial and non-commercial initiatives;
(3) You are strictly prohibited from using L3 Data to calculate or derive L4 Data or any similar outputs, except and exclusively for internal use purposes and not to distribute to any third party;
(4) You may not distribute, publish, sublicense, sell, or otherwise provide L3 Data or L4 Data in its raw form to any third parties, provided, however, that you may develop, commercialize, and sell derivative products and services based on your review of the L3 Data and L4 Data, provided, further (and for the avoidance of doubt), that the underlying L3 Data and L4 Data (in its raw form) shall not be shared nor made directly accessible to end users/third parties; and
(5) That you are not permitted to distribute the Data on any other platform that would make the Data available to third parties, other than to you and your wholly controlled affiliates.
As a condition of accessing the Data, you further agree and acknowledge that:
(1) MethaneSAT seeks information about how the Data will be used and, as such, you shall use best efforts, upon request by MethaneSAT, that you will
- (i) provide feedback on the quality of the Data and any proposed improvements thereto, and
- (ii) share anonymized insights on target customers and market applications;
(2) MethaneSAT may use aggregated or anonymized insights to refine its Data offerings.
ATTRIBUTION
If you share or use the Data in any manner with any third parties, you must:
- Explicitly state to these third parties that they are agreeing to be bound by the Terms of Use;
- Display a citation that states: “Data from MethaneSAT” and “Download the most current dataset at Google Earth Engine and/or Google Cloud”; and
- Explicitly state to these third parties that, if such third party creates a further project containing the Data, any such users of that project must also agree to be bound by these Terms of Use.
Explore with Earth Engine
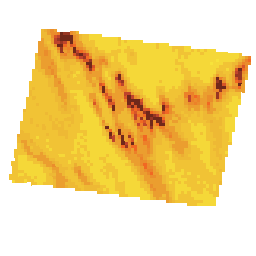
Code Editor (JavaScript)
// Request access to this data by filling out the form at: https://forms.gle/jqw4Mvr63dsV1fUF8
var dataset = ee.ImageCollection("projects/edf-methanesat-ee/assets/public-preview/L4area_v2")
  .filterDate('2024-11-01', '2025-05-01')
  .select("mean_flux");

// Visualization
var colorRange = [
  "#F9ED3B", "#F7E33A", "#F5D838", "#F1C335", "#EEB934", "#ECAE32","#EB9E2F",
  "#EA8D2C", "#EC8129", "#F16823", "#D85627", "#BF442C", "#983623", "#70281A"
];

var fluxVisParams = {
  bands: ['mean_flux'],
  min: 0,
  max: 13,
  palette: colorRange,
};

// By default, Earth Engine will use the colors provided in the 'palette' param above
// to define a "color ramp" or gradient. Each color in the 'palette' is mapped to a value evenly
// distributed between 'min' and 'max'. For intermediate values, Earth Engine maps the values
// linearly to a color in between, creating a gradient effect.
// This function forces pixel colors to be one of the 14 colors listed above in colorRange rather
// than using additional in between colors when a gradient is applied.
var prepColorPalette = function(image) {
  var img0000 = image.gte(0);
  var img0025 = image.gte(4);
  var img0050 = image.gte(8);
  var img0090 = image.gte(14.4);
  var img0150 = image.gte(24);
  var img0225 = image.gte(26);
  var img0325 = image.gte(52);
  var img0450 = image.gte(72);
  var img0600 = image.gte(96);
  var img0775 = image.gte(124);
  var img0975 = image.gte(156);
  var img1200 = image.gte(192);
  var img1450 = image.gte(232);
  var img1700 = image.gte(272);

  return img0000
    .add(img0025)
    .add(img0050)
    .add(img0090)
    .add(img0150)
    .add(img0225)
    .add(img0325)
    .add(img0450)
    .add(img0600)
    .add(img0775)
    .add(img0975)
    .add(img1200)
    .add(img1450)
    .add(img1700);
}
var images = dataset.map(prepColorPalette);

Map.setCenter(-98.72, 36.49, 4);
Map.addLayer(images, fluxVisParams, 'Methane area sources flux');