Page Summary
-
This dataset provides annual, summertime, and wintertime surface urban heat island intensities for day and night across over 10,000 global urban clusters.
-
The dataset was developed using various data sources including MODIS land surface temperature products, urban extent databases, terrain elevation data, and land cover data.
-
Data is available both at the pixel level (300m resolution) and as urban cluster means, spanning from 2003 to 2018.
-
This specific asset contains cluster-mean monthly composites of daytime and nighttime SUHI intensity.
- Dataset Availability
- 2003-01-01T00:00:00Z–2018-12-31T00:00:00Z
- Dataset Producer
- Yale Center for Earth Observation (YCEO)
- Tags
Description
This dataset contains annual, summertime, and wintertime surface urban heat island (SUHI) intensities for day and night for over 10,000 urban clusters throughout the world. The dataset was created using the MODIS 8-day TERRA and AQUA land surface temperature (LST) products, the Landscan urban extent database, the Global Multi-resolution Terrain Elevation Data 2010, and the European Space Agency (ESA) Climate Change Initiative (CCI) land cover data using the Simplified Urban-Extent Algorithm. The product is available both at the pixel level (at 300 m resolution after downscaling) and as urban cluster means from 2003 to 2018. The monthly composites are only available as urban cluster means.
A summary of older versions, including changes from the dataset created and analyzed in the originally published manuscript can be found on the Yale Center for Earth Observation website. The dataset can also be explored using the Global Surface UHI Explorer web application.
The dataset is split into the following six components:
UHI_all_averaged: Image containing cluster-mean composite daytime and nighttime SUHI intensity for annual, summer, and winter.
UHI_monthly_averaged: Image containing cluster-mean monthly composites of daytime and nighttime SUHI intensity.
UHI_yearly_averaged: Image collection of cluster-mean yearly composites of daytime and nighttime SUHI intensity from 2003. to 2018.
UHI_yearly_pixel: Image collection of spatially disaggregated (nominal scale of 300 m) annual daytime and nighttime SUHI intensity from 2003 to 2018.
Summer_UHI_yearly_pixel: Image collection of spatially disaggregated (nominal scale of 300 m) summertime daytime and nighttime SUHI intensity from 2003 to 2018.
Winter_UHI_yearly_pixel: Image collection of spatially disaggregated (nominal scale of 300 m) wintertime daytime and nighttime SUHI intensity from 2003 to 2018.
This asset is the second component.
Bands
Bands
Pixel size: 300 meters (all bands)
| Name | Units | Pixel Size | Description |
|---|---|---|---|
Jan_day_UHI |
°C | 300 meters | January Daytime UHI |
Jan_night_UHI |
°C | 300 meters | January Nighttime UHI |
Feb_day_UHI |
°C | 300 meters | February Daytime UHI |
Feb_night_UHI |
°C | 300 meters | February Nighttime UHI |
Mar_day_UHI |
°C | 300 meters | March Daytime UHI |
Mar_night_UHI |
°C | 300 meters | March Nighttime UHI |
Apr_day_UHI |
°C | 300 meters | April Daytime UHI |
Apr_night_UHI |
°C | 300 meters | April Nighttime UHI |
May_day_UHI |
°C | 300 meters | May Daytime UHI |
May_night_UHI |
°C | 300 meters | May Nighttime UHI |
Jun_day_UHI |
°C | 300 meters | June Daytime UHI |
Jun_night_UHI |
°C | 300 meters | June Nighttime UHI |
Jul_day_UHI |
°C | 300 meters | July Daytime UHI |
Jul_night_UHI |
°C | 300 meters | July Nighttime UHI |
Aug_day_UHI |
°C | 300 meters | August Daytime UHI |
Aug_night_UHI |
°C | 300 meters | August Nighttime UHI |
Sep_day_UHI |
°C | 300 meters | September Daytime UHI |
Sep_night_UHI |
°C | 300 meters | September Nighttime UHI |
Oct_day_UHI |
°C | 300 meters | October Daytime UHI |
Oct_night_UHI |
°C | 300 meters | October Nighttime UHI |
Nov_day_UHI |
°C | 300 meters | November Daytime UHI |
Nov_night_UHI |
°C | 300 meters | November Nighttime UHI |
Dec_day_UHI |
°C | 300 meters | December Daytime UHI |
Dec_night_UHI |
°C | 300 meters | December Nighttime UHI |
Terms of Use
Terms of Use
Citations
Chakraborty, T., & Lee, X. (2019). A simplified urban-extent algorithm to characterize surface urban heat islands on a global scale and examine vegetation control on their spatiotemporal variability. International Journal of Applied Earth Observation and Geoinformation, 74, 269-280. doi:10.1016/j.jag.2018.09.015
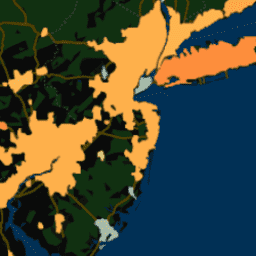
Explore with Earth Engine
Code Editor (JavaScript)
var dataset = ee.Image('YALE/YCEO/UHI/UHI_monthly_averaged/v4');

var visualization = {
  bands: ['Jan_day_UHI'],
  min: -1.5,
  max: 7.5,
  palette: [
    '313695', '74add1', 'fed976', 'feb24c', 'fd8d3c', 'fc4e2a', 'e31a1c',
    'b10026']
};

Map.setCenter(-74.7, 40.6, 7);

Map.addLayer(dataset, visualization, 'January Daytime UHI');